Key Takeaways
- Organic search becomes forecastable when CAC is segmented by service line and benchmarked against patient lifetime value, since a $3,000 primary care patient and a $5,000 cosmetic case tolerate very different acquisition ceilings 4.
- Past five locations, the failure mode is coordination, not content quality — per-location retainers multiply briefing cycles while a service-line launch demands one brief deployed in parallel across every site.
- The five-layer stack — Google Business Profile, location pages, clinically-authored content, technical foundation, and authority signals — only compounds when it shares one service-line and location taxonomy rather than running as parallel workstreams.
- Growth directors should defend five KPIs: LTV-adjusted CAC by service line, organic-attributed appointments including GBP and tracked calls, branded versus non-branded share, location-level 3-Pack visibility, and review velocity with response SLA 24.
Channel Economics Before Tactics: What Organic Search Actually Costs a Medical Group
Most SEO conversations inside medical groups start with tactics — schema, page speed, review velocity — and skip the economics that decide whether the channel deserves a budget line at all. The right entry point is unit cost. Healthcare practices running coordinated organic programs have reported organic traffic gains of 243% alongside a 65% reduction in patient acquisition cost relative to paid search 1. That gap is what makes organic forecastable: paid CAC stays roughly flat with auction inflation, while organic CAC declines as the asset base — location pages, clinical content, citations — compounds against fixed production cost.
The math only works if the channel is sized against patient lifetime value rather than first-visit revenue. A primary care patient retained over five years generates roughly $3,000 in cumulative value; a single cosmetic surgery patient can generate around $5,000 in one procedure cycle 4. Those two LTV profiles tolerate very different CAC ceilings, and they imply different organic content strategies — recurring-care content for primary care, high-intent procedure pages for cosmetic. A growth director defending an organic budget should walk into the finance review with an LTV-segmented CAC target per service line, not a blended number.
Budget pressure makes the channel economics question more urgent, not less. Healthcare marketing spend has been compressing as a share of revenue, which raises the cost of every uncoordinated workstream that produces overlapping briefs, duplicate keyword research, or stranded location pages 3. Organic search rewards portfolio thinking: one clinical content asset can rank for non-branded queries across every location it is mapped to, while a paid campaign has to be funded per market, per quarter, indefinitely. The strategic question for a 5–50 location group is not whether to run SEO, but how to run it so the per-location marginal cost of an additional ranking page trends toward zero.
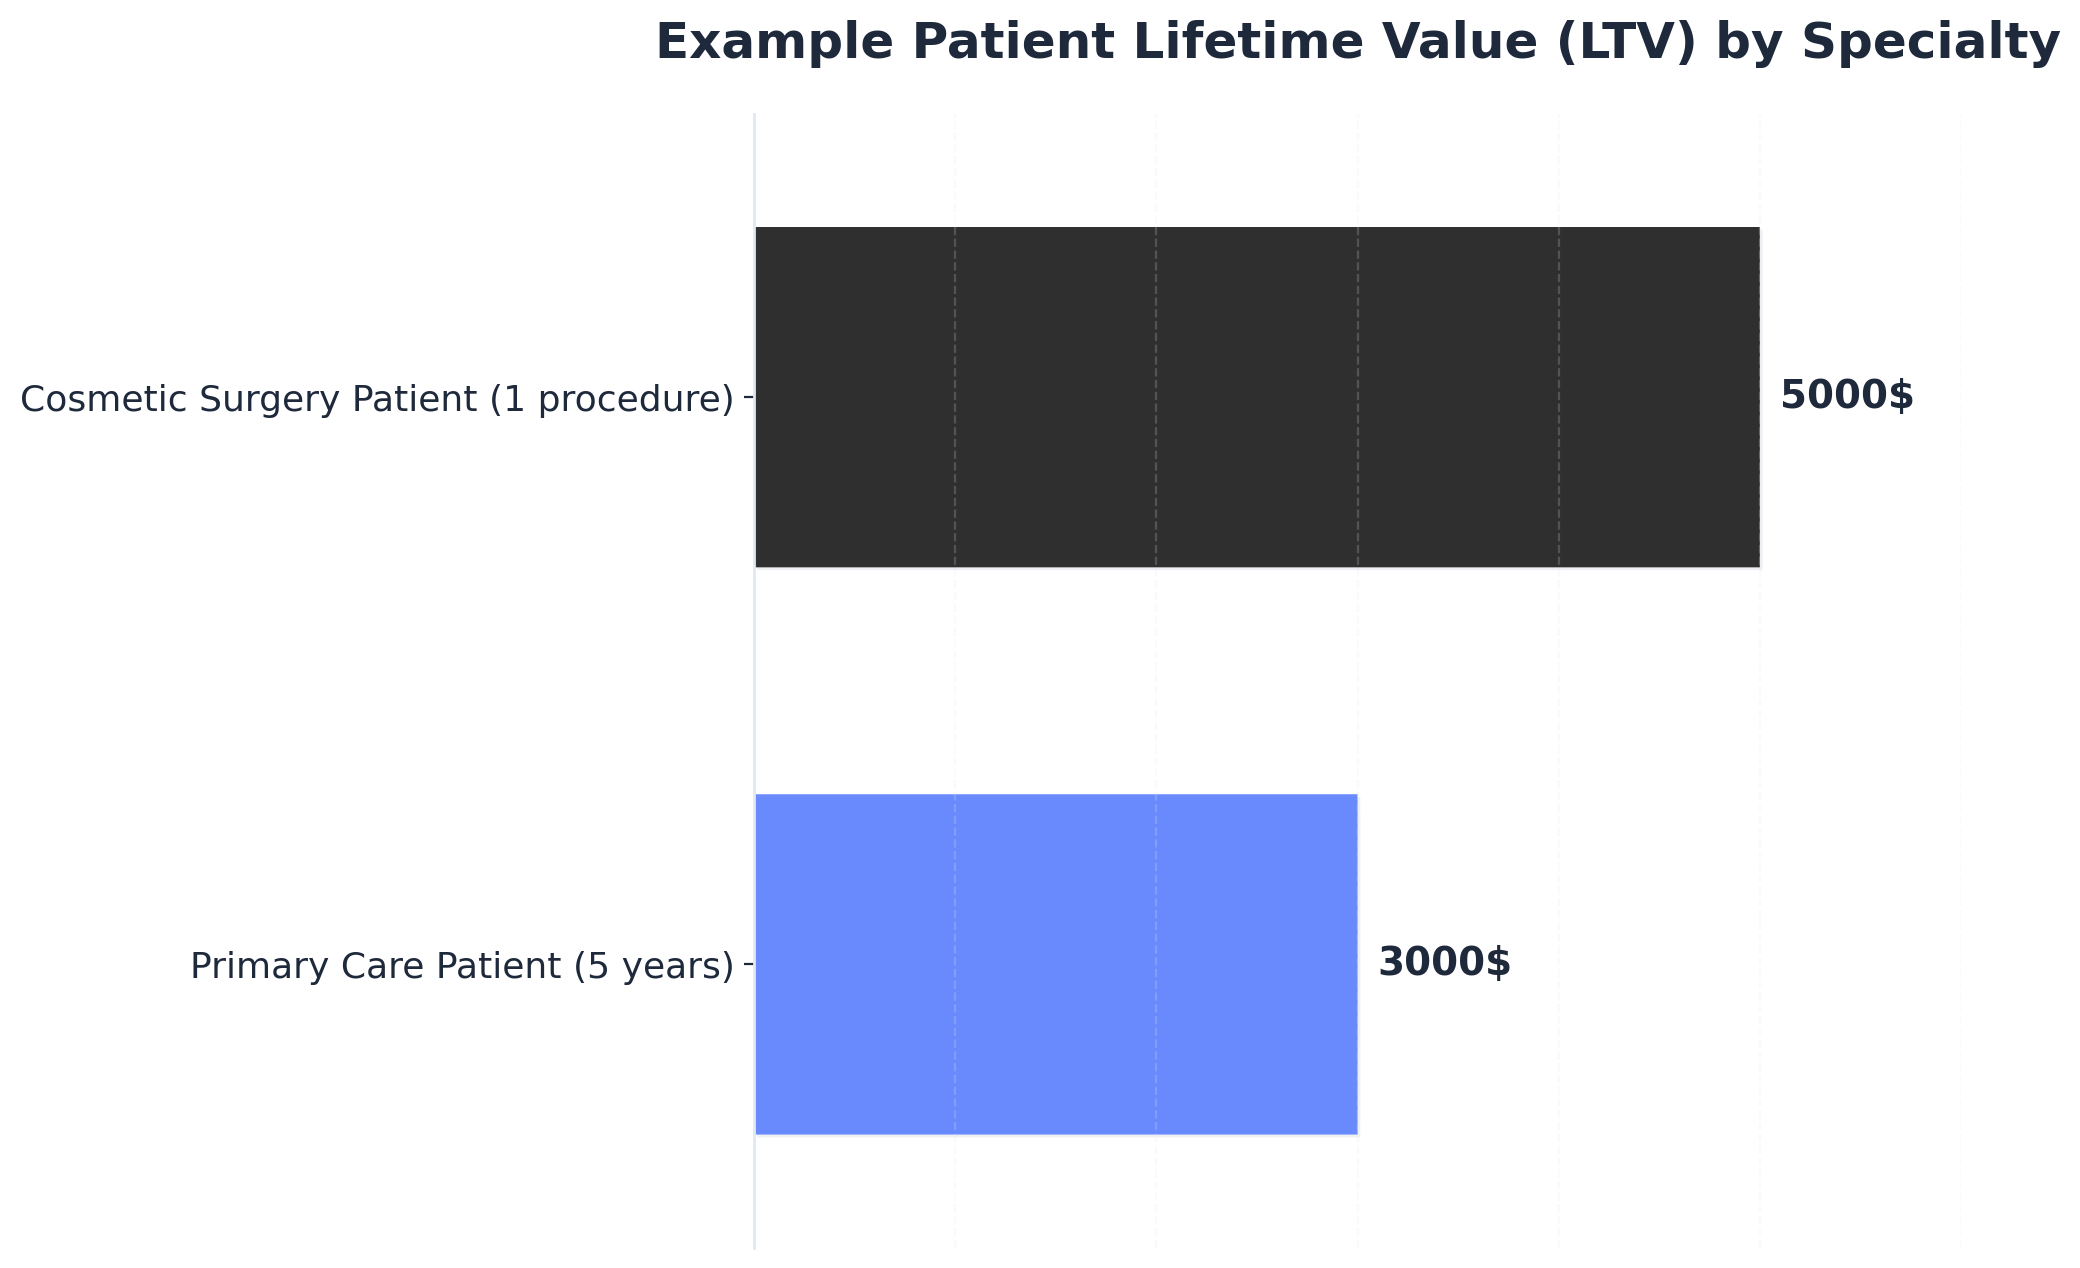 Example Patient Lifetime Value (LTV) by Specialty
Example Patient Lifetime Value (LTV) by Specialty: Primary Care Patient (5 years): $3000, Cosmetic Surgery Patient (1 procedure): $5000. This data provides an example comparison of patient lifetime value between a recurring primary care patient and a one-time cosmetic surgery patient.
The Coordination Problem at 5–50 Locations
A solo practice can run organic search as a single workstream. A 12-location orthopedic group cannot. Once a medical group crosses roughly five sites, the failure mode shifts from "we need better content" to "our content, technical, local, and link teams are working from four different briefs." The symptom is familiar: a new sports medicine service line launches, and three months later only seven of twelve location pages exist, four Google Business Profiles still list the wrong service categories, and the clinical content team is mid-draft on a procedure explainer that the SEO team already commissioned externally.
The drag is structural to the vendor model. Per-location SEO retainers produce per-location keyword research, per-location citation audits, and per-location reporting decks — none of which roll up cleanly to a portfolio view. Meanwhile, central content vendors brief on a national calendar that ignores which markets actually have ranking gaps. The result is duplicated research cost, stranded assets, and launch cycles measured in quarters rather than weeks.
Patient-side, the cost of that drag is concrete. Patients evaluating a provider look for a predictable set of inputs: location and accessibility, practitioner credentials, reviews, specific service offerings, and insurance acceptance 9. When a single location's page is missing two of those five inputs because the briefing cycle stalled, the click goes to a competitor whose page is complete. Coordination is not an internal preference. It is the difference between capturing demand at the moment of search and donating it to the next 3-Pack result.
How Patients Now Discover Doctors
Search Behavior, AI Overviews, and the Zero-Click Reality
Discovery has stopped looking like a ranked list of blue links. Roughly 77% of patients now search online before booking, and 87% of those queries trigger an AI-generated response that assembles its answer from Google Business Profile data, review snippets, and structured content rather than handing the user a SERP to scroll 6. Zero-click results have crossed 70% of health-related queries, which means the visibility a medical group earns increasingly converts attention without ever producing a session in GA4.
For a growth director, that reframes what "ranking" measures. A procedure explainer that gets summarized inside an AI overview can still drive a phone call to the nearest location, but the attribution trail starts at the GBP listing or the booking page, not at an organic landing. The implication is content-format, not content-volume. Pages that survive zero-click need crisp, extractable answers — defined terms, structured FAQs, schema-marked pricing and insurance information, clinician-authored definitions — because those are the elements an AI surface can lift cleanly.
The same shift raises the cost of being absent. If an AI overview names three competing groups by their service category, NAP data, and review aggregate, a fourth practice missing one of those inputs is not ranked lower; it is not in the answer at all. Coordination across content, technical schema, and local data stops being a tidiness exercise and becomes the precondition for appearing in the surface where most patient discovery now ends.
The Local 3-Pack as the Primary Conversion Surface
About 47% of all local business searches are healthcare-related, and the Google Local 3-Pack captures roughly 42% of local search clicks 6. For a multi-location group, those two numbers compress into a single operating reality: the 3-Pack is the conversion surface that decides whether a query in a given metro becomes an appointment at one of your sites or a competitor's.
What enters the 3-Pack is not what ranks on a desktop SERP. Proximity to the searcher, GBP category accuracy, review volume and recency, and service-level signals matter more than backlink authority to the parent domain. A cardiology group with a strong national site and three locations whose GBPs list "Medical Clinic" instead of "Cardiologist" will lose 3-Pack placement to a single-location competitor with the right primary category and 40 recent reviews.
Patient behavior compounds the weight of that surface. Reviews are read by 85% of patients before they choose a provider 2, and the 3-Pack is where review counts and star averages appear before any click happens. The practical takeaway for a growth director is to treat each location's GBP as a ranking asset with its own production cadence — categories, services, photos, posts, review responses — rather than as a directory listing the office manager updates when something changes.
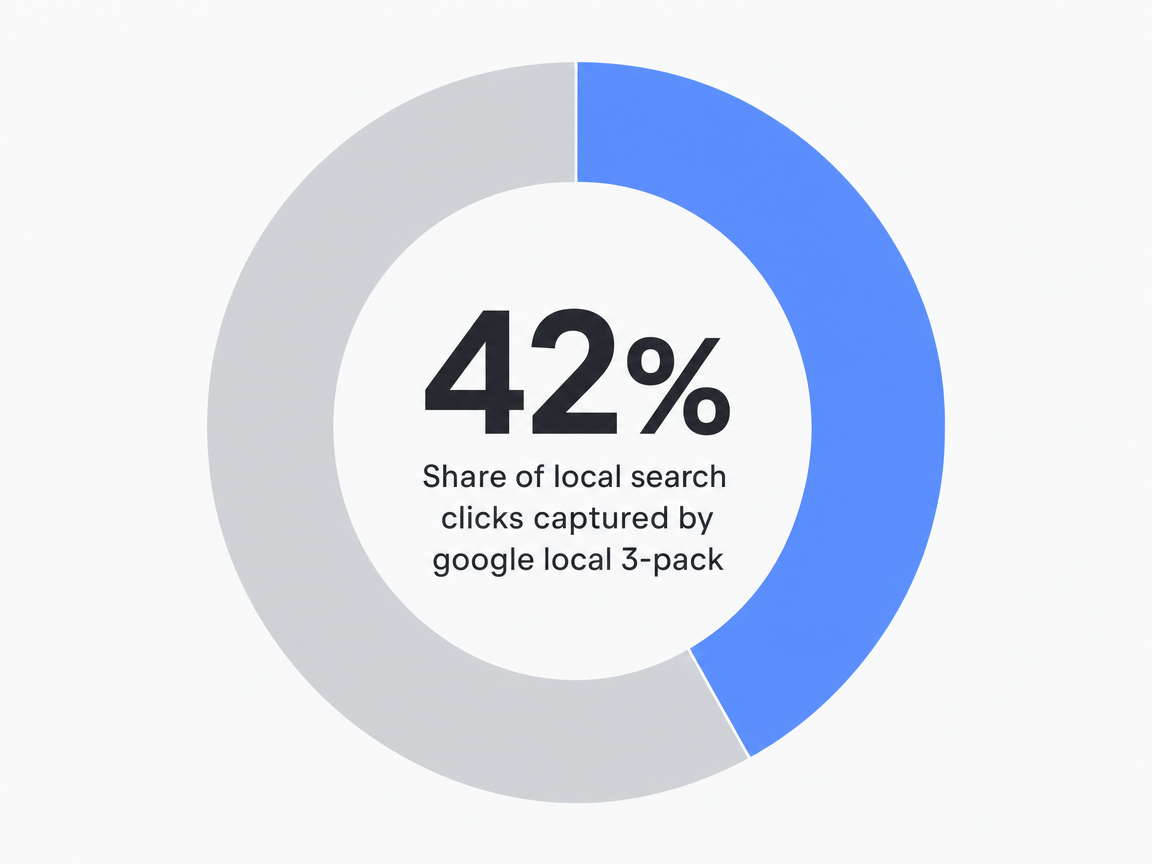 Share of local search clicks captured by google local 3-pack: 42%
Experience Predictable Patient Growth With Real SEO
See measurable improvements in patient acquisition with data-driven SEO content published live during your free trial.
The Five-Layer Visibility Stack
Google Business Profile as the Account-Level Asset
The Google Business Profile is where most patient discovery now ends, not where it begins. With the 3-Pack capturing the bulk of local healthcare clicks and AI overviews pulling NAP data, service categories, and review aggregates directly from GBP fields, each location's profile is a ranking asset with its own production cadence — not a directory entry the office manager updates ad hoc.
The operating shift for a 5–50 location group is to manage GBPs as a portfolio. Primary category accuracy (a cardiology location listed as "Cardiologist," not "Medical Clinic"), secondary service categories mapped to each clinician's actual procedures, weekly Posts tied to the same content calendar that feeds the website, photo refresh cycles, and review-response SLAs measured in hours rather than days. Specialty practices that treat GBP this way — managing categories, posts, and review velocity as scheduled work — capture local visibility that single-location competitors with smaller domain authority routinely beat them on 10.
The reporting consequence: GBP Insights — calls, direction requests, booking clicks — belongs in the same dashboard as organic sessions, not in a separate local report nobody opens.
Location Pages: The Architecture That Scales Across Sites
Location pages are where multi-site groups either compound their organic asset base or strand it. The architecture decision is whether each page is a templated stub with a swapped address block, or a structured asset that combines location-specific signals (address, hours, parking, accepted insurance, on-site clinicians, languages spoken) with service-specific signals (procedures performed at that site, equipment available, patient education modules) under a shared schema spine.
The page has to answer the predictable inputs patients actually evaluate before booking: location and accessibility, practitioner credentials, reviews, specific service offerings, and insurance acceptance 9. A location page missing two of those five inputs is not penalized abstractly — it loses the click to a competitor whose page is complete.
What scales the architecture is component reuse. A clinician bio module written once, surfaced on every location page where that provider works. A procedure block authored once at the service-line level, deployed to every location offering it with location-specific clinicians and pricing variables filled in. A review widget pulling from the GBP for that exact location, not the parent domain. The result is a page system where launching a new service line across twelve locations is a deployment, not twelve briefing cycles. Patient-led UX research — recruiting actual patients rather than internal staff to evaluate the page system — is what catches the gaps internal teams stop seeing 11.
Clinical Content and the E-E-A-T Production Constraint
Clinical content is the layer most growth directors underbudget, because the production constraint is not writing speed — it is clinician availability. Google's E-E-A-T evaluation for medical content (Experience, Expertise, Authoritativeness, Trustworthiness) treats author credentials, citation density, and clinical accuracy as ranking inputs, which means a procedure explainer ghostwritten by a generalist freelancer and signed by a marketing manager will not perform like one authored or reviewed by a board-certified specialist on staff. 72% of healthcare marketers cite content production as their most effective SEO tactic, but the lift only materializes when the content carries verifiable clinical authorship 3.
The practical bottleneck is the review queue. A urology group producing 40 procedure pages and 60 condition explainers across a year needs roughly 100 clinician review slots — 30 to 60 minutes each — scheduled against a clinical calendar that prioritizes patient throughput. Without a production system that batches review, pre-fills draft language for clinician edit rather than blank-page authoring, and tracks approval status by SLA, the content engine stalls at the bottleneck rather than the brief.
Content that survives in AI-overview surfaces also has a format constraint: defined terms, structured FAQ blocks, schema-marked clinical entities, and citation links to peer-reviewed sources. Patient engagement research shows that the same elements — clinician-shared clinical information paired with patient-relevant context — drive higher adherence and satisfaction once the patient becomes a patient 8. The content layer earns the click and conditions the relationship.
Technical Foundation and Authority Signals
The technical layer is the floor, not the ceiling. Mobile rendering, Core Web Vitals, schema implementation (MedicalOrganization, Physician, MedicalProcedure, FAQPage), HTTPS, crawl-clean sitemaps, and indexable hreflang for multi-region groups are table stakes. With the majority of healthcare traffic now arriving on mobile, a 4-second mobile load on a location page does not just hurt rankings — it forfeits the booking intent the rest of the stack worked to generate.
Authority signals are what differentiate parity-level technical sites in the same metro. Citations from health systems the group is affiliated with, links from medical associations, mentions in local news coverage of clinician achievements, and inclusion in condition-specific resource lists carry more weight than volume-based directory submissions. Reviews function as a parallel authority signal: 85% of patients read online reviews before selecting a provider, and review aggregates feed both the 3-Pack ranking and the AI-overview snippet that may replace the click entirely 2.
The coordination point across these layers is that schema, page templates, internal linking, and link-acquisition targeting all reference the same service-line and location taxonomy. When the technical team ships a new schema field for a procedure, the content team's existing pages inherit it; when the link team earns a citation pointing to a service-line hub, every mapped location page benefits. That is what "stack" means operationally — shared spine, not parallel workstreams.
Operating Models: Per-Location Retainers vs. Centralized vs. Coordinated Production
Three operating models compete for the organic budget at a 5–50 location group, and the choice between them determines whether the visibility stack ships as one system or stalls as four. The per-location retainer model contracts a separate local SEO vendor for each site, often supplemented by a national content agency and an in-house webmaster. The centralized in-house model hires a director of SEO, two to four specialists, and a content team reporting to marketing. The coordinated production model runs strategy, content, technical, local, and link work from a single account-level plan against a shared service-line and location taxonomy.
The cost basis differs less than the briefing math. Per-location retainers multiply fixed agency overhead across every site, then multiply briefing cycles by the same factor — a new procedure page launching across twelve locations requires twelve scoping calls, twelve keyword reviews, and twelve invoicing cycles before the first draft exists. Centralized in-house teams compress the briefing surface but reintroduce capacity ceilings: a four-person team backed up on clinician review for one service line cannot also ship a 3-Pack remediation across forty GBPs that quarter.
| Dimension | Per-Location Retainers | Centralized In-House | Coordinated Production |
|---|---|---|---|
| Cost basis | N × per-location retainer + national content + tech | Fixed salary base + tooling + freelance overflow | Account-level fee, scales with output not site count |
| Briefing cycles per service-line launch | One per location (N) | One central brief, sequential execution | One brief, parallel deployment across sites |
| Time-to-publish: new service line, all locations | Quarters | Weeks to months, gated by team capacity | Weeks, gated by clinician review |
| Reporting surface | Per-location decks, no portfolio rollup | Portfolio dashboard, manual consolidation | Portfolio + per-location, shared taxonomy |
| Authority compounding | Fragmented; links pointed at individual sites | Concentrated on parent domain | Service-line hubs cascade to mapped locations |
The patient-side test cuts through the model debate. A new service line is announced; how many weeks until every location offering it has a complete page, an updated GBP service category, a clinician-reviewed procedure explainer, and at least one earned citation pointing at the service-line hub? That latency, measured in weeks rather than vendor count, is the number a growth director should defend against finance — because it converts directly into bookings the group either captures or forfeits to whichever competitor shipped first.
Unlock Predictable Patient Acquisition With Data-Driven SEO for Medical Practices
Discover how healthcare growth teams and agencies use AI-powered workflows to drive 30%+ increases in patient inquiries through unified, measurable SEO strategies—no manual coordination required.
Forecasting Pipeline: From Visibility Gains to Booked Appointments
Forecasting organic pipeline starts with rejecting the temptation to model traffic. Sessions are an upstream proxy; bookings are the dependent variable. The chain a growth director needs to defend in a finance review runs in five steps: ranked impressions in a service-line and metro pair, qualified clicks or assisted GBP actions, intent-matched landing arrivals, completed booking events, and patient-lifetime-value-adjusted revenue. Each step has a conversion rate that, once instrumented across two or three quarters of data, becomes the multiplier the model leans on.
The LTV layer is what makes the forecast credible across service lines. A 0.8% landing-to-booking rate looks weak in isolation; against a $5,000 cosmetic procedure LTV it tolerates a CAC ceiling that a 3% primary-care booking rate against $3,000 cumulative LTV cannot match 4. Growth directors building the model service-line by service-line — rather than blending bookings across the portfolio — surface which content investments actually pencil and which ones are subsidizing volume that will never recover its production cost.
Two mechanics break naive forecasts. Zero-click conversions arrive as direct calls or GBP booking clicks with no organic session attached, so a session-only model understates the channel by whatever share of patient discovery now ends inside the AI overview or 3-Pack surface. And compounding lag means a service-line page launched in month one rarely ranks before month four; the forecast has to phase production cost ahead of pipeline credit, with the asset base — and its declining marginal CAC — pulling forward only after the indexing and authority curve catches up. A defensible model carries both: a multi-touch attribution view that credits GBP and direct-call paths against the content that fed them, and a cohort curve that shows when each quarter's published assets begin contributing booked appointments.
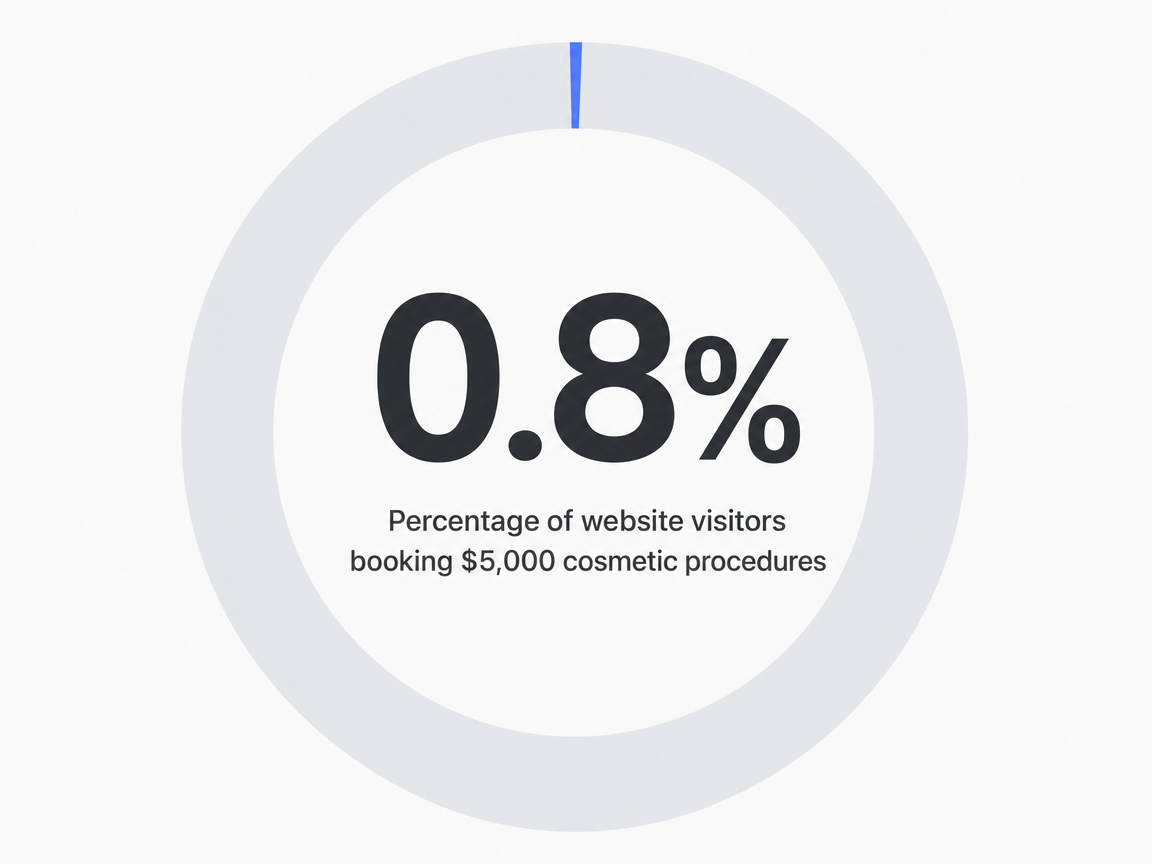 Percentage of website visitors booking $5,000 cosmetic procedures: 0.8%
Reporting Surface: KPIs a Growth Director Should Defend
The reporting deck a growth director carries into a quarterly review is not a list of vanity metrics — it is the evidence that organic search is producing booked patients at a defensible cost. Five KPIs do that work. Cost per acquired patient, segmented by service line and adjusted against patient lifetime value, is the headline number; a $180 organic CAC against a $3,000 primary care LTV reads differently than the same CAC against a $5,000 cosmetic procedure 4. Organic-attributed appointments — counted across last-click sessions, GBP booking actions, and tracked direct calls — replace traffic as the channel's primary output.
Branded versus non-branded organic share is the leading indicator finance reviewers underweight. A practice growing booked appointments mostly through branded queries is harvesting reputation, not building demand; a rising non-branded share signals the content and local layers are pulling new patients into the funnel. Local pack visibility tracked at the location-and-service-line grain — not domain-wide — surfaces which markets are converting and which GBPs need category, review, or post intervention. Review velocity and response SLA round out the surface, because review aggregates feed both 3-Pack ranking and the AI-overview snippet that increasingly replaces the click 2. Tracking these systematically is what lets healthcare organizations align spend, operations, and strategic decisions against compliance and growth targets at once 57.
Frequently Asked Questions
References
- 1.SEO for healthcare: How to boost your medical practice's organic traffic..
- 2.The Influence of Doctors' Online Reputation on the Sharing of....
- 3.Top Five Health Care Trends for 2026: How New Technology Is Transforming Patient Care..
- 4.How to calculate patient lifetime value..
- 5.Foundational benchmarks and KPIs for medical practice operations..
- 6.Medical Practice Visibility Strategies for 2026 - Top Doctor Magazine.
- 7.Top 26 Healthcare KPIs & Quality Metric Examples for 2026 Reporting.
- 8.Engaging patients in decision-making and behavior change in health care. PMC - National Center for Biotechnology Information.
- 9.Factors influencing patients' preferences and perceived involvement in treatment decisions. PMC - National Center for Biotechnology Information.
- 10.SEO for Orthodontic Practices: The Complete Guide. Sturgill Orthodontics.
- 11.User Experience in Health & Medicine: Building Methods for Patient Experience Design. PMC - National Center for Biotechnology Information.