Key Takeaways
- Patient acquisition cost varies up to 2.7x between urban and rural markets, so allocating SEO budget by location count rather than PAC variance subsidizes underperformers and starves the markets that compound 5.
- Per-location agency retainers collapse under coordination cost between 15 and 25 sites; account-level execution consolidates strategy, medical review, citations, and reporting into one operating system 6.
- Medical accuracy review—not writing—is the throughput constraint, and tiered review tracks plus structured templates compress production cycles without adding clinical SME hours.
- Focus next on differentiated location pages fed by structured data, account-level review velocity systems, and reporting cuts that tie organic performance to the 3:1 LTV:PAC benchmark.
The Economics That Govern Multi-Location Patient Acquisition
A 40-location dermatology group does not have one SEO problem. It has forty intersecting P&Ls, each with a different patient acquisition cost, a different competitive density, and a different ceiling on lifetime value. The operators winning organic share in 2026 understand this before they touch a title tag.
Search remains the entry point. Roughly 77% of patients use search engines before booking a medical appointment, which makes organic visibility a fixed cost of being in the patient acquisition business rather than a discretionary marketing line 1. The strategic question is no longer whether to invest, but how to allocate a finite content and link budget across a footprint where the unit economics swing wildly by zip code.
Two numbers anchor the math. The accepted benchmark for a healthy practice is a 3:1 ratio of patient lifetime value to acquisition cost, the line below which growth spend stops compounding and starts subsidizing churn 5. Against that benchmark, PAC itself is not constant. A patient acquired in a dense urban market can cost roughly $150, while the same acquisition in a rural market can run closer to $400—a 2.7x spread that quietly destroys any strategy built on uniform per-location budgets 5.
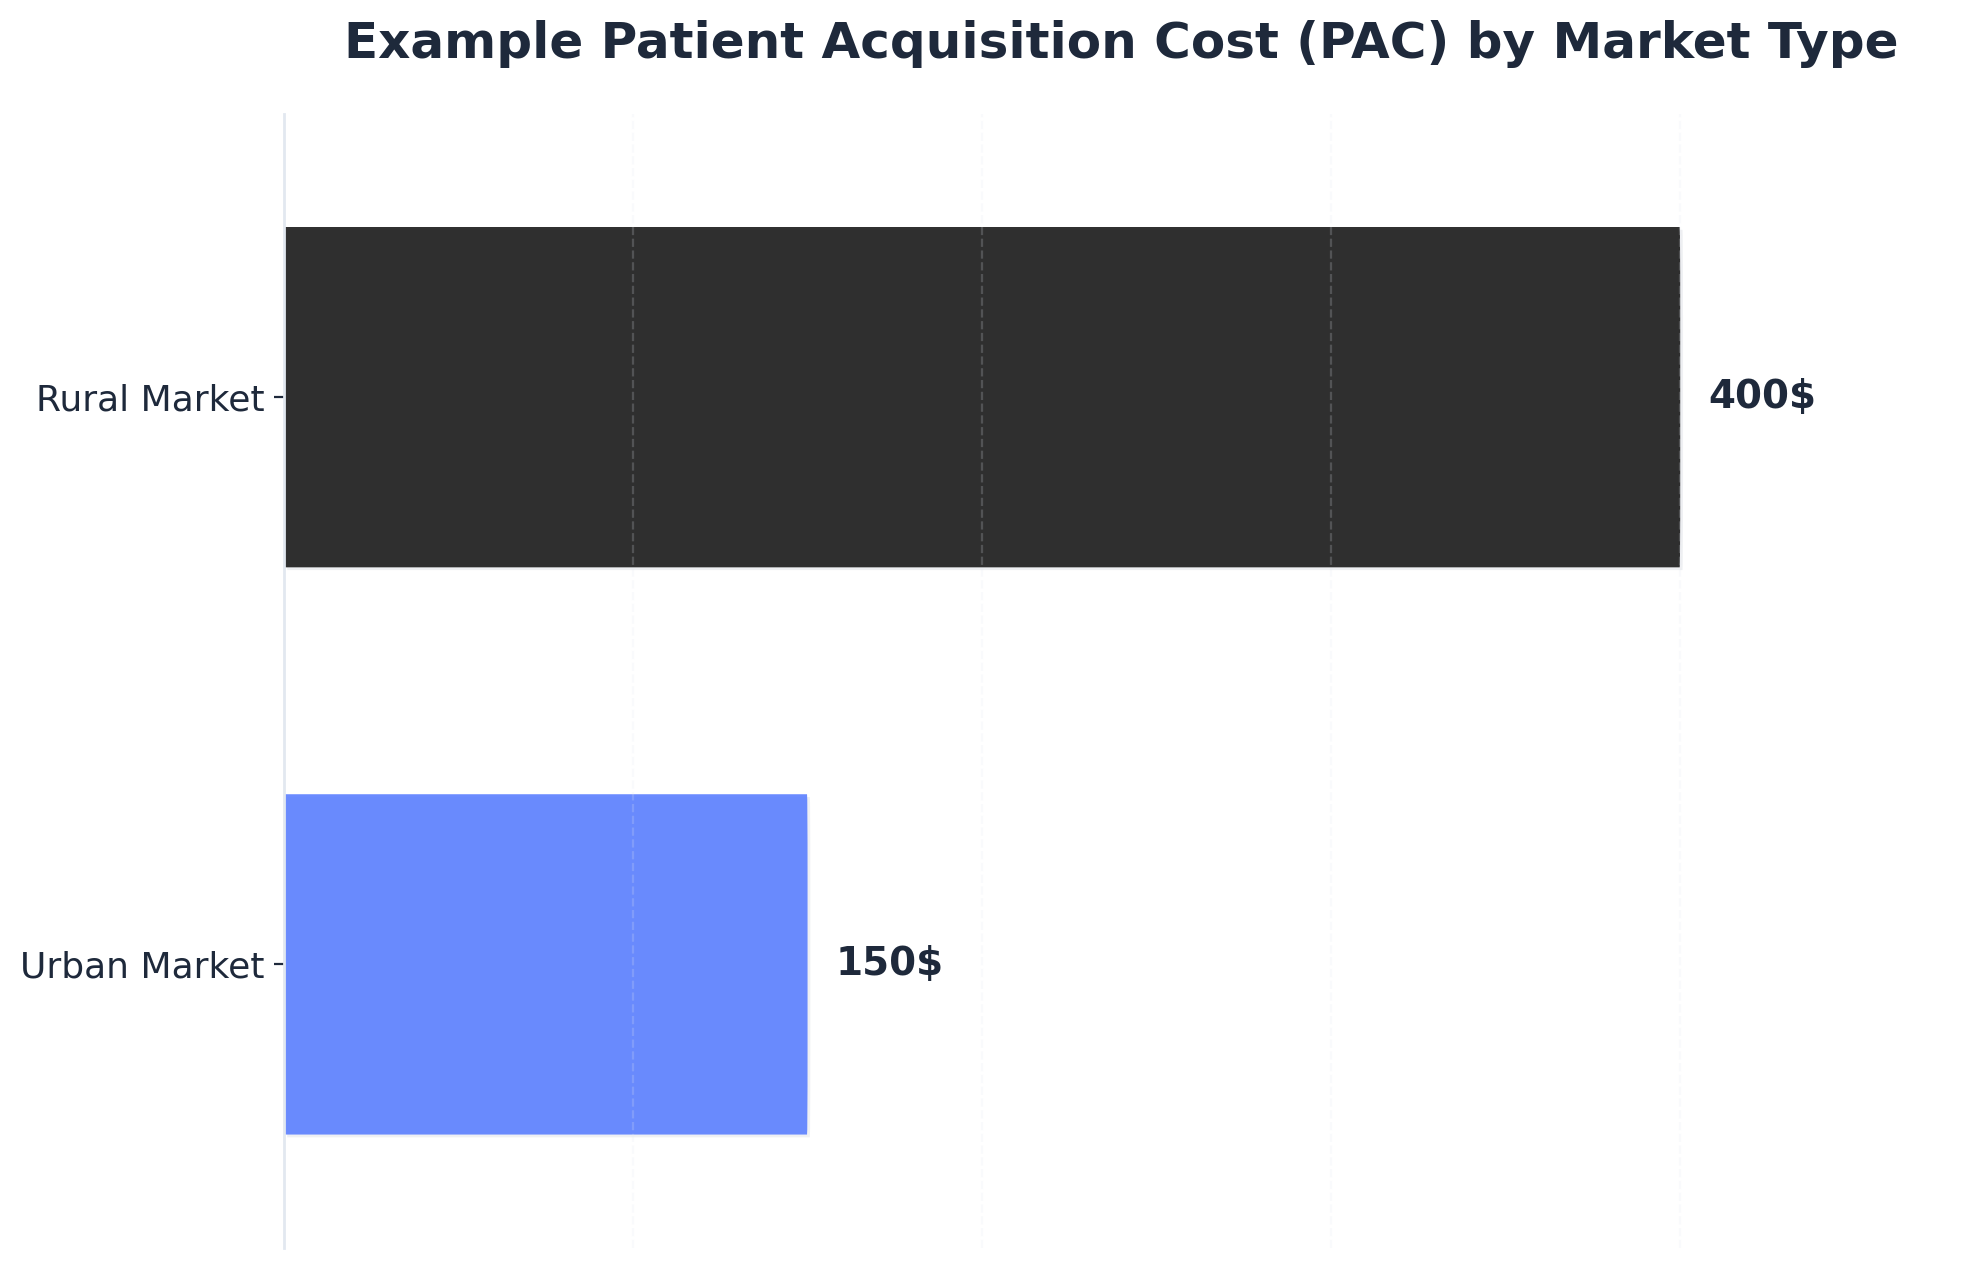 Example Patient Acquisition Cost (PAC) by Market Type
Example Patient Acquisition Cost (PAC) by Market Type: Urban Market: $150, Rural Market: $400. Illustrates how Patient Acquisition Cost can vary significantly between different geographic markets, which informs strategic resource allocation for multi-location practices.
That spread is the spine of every decision a multi-location marketing leader makes. It dictates which service lines warrant deep content investment in which markets, where review velocity matters more than backlink acquisition, and which locations should be harvested for cash flow rather than fed for growth. Treating all forty locations as equivalent budget recipients guarantees that the urban sites overperform their allocation while the rural sites burn capital chasing a PAC that the local LTV cannot support.
Why Per-Location Execution Breaks at Scale
The Coordination Drag of Distributed Agency Retainers
The standard playbook for a 40-location group looks tidy on a slide: one regional agency per market, each tuned to local search behavior, each reporting up to a central marketing team. In practice, it produces forty disconnected work streams that drift from any unified brand or keyword strategy within two quarters.
The drag shows up in three places. Approval cycles stretch because every agency runs its own briefing, review, and revision loop with the central team. Keyword targeting fragments because no single owner deconflicts overlapping service-line terms across nearby metros. Technical SEO standards diverge because each vendor ships its own schema patterns, page templates, and internal linking conventions onto a shared domain.
Healthcare organizations that scaled successfully past 50 locations consistently point to coordination failure—not tactical weakness—as the binding constraint on growth 6. The agencies were competent. The handoffs were the problem. Each retainer added another seat in the meeting, another reporting format, and another lag between strategy decision and site-level execution. The marketing leader ended up running a vendor-management function rather than a growth function.
Duplicate Location Pages as Portfolio Risk
The most common scaling shortcut is also the most expensive. A central team writes one location page template, swaps city names and addresses across forty URLs, and ships. Crawlers read it as forty near-duplicates competing against each other for the same set of local queries.
Google's local algorithm penalizes thin and duplicated content, and the dilution compounds as the footprint grows 2. At ten locations the impact is recoverable. At forty, the domain's local authority spreads across pages that cannibalize each other—none ranking strongly enough to win the local pack, all consuming crawl budget that could have funded service-line depth.
The portfolio math is unforgiving. If duplication suppresses average local pack visibility by even 15% across a 40-site footprint, the lost organic bookings translate directly into higher PAC across every location simultaneously. The marketing team does not see one broken page; it sees a system-wide degradation in conversion efficiency that shows up as a budget shortfall the next quarter.
The fix is not better copywriting on a per-page basis. It is a content production model that generates differentiated location pages by default—unique provider rosters, market-specific service mix, locally relevant conditions and seasonality, and earned signals like reviews and locally cited content. Differentiation has to be the production standard, not the editorial exception.
Consolidation Economics: Per-Location Retainers vs Account-Level Execution
The financial argument for consolidation is rarely about line-item savings. It is about what the operating model produces per dollar spent. A per-location retainer model multiplies fixed coordination overhead by the number of sites; an account-level model spreads a single strategy investment across the entire footprint.
Five dimensions separate the two structures in practice:
| Dimension | Per-Location Agency Retainer | Account-Level Coordinated Execution |
|---|---|---|
| Cost structure | Per-location retainer × N sites, plus internal coordination overhead | Single account fee covering all sites and service lines |
| Content throughput | Limited by each vendor's queue; review handoffs duplicated N times | Centralized production pipeline with one medical review workflow |
| NAP and citation consistency | Drifts as each vendor manages local listings independently | Single source of truth for NAP, GBP, and citation surfaces 2 |
| Medical accuracy review | Replicated per vendor; bottlenecks form at clinical SME availability | One reviewer queue serving all locations; SME time concentrated |
| Reporting granularity | Vendor-specific dashboards; rollup requires manual reconciliation | Account-level metrics with location and service-line cuts native |
The pattern across organizations that successfully scaled past the 50-location threshold is consistent: the per-location model collapses under coordination cost long before it collapses under media cost 6. Consolidation is not a procurement decision. It is a structural choice about whether the marketing organization can keep up with its own footprint.
The Account-Level Operating System
One Strategy Node, N Location Outputs
Account-level execution starts with a single planning surface that owns keyword strategy, service-line priorities, content calendars, and link targets across the full footprint. Locations become outputs of that plan, not authors of it.
The structural shift is subtle on paper and decisive in practice. A central strategy node holds the keyword universe for every service line the group offers, deconflicts overlapping terms across nearby metros, and sequences content production against the markets where PAC variance and competitive density justify the investment. Each location inherits a tailored subset of that universe—its own conditions, providers, intake rules, and seasonal demand curves—rather than commissioning a separate strategy from a separate vendor.
Three operational benefits compound from this structure. Internal linking becomes a portfolio decision, with hub-and-spoke architecture routing authority from service-line pillar pages to the locations that actually deliver those services. Schema and template changes ship once and propagate to every URL on the domain. And the marketing leader stops arbitrating between vendor recommendations and starts making one allocation call against a unified backlog. Coordination cost collapses because there is nothing left to coordinate between.
Differentiated Location Pages That Survive Crawl Comparison
A location page earns its place in the index by being unmistakably about one place. The production model has to enforce that by default, because editorial discipline alone does not survive forty pages or four hundred.
Five inputs separate a defensible location page from a flagged near-duplicate: the local provider roster with credentials and bios, the actual service mix offered at that site (not the corporate menu), conditions and procedures weighted to local demand, market-specific intake details such as insurance acceptance and hours, and locally earned signals like reviews, press mentions, and community partnerships. None of those inputs can be templated from a central CMS field. Each requires a structured data feed from operations, clinical, and local management.
The production implication is operational, not creative. Building forty differentiated pages requires forty differentiated data inputs, which means the marketing function has to own a pipeline into the practice management system, the credentialing database, and the local review platforms. Without that pipeline, every page production cycle becomes a manual interview with a regional manager who has better things to do, and the team defaults back to copy-paste.
Groups that scale this well treat the location page as a continuously refreshed data product rather than a one-time content asset. New providers, expanded service lines, and new reviews flow into the page automatically; the central team controls structure, schema, and the editorial guardrails that keep medical claims accurate 2.
NAP, GBP, and the Local Pack as a Single Citation Surface
Local visibility lives or dies on citation consistency. Name, address, and phone data flowing into Google Business Profile, healthcare directories, insurance finder tools, and third-party aggregators has to match across every surface, every quarter, for every location 2.
At forty sites, the failure mode is rarely a wrong address. It is drift. A suite number gets dropped on one aggregator. A new phone routes through a tracking number on the GBP listing but the legacy number on Healthgrades. A relocated practice updates its website but not its Yelp profile. Each inconsistency costs a small amount of trust in the local algorithm, and the cumulative effect across the footprint is a quiet decline in local pack appearances that nobody attributes to citation hygiene because nobody is watching the full surface.
The operational answer is a single source of truth for location data, syndicated outward to every directory and platform that matters, with monitoring on the return signal. GBP profiles, in particular, function as a primary ranking input for local intent queries and need active management—posts, Q&A, photos, service categories, and review responses—not just an annual audit. One central operator running that surface across the footprint outperforms forty local agencies running it in parallel, every time.
Test Unified SEO Execution for Medical Practices
Experience multi-location SEO scaling with real campaigns, data, and measurable outcomes during your free trial.
Medical Accuracy Review as the Throughput Constraint
Content production for a healthcare footprint does not bottleneck at writing. It bottlenecks at clinical sign-off.
A typical 12-stage production flow—keyword brief, outline, draft, editorial pass, medical review, legal review, schema, internal linking, publish, indexation check, performance tracking, refresh—runs at the speed of its slowest gate. In every multi-location healthcare program, that gate is the medical reviewer queue. A single physician or clinical lead reviewing condition pages, procedure descriptions, and provider bios for accuracy across forty locations becomes the binding constraint on how fast organic surface area can grow. Hire more writers and the queue gets longer, not shorter.
The operational mistake is treating accuracy review as a compliance checkbox bolted onto the end of production. Reviewed correctly, it is a throughput design problem. Three levers compress cycle time without compromising clinical integrity: structured review templates that pre-flag the specific claims requiring sign-off rather than asking a reviewer to read every word, tiered review tracks that route low-risk content (provider bios, location details, general wellness topics) through lighter workflows while reserving deep clinical review for procedure pages and condition explanations, and asynchronous review queues that let reviewers batch work in dedicated blocks rather than interrupting clinical schedules.
Production systems that automate the staging—auto-generating review-ready drafts with citations attached, flagging medical claims for reviewer attention, and tracking turnaround by reviewer—turn a four-week content cycle into a one-week cycle. The clinical SME hours stay roughly constant. The marketing throughput multiplies because those hours stop being consumed by coordination overhead and start being spent on actual judgment.
Reviews, E-E-A-T, and the LLM Signal Stack
Review Velocity as a Local Pack Lever
Review activity is the closest thing local search has to a real-time ranking input. Volume, recency, rating distribution, and response rate all feed the local algorithm, and they move within weeks rather than the multi-month horizon of content and links.
The patient acquisition link is direct. Roughly 86% of practices report patient growth attributable to positive online reviews, which positions review management as a primary acquisition lever rather than a reputation-management afterthought 3. A location with a steady drip of recent five-star reviews and prompt owner responses outranks a location with a higher static average but no fresh signal—the algorithm rewards activity, not historical totals.
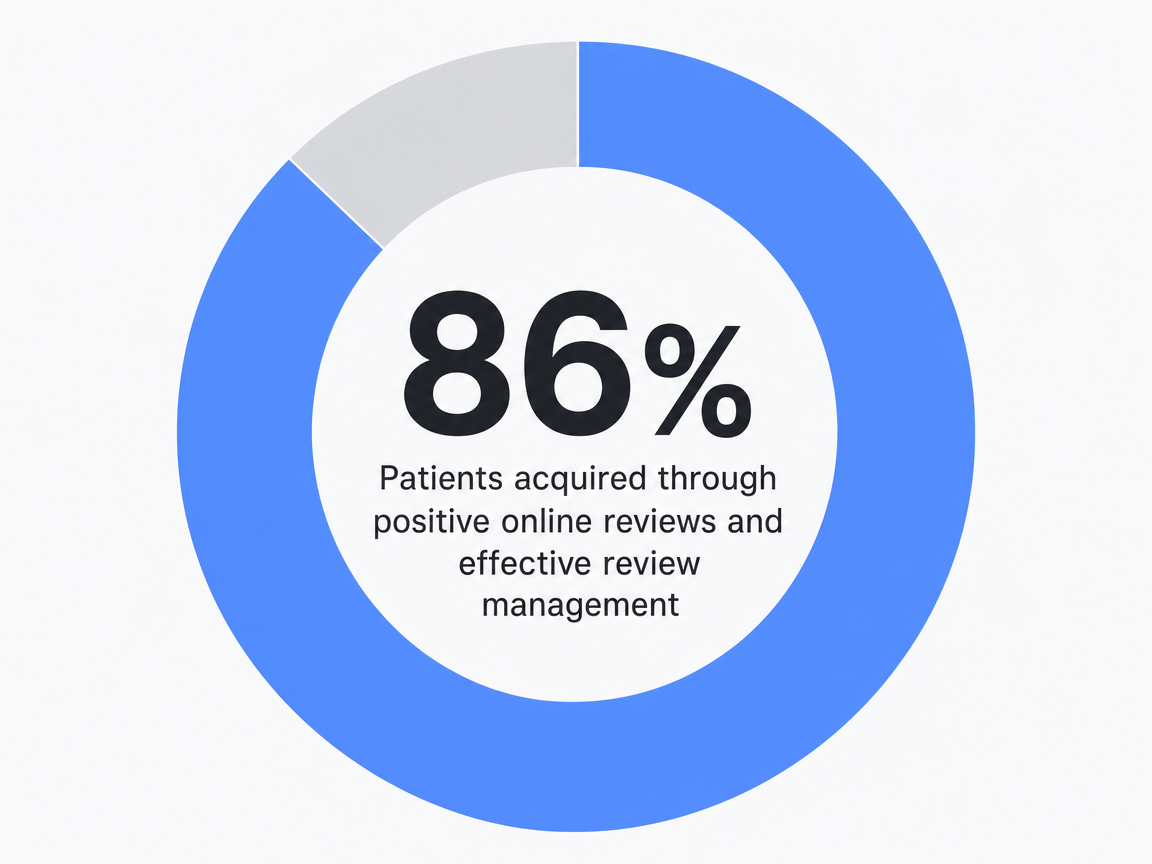 Patients acquired through positive online reviews and effective review management: 86%
The operational gap at scale is that review velocity is a per-location problem solved by an account-level system. Each site needs a request workflow tied to the appointment system, response templates that handle clinical sensitivity without crossing HIPAA lines, and escalation paths for negative reviews that route to the right operations owner. Running that as forty separate processes produces forty different velocities. Running it as one system with location-specific routing produces a uniform floor across the footprint and lets the marketing team see which locations are review-starved before the local pack rankings reflect it.
Provider Authority Signals That Carry Across Search and AI Surfaces
E-E-A-T and LLM readiness are not separate trends. They are the same signal stack viewed from two surfaces. Google's quality systems and the retrieval models behind AI search results both reward the same underlying inputs: identifiable expert authors, verifiable credentials, structured medical content, and citation patterns that connect claims to authoritative sources.
For a multi-location group, that means provider authority is the central asset. Each physician, nurse practitioner, and PA on the roster needs a structured presence that includes credentials, board certifications, residency and fellowship history, conditions treated, procedures performed, publications when they exist, and clear schema markup tying the person to the location and to the organization. Those entities feed the knowledge graphs that both classical search and LLM retrieval depend on. A location page with three named providers, each with a defensible authority footprint, ranks differently than the same page with anonymous staff.
The production discipline is consistency. Provider names, credentials, and biographical claims have to match across the website, GBP profiles, healthcare directories, state licensing boards, and any third-party publications. Drift across those surfaces creates entity ambiguity that suppresses confidence in both ranking systems and AI summarization. Telemedicine and cross-state service lines compound the problem because licensure and jurisdiction signals have to align with where the provider actually delivers care 4. Treating provider profiles as structured data products—owned centrally, syndicated outward, refreshed on a clock—is what turns a roster into ranking equity that compounds across both search and AI surfaces.
Allocating Budget Against PAC Variance, Not Location Count
The default budget model in multi-location healthcare is per-site equality. Forty locations, forty equal slices of the content and link budget, with minor adjustments for size. The model is administratively clean and economically wrong.
PAC does not distribute evenly. The 2.7x spread between dense urban acquisition costs and rural acquisition costs means that a dollar of organic investment buys very different volumes of patients depending on where it lands. Urban markets carry higher competitive density but also higher search volume and shorter conversion paths; rural markets carry thinner competition but smaller addressable populations and longer trust-building cycles. Splitting budget by location count ignores both ends of that distribution.
Allocation against PAC variance starts from the unit economics of each market. Locations where the local LTV:PAC ratio sits comfortably above the 3:1 benchmark earn investment to defend and expand share. Locations sitting below the benchmark get diagnosed first—is the gap a content problem, a review velocity problem, a referral mix problem, or a market that simply cannot support the current cost structure? Pouring more SEO spend into a sub-3:1 market without fixing the underlying economics extends the loss rather than closing it.
Three allocation tiers tend to emerge in practice. Anchor markets with strong economics and competitive headroom receive deep service-line content investment and active link acquisition. Maintenance markets receive enough production to hold local pack visibility and review velocity without overbuilding. Diagnostic markets get a short window of targeted spend to test whether better signals can shift the PAC curve before the location is reclassified. The output is a portfolio that compounds rather than a footprint that averages.
Unlock Scalable SEO Success for Multi-Location Medical Practices
Discover how top healthcare operators and agencies streamline SEO execution, content, and backlink strategies for all locations from a unified platform. See measurable gains in patient acquisition and marketing efficiency.
Reporting That a CMO Will Actually Use
Most multi-location SEO reports get opened once and never referenced in the executive review. They show keyword rankings, organic sessions, and backlink counts—none of which a CMO can tie to a same-store visit number or a quarterly PAC target.
The reports that survive the executive cycle compress to four cuts: organic share of booked appointments by location, blended PAC by service line trended against the 3:1 LTV benchmark, local pack visibility for the top three revenue-driving query sets per market, and content production throughput measured in published-and-indexed pages per week against medical review capacity 5. Everything else belongs in a working dashboard, not a board deck.
The diagnostic value sits in the location-level cuts under those headlines. A drop in blended PAC that masks two anchor markets compensating for eight diagnostic markets is not progress—it is a portfolio quietly hollowing out. Reporting that exposes the variance, names the underperforming locations, and ties each one to a specific signal gap is what turns SEO from a reporting line into a decision the CMO actually makes against the next quarter's allocation.
What This Looks Like in 2026 Operations
The healthcare marketing organizations pulling ahead in 2026 share a structural pattern, not a tactical one. They run a single account-level plan against the full footprint, route content through one production pipeline with a tiered medical review queue, manage NAP and GBP from a single source of truth, and report against PAC variance and the 3:1 LTV benchmark rather than keyword counts.
The shift is from tactics to infrastructure. AI-assisted production handles the volume work—briefs, drafts, schema, indexation checks—while human judgment concentrates where it earns its hours: clinical accuracy, allocation calls, and the diagnostic markets where the economics still need to be solved 6. The marketing leader stops managing vendors and starts managing a portfolio.
Platforms like Vectoron exist to run that operating model end to end, but the strategic point holds regardless of vendor: scaling SEO across a healthcare footprint is now an operating-system problem, and the groups that solved it stopped buying tactics by the location.
Frequently Asked Questions
References
- 1.SEO for healthcare: How to boost your medical practice's organic traffic.
- 2.The Complete Guide to Local SEO For Doctors In 2026.
- 3.Emerging trends and patterns in healthcare-seeking behavior.
- 4.Complete Guide to SEO for Telemedicine Providers.
- 5.Visualizing the Patient Journey: Using the Marketing Funnel to Attract, Retain Patients.
- 6.Multi-Location Growth: Lessons from Healthcare Organizations That Scaled Successfully.