
Key Takeaways
- Treat search as a seven-stage funnel from impressions to revenue, with each stage owned by exactly one system: Search Console, GA4, the Measurement Protocol bridge, or the CRM 1, 3.
- Stop reconciling Search Console clicks and GA4 sessions line by line. Google documents the delta as expected due to measurement, attribution, consent, and canonical differences 1.
- Attributed pipeline allocates credit across observed touches; incremental pipeline requires causal methods like geo-holdouts, difference-in-differences, or propensity matching to estimate real SEO lift 8, 10, 7.
- Portfolio scale depends on building the GA4-to-CRM join once through shared identifiers and locking definitions in a reporting appendix, so junior strategists ship defensible decks without partner rework.
Why Ranking Dashboards Lose Renewal Meetings
A ranking screenshot has never survived a serious CFO question. When a client's finance lead asks whether the SEO retainer produced qualified pipeline last quarter, position graphs and impression counts answer a different question than the one being asked. That mismatch is why renewals stall even when the underlying work is sound.
The agencies holding onto multi-year contracts have moved their reporting off the ranking layer and onto a joined funnel that ends in revenue. Google's own documentation frames the split cleanly: Search Console is the source of truth for pre-click performance, and Google Analytics is the source of truth for on-site behavior, with each system built to answer a different half of the question 1. Neither of them, on its own, tells a client whether SEO created qualified inquiries or closed business. That evidence sits in the CRM and, for most service verticals, in call-tracking data.
The rest of this piece lays out a seven-stage pipeline model, the system that owns each stage, how to defend the discrepancy between Search Console and GA4 in a QBR, and how to separate attributed pipeline from incremental pipeline using causal methods rather than dashboard math.
The Seven-Stage Pipeline Model
Impressions to Revenue as a Single Funnel
The model that survives client scrutiny treats search as one continuous funnel with seven stages:
- impressions
- clicks
- engaged sessions
- inquiries
- qualified inquiries
- opportunities
- revenue
Each stage is a filter, and each stage is owned by a different system. Reporting fails when an agency shows only the stages it can pull with a single login.
The first two stages sit inside Search Console. The Performance report exposes impressions and clicks segmented by query, page, country, and device, which is the raw material for judging pre-click opportunity and intent match 2. Engaged sessions and on-site key events sit inside GA4, which Google positions as the source of truth for behavior after the visit begins 1. Inquiries can live in either place depending on how forms fire, but qualified inquiries almost never do. In service verticals, qualification happens on a phone call, at an intake conversation, or during a consult, and that signal has to be pushed back into the analytics layer through the Measurement Protocol, which is built specifically to carry server-side and offline interactions into GA4 3. Opportunities and revenue sit in the CRM.
The discipline is joining those systems on a stable identifier, usually a session ID, click ID, or hashed contact record, so a single inquiry can be traced backward from a closed-won deal to the landing page and the query that produced the click. Agencies that skip the join end up reporting four disconnected dashboards and asking the client to do the arithmetic. That is the reporting posture the CFO remembers when the retainer comes up for review.
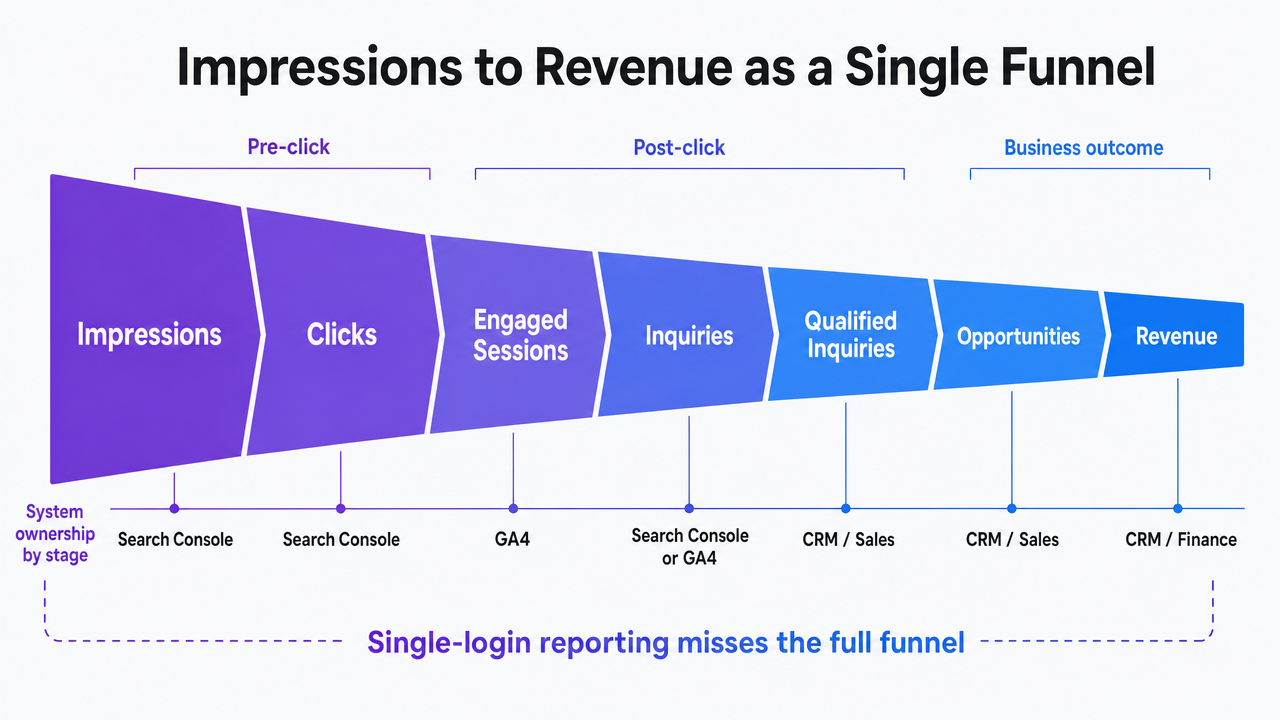 Visualize the seven-stage pipeline funnel and the system that owns each stage, directly supporting the section's core framework
Which System Owns Which Stage
Ownership needs to be assigned explicitly, in writing, before a reporting cycle begins. Ambiguity about which system reports which number is the reason two strategists produce different quarterly totals for the same client.
- Search Console owns impressions, clicks, average position, and query-to-landing-page mapping. It is the only system that sees what happened in the SERP before the user reached the site, and Google documents it as the source of truth for that layer 1, 2.
- GA4 owns engaged sessions, session-scoped traffic source, on-site key events such as form submissions and phone-tap events, and any conversion path that involves multiple pageviews before the inquiry 1.
- The Measurement Protocol owns the bridge: when a form-fill becomes a qualified inquiry after a call-center screen, or when an opportunity closes weeks later, that state change is sent back into GA4 as an event tied to the original client and session identifiers 3.
- The CRM owns opportunity stages, close dates, deal values, and any manual reclassification of lead quality.
The practical rule is that each number appears in exactly one system's report and is referenced, not restated, by the others. Impressions do not appear in the GA4 tab. Deal values do not appear in the Search Console tab. When a client asks why organic sessions grew but qualified inquiries did not, the answer lives at the join between GA4 and the CRM, and the reporting deck should route the question there instead of relitigating traffic numbers.
Reconciling Search Console and GA4 in Client QBRs
Search Console clicks and GA4 organic sessions for the same landing page over the same window will not match. This is not a tracking bug, and it is not a reason to panic in the QBR. Google documents the discrepancy directly: the two systems use different measurement methods, different attribution logic, different time zones, different canonical URL rules, different consent behavior, different bot filtering, and different traffic classifications 1. Every one of those differences produces a legitimate delta between the two totals, and a Head of SEO who cannot explain that on the spot loses control of the meeting.
The strongest QBR posture is to name the gap before the client does. State that Search Console counts a click when Google registers a user leaving the SERP for the site, while GA4 counts a session when its tag fires in a consenting browser after the page loads. A click without a session is common: the user bounces before the tag fires, blocks the tag, declines consent, or lands on a canonical variant Search Console attributes differently than GA4 1. A session without a click is also possible when GA4 classifies a visit as organic that Search Console never registered, often due to referrer stripping or cross-day time-zone edges.
The practical rule is to report each metric from its owning system and stop trying to force reconciliation. Impressions, clicks, average position, and query-level data come from Search Console. Sessions, engaged sessions, and on-site key events come from GA4. When a client asks why the two numbers differ by fifteen or twenty percent, the answer is the documented list above, not a defensive audit. For clients who require deeper reconciliation, Google's own recommendation is to combine Search Console bulk exports with GA4 exports in BigQuery, where landing-page-level joins narrow the gap and expose the specific rows driving it 1. That is a delivery investment worth making for enterprise accounts and overkill for smaller retainers.
One discipline keeps the discrepancy from becoming a recurring argument: lock the definitions in the reporting appendix at contract kickoff. Document which metric comes from which system, the time zone each report uses, the consent model in place, and the canonical rules the site enforces. When the delta shifts quarter over quarter, the conversation moves from "why don't these match" to "which of the documented drivers changed," which is a diagnostic question rather than a credibility question.
Connect SEO performance directly to sales pipeline
Validate how SEO metrics translate into measurable pipeline value with real client data, risk-free.
Pulling Offline Qualification Into the Funnel
In service verticals, the moment a lead becomes real is almost never a form submission. It is a phone call answered by an intake coordinator, a consultation booked after a callback, or a case screened by a paralegal three days later. If none of that state change flows back into GA4, the analytics layer stops at inquiries and the CRM starts at opportunities, and the two never meet on the same page or the same query.
The Measurement Protocol closes that gap. Google built it specifically to send server-to-server and offline interactions into GA4 and to tie online and offline behavior together on shared identifiers 3. The practical workflow is straightforward: capture a GA4 client ID or session ID on the initial form or call-tracking event, store it against the contact record in the CRM or intake system, and fire an event back to GA4 when the record advances to qualified, opportunity, or closed-won. Each stage change carries the original identifier, which means the qualified inquiry inherits the landing page, source, medium, and campaign that GA4 already recorded for the first visit.
Three failure modes wreck this in delivery:
- Identifier drift, when the client ID is lost between the web session and the call log, produces orphan events that GA4 attributes to direct or unassigned.
- Timestamp mismatches from time-zone differences between the CRM and GA4 push qualification events into the wrong reporting window.
- Consent gaps, where the initial visit declined tracking, mean the qualified event has no session to attach to and should not be forced in 3.
Each of these is fixable, but only if the reporting appendix names the identifier, the timestamp convention, and the consent rule before implementation begins.
Once offline events are flowing, the funnel finally reports what the client cares about: qualified inquiries and closed business tied back to the specific queries and landing pages that produced them. That is the join Search Console and standard GA4 collection cannot make on their own, and it is the join that turns a traffic report into a pipeline report.
Attributed Pipeline Is Not Incremental Pipeline
What Attribution Models Actually Do
Attribution models allocate credit. They do not measure lift. That distinction is the one most SEO reports blur, and it is the one that collapses under a sharp CFO question.
A last-click model assigns the entire inquiry to the final touch. A multi-touch model spreads credit across the touches it can see, weighted by position, time decay, or a data-driven algorithm. Both approaches answer the same underlying question: given the touchpoints observed on the path to conversion, how should the fixed pool of credit be divided among them. The academic framing is explicit that attribution allocates credit across online and offline touchpoints while accounting for carryover effects within channels and spillover effects across them 8. Nothing in that process establishes what would have happened if the SEO channel had not been active.
That gap matters most in service verticals with long consideration windows. A prospect reads three organic articles over six weeks, receives a referral, calls the practice directly, and closes as a five-figure deal. Every attribution model on the market will hand some share of that revenue to organic search. None of them can say whether the same prospect would have called anyway after the referral. The attributed pipeline number is real and reportable; the incremental pipeline number, the revenue that would not have existed without the SEO investment, is a different quantity that requires a different method to estimate 10. Reporting the first as if it were the second is how retainers get defended in one quarter and cut in the next.
Causal Methods for SEO Lift
Estimating incremental pipeline requires a method built to identify causation rather than correlation. Four are practical for agency delivery, each with a different assumption and a different implementation cost.
Randomized trials are the reference standard. Random assignment makes treated and untreated groups comparable in expectation, which is why the resulting difference can be read as causal impact 7. For SEO, clean randomization is rarely available because rankings, demand, and content exposure cannot be controlled at the user level. The method is worth naming because it defines what the other three are approximating.
Geo-tests are the most agency-friendly approximation. A set of metropolitan areas or service regions receives an SEO intervention, typically a content expansion or a local-page rollout, while a matched set is held out. Aggregate pipeline in the treated regions is compared against the control over the test window. The assumption is that the two geographies would have tracked together absent the intervention, which is defensible when pre-period trends are parallel and demand shocks are shared 10. Multi-location clients with regional CRMs are the natural fit.
Difference-in-differences applies when a treatment is introduced at a specific point in time on some units and not others. The pre-post change in the treated group is compared against the pre-post change in the control, and the difference of those differences is the estimated lift 7. It handles secular trends and seasonality better than a simple pre-post read, which is why it survives the seasonality objection clients raise in every QBR.
Propensity matching pairs treated pages, keywords, or accounts with untreated ones that share observable characteristics such as historical traffic, intent class, and competitive density. The paired comparison estimates lift attributable to the intervention 10. The assumption is that matching on observables removes selection bias, which is weaker than random assignment but stronger than a naive year-over-year comparison.
The method chosen determines what an agency can claim. A geo-holdout on a home-services client with twenty markets produces a defensible incremental-revenue figure. A propensity-matched page comparison on a single-location law firm produces a directional lift estimate with named assumptions. Correlation dressed up as causation produces neither.
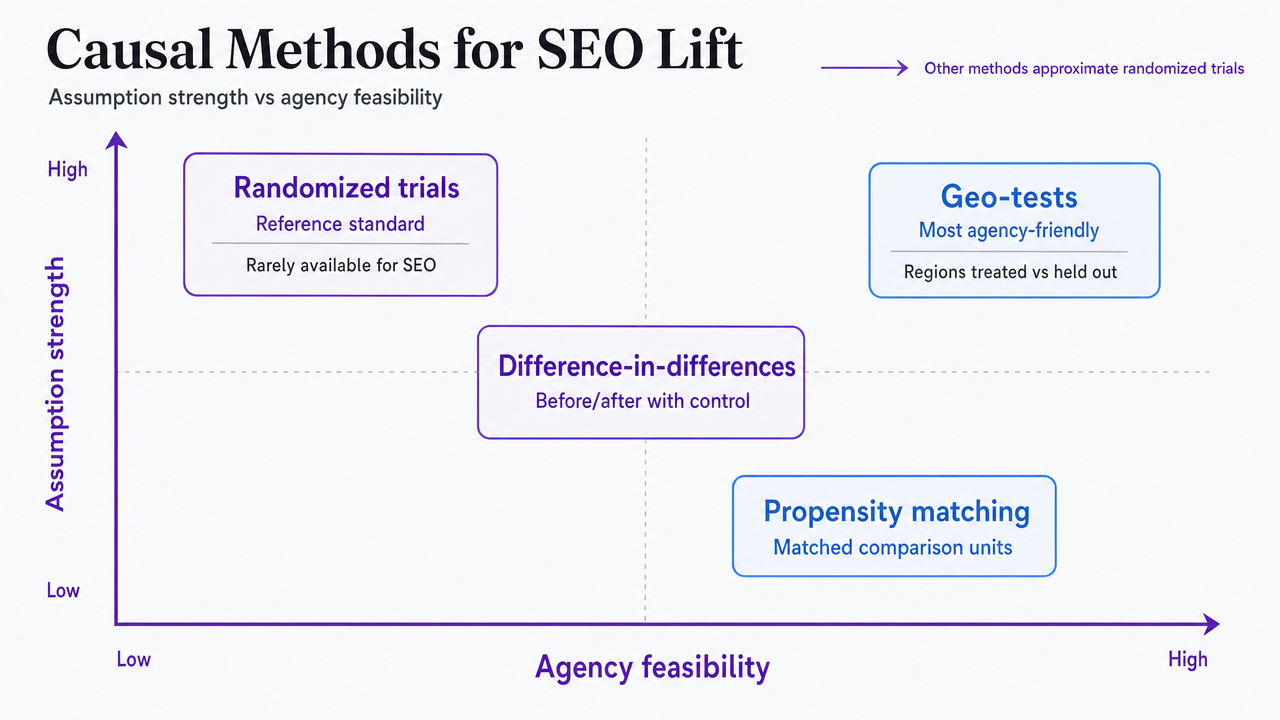 Compare the four causal methods discussed in the section (randomized trials, geo-tests, difference-in-differences, propensity matching) across their assumption strength and agency feasibility
Content Quality as a Pipeline Guardrail
Publishing volume is easy to buy. Pipeline durability is not. When an agency scales production across a client book without a quality bar, ranking gains show up first and qualified inquiries fail to follow, which is the exact pattern that ends retainers a quarter after they were renewed. Google's spam guidance names the failure mode directly: producing pages at scale primarily to manipulate rankings, including AI-assisted output that lacks added value, constitutes scaled content abuse and is treated as a policy violation 4. The rule is not that AI-assisted content is disallowed; it is that content without originality, accuracy, or user value is disallowed regardless of how it was produced.
The pipeline consequence is measurable at the funnel joins built earlier in this piece. Thin pages can win impressions and even clicks, but engaged sessions, inquiries, and qualified inquiries do not scale in step. Google's people-first guidance frames the diagnostic: helpful, reliable content built for users is what its ranking systems are designed to reward, and pages that satisfy search demand without satisfying the user tend to lose position on subsequent updates 5. A quality guardrail belongs in the reporting model itself. Track qualified-inquiry rate per landing page cohort, and cut production templates where the rate stays flat as traffic climbs.
See How Top Agencies Link SEO Metrics Directly to Client Revenue
Request a walkthrough of AI-driven workflows that map keyword rankings, call intelligence, and pipeline movement—enabling your team to justify SEO investment with concrete, client-facing data.
AI Search Visibility as a Leading Indicator
Generative answers change what a visibility metric measures. When a query resolves inside an AI Overview or a chatbot response, a source can be cited, quoted, or paraphrased without producing a click, which means Search Console impressions and clicks no longer capture the full surface area of a brand's presence in search. A recent research framework proposes metrics built for that surface:
- citation prominence
- attribution accuracy
- semantic contribution
- coverage of key information points
- answer dominance 9
Each measures a different facet of how a source shows up inside a generated answer, and none of them yet maps cleanly to qualified inquiries or revenue.
Google's own framing on the click side is more optimistic than most third-party reads. Its August 2025 post reports that total organic click volume to websites has been relatively stable year over year and that AI Overviews are sending slightly more quality clicks, defined as visits where users do not quickly return to search 6. That is a platform-level statement covering aggregate web traffic, not a guarantee for any specific vertical, local-service market, or client. Reporting it as a client-level benchmark misrepresents its scope.
The operational posture for agency delivery is to track AI-search visibility as a leading indicator, reported separately from the pipeline funnel and labeled as such. Citation prominence and answer dominance belong in a distinct tab in the QBR deck, not summed with clicks or inquiries. Revisit the connection quarterly as measurement matures.
Scaling the Model Across a Client Book
Standardizing Reporting So Juniors Ship Defensible Decks
The funnel model breaks the moment it depends on a senior strategist rebuilding it by hand for every client. Standardization is the only way it survives across a book of thirty or eighty accounts, and it starts with a template that names each stage, the system that owns it, the metric definition, the citation the strategist can quote if challenged, and the acceptable range for the delta between Search Console and GA4 1. Junior strategists do not need to defend the discrepancy from first principles; they need a documented answer keyed to the same reference the client can look up.
Three artifacts do most of the work:
- A reporting appendix, written once and cloned per client, locks metric definitions, time zones, consent models, canonical rules, and the identifier used to join GA4 to the CRM through the Measurement Protocol 3.
- A QBR deck template routes each recurring question to the owning system: impressions and query mix from Search Console 2, engaged sessions and key events from GA4, qualified inquiries and closed-won from the CRM tab.
- A quality checklist audits landing-page cohorts against qualified-inquiry rate, flagging templates where traffic climbs but qualification does not, which is the guardrail Google's people-first guidance calls for 5.
When the framework is in the artifacts rather than in a senior head, juniors ship defensible decks without partner review on every cycle.
If You Manage a Portfolio: Fragmented vs Unified Reporting Economics
This section is written for agency leaders running SEO delivery across a portfolio rather than a single account, where reporting hours compound quickly and the cost of a fragmented stack shows up in analyst utilization rather than in any one client invoice.
The economics turn on how many manual pulls and reconciliations a strategist performs per client, per reporting cycle. Under a fragmented model, each account requires a Search Console export, a GA4 export, a CRM export, a call-tracking export, and a manual reconciliation pass to resolve the documented gaps between systems 1. Under a unified model, the join is built once through the Measurement Protocol and a shared identifier, and the strategist reviews exceptions rather than rebuilding the funnel 3.
The table below uses variables, not invented dollar figures, so agency leads can drop their own inputs in.
| Delivery variable | Fragmented reporting | Unified funnel reporting ||---|---|---|| Data pulls per client per cycle | 4 to 5 manual exports | 1 automated pipeline, exceptions only || Reconciliation hours per client per month | H_frag (typically the largest line) | H_unified (review time only) || Clients per analyst | C_frag | C_unified, materially higher || Reporting cycles supported per quarter | Limited by manual capacity | Limited by client cadence, not tooling || Failure mode at scale | Silent metric drift across decks | Exception queue with named owners |
The operational takeaway is that portfolio scale is a data-architecture decision, not a hiring decision. Agencies that build the join once absorb new accounts without linearly adding analyst hours; agencies that do not, hire until margin disappears.
Frequently Asked Questions
References
- 1.Using Search Console and Google Analytics data for SEO.
- 2.Search Console: Getting started.
- 3.Measurement Protocol (Google Analytics 4).
- 4.Spam Policies for Google Web Search.
- 5.Creating Helpful, Reliable, People-First Content.
- 6.AI in Search: Driving more queries and higher quality clicks.
- 7.Causal Inference in Economics and Marketing.
- 8.The path to purchase and attribution modeling.
- 9.Driving Generative Search Engine Optimization with ....
- 10.Optimizing Marketing Spend with Causal Attribution: Moving Beyond Correlation to Incremental Impact.