
Key Takeaways
- A defensible rank report functions as a decision document structured in three layers: visibility across classic and AI surfaces, behavior and conversion linkage, and a prioritized action queue tied to revenue.
- Pairing Search Console query data with GA4 landing-page behavior is the join that answers whether ranking movement actually earned conversions, and Google's SEO Starter Guide instructs teams to use both together 5.
- Average position charts, third-party tracker screenshots without conversion context, and 'keywords in top 10' vanity counts belong in the archive because AI Overview impressions are now folded into Performance totals 1.
- At portfolio scale, standardize the report as a five-block schema so strategist judgment concentrates on the action queue, and match time granularity to audience — weekly for clients, recent data for internal monitoring 8.
The rank report is now a decision document, not a position list
The average position column has stopped carrying the report. Between AI Overviews absorbing informational queries, zero-click SERPs eating branded impressions, and Search Console now logging AI Overview and AI Mode appearances inside the Performance report, a keyword-position list no longer explains what happened to a client's organic revenue last month 1. It explains one variable in a system with at least three.
The reports that survive client scrutiny in 2026 are built as decision documents. They answer three questions in sequence: where did visibility move across classic and AI surfaces, how did that visibility translate into behavior and conversions on the site, and what work is queued next because of it. Google's own documentation now points to this architecture — the guidance to pair Search Console with Analytics to understand both discovery and on-site experience is explicit in the current SEO starter guide 5, and the newer Search Console Insights view leans into narrative summaries of clicks, impressions, and trending pages rather than static rank tables 7.
For an agency Head of SEO, the shift is commercial before it is technical. Renewal conversations are no longer won by demonstrating that fourteen keywords moved from position 8 to position 5. They are won by showing which query clusters gained AI Overview impressions, which landing pages converted the resulting sessions, and what the strategist is prioritizing next quarter as a result. A position list describes weather. A decision document describes what the client is going to do about it, and what the last set of decisions earned. The rest of this piece lays out the three layers that structure that document, the caveats that make it defensible, and the template mechanics that let one strategist run it across a portfolio.
The three layers a modern rank report must carry
Layer one: visibility across classic SERPs and AI surfaces
Visibility in 2026 is not a single number. A defensible report tracks two adjacent surfaces in parallel: the classic Performance report and the Search Generative AI performance report, both now native to Search Console.
The classic Performance report continues to carry clicks, impressions, CTR, and average position, broken down by query, page, country, and device, with trend lines across the selected period 10. That data still anchors the report — it is the closest thing to a source of truth for query-level discovery on standard search results. What changed is that AI Overviews and AI Mode appearances are now counted and logged inside the same Performance totals, so an impression spike is no longer automatically a classic-SERP event 1. A rank report that does not name which surface produced a movement loses interpretive value the moment a client asks why clicks fell while impressions rose.
The Search Generative AI performance report adds the second surface. It breaks down how often URLs appear in generative AI features across Search and Discover, with dimensions for impressions, pages, countries, devices, and dates, and it supports hourly, daily, weekly, and monthly granularity 6. Placed next to the classic Performance report, the two reports form a complete visibility panel: one row of dimensions for standard results, a parallel row for AI surfaces, and a shared time axis.
The practical construction of Layer One is a side-by-side table in the report, not two separate exhibits. Left column: classic Performance dimensions — clicks, impressions, CTR, average position, broken down by query and page 10. Right column: Search Generative AI dimensions — impressions, pages, devices, countries, dates 6. A strategist scanning this panel across a client roster can identify within seconds which accounts gained AI-surface impressions, which lost classic clicks, and where the two moved in opposite directions. That divergence is often the most important signal in the report, and it disappears entirely when visibility is reduced to a single average-position number.
Layer two: behavior and conversion linkage through GSC and GA4
Visibility explains what appeared in front of users. It does not explain what those users did next. Layer two is the join between Search Console query data and GA4 behavioral data, and it is the layer that most legacy rank reports skip entirely.
The division of labor is clean. Search Console reports how users found the site — impressions, clicks, and position at the query level. GA4 reports what users did after arrival — sessions, engagement, conversions, and landing page performance. Using both together produces a more complete picture of SEO performance than either tool alone 3. The pairing thesis is not an agency opinion; it is how Google's own SEO Starter Guide instructs teams to measure success 5.
Operationally, the linkage sits in the landing pages report. GA4's traffic acquisition and landing pages reports let a strategist connect organic sessions to conversions and downstream engagement, once Search Console is linked to the GA4 property 2. The report should carry a landing-pages table showing, for each URL that gained or lost visibility in Layer One, the corresponding change in organic sessions, engagement, and conversions. That table is the answer to the question every client asks: did the ranking movement actually earn anything.
Two failure modes are worth naming:
- The first is reporting GA4 conversions without the GSC query context that produced them — the client sees revenue but not the intent shift behind it.
- The second is reporting GSC query movements without the GA4 conversion column — the client sees rank gains that may or may not have earned a lead.
A rank report that carries only one side of the pairing is answering half of the client's question.
The visible artifact for Layer Two is a two-column reference the strategist can use in every review meeting: what GSC tells you (query-level discovery, impressions, clicks, position) versus what GA4 tells you (post-click behavior, engagement, conversions, landing page performance) 3. That artifact doubles as a teaching tool when a client's internal team asks why the report pulls from two platforms instead of one.
Layer three: a prioritized action queue tied to revenue
The first two layers describe what happened. Layer three is where the report earns its renewal. It is a ranked list of the next set of moves the strategist is proposing, each tied to a specific movement in Layer One or Layer Two and each attached to an expected revenue or lead impact.
The action queue has three columns and a footer. Column one names the observation — a query cluster that gained AI Overview impressions but lost clicks, a landing page whose engagement collapsed after a template change, a country breakdown where impressions doubled without corresponding conversions 6, 2. Column two names the proposed work — a rewrite, an internal linking pass, a schema addition, a page speed intervention. Column three names the expected outcome in the client's own units: qualified leads, booked calls, revenue, or, when those are not instrumented, the GA4 conversion event the work is meant to move 2. The footer names what shipped since the last report and what it earned, closing the loop from the prior queue.
The discipline this layer imposes is that no observation makes the report unless a corresponding action or explicit decision-to-hold is attached. A visibility movement without a proposed response is noise. A proposed response without a linked observation is unjustified work. The queue is ordered by expected impact, not by ease of execution, so the client sees the strategist's judgment on priority — which is what the client is paying for.
Layer three is also what makes the report defensible in a QBR. When a client asks why last quarter's traffic did not translate to pipeline, the queue documents which actions were prioritized, which were deferred, and which were completed with what result. The rank report becomes a running record of decisions, not a monthly snapshot that disappears the moment it is delivered.
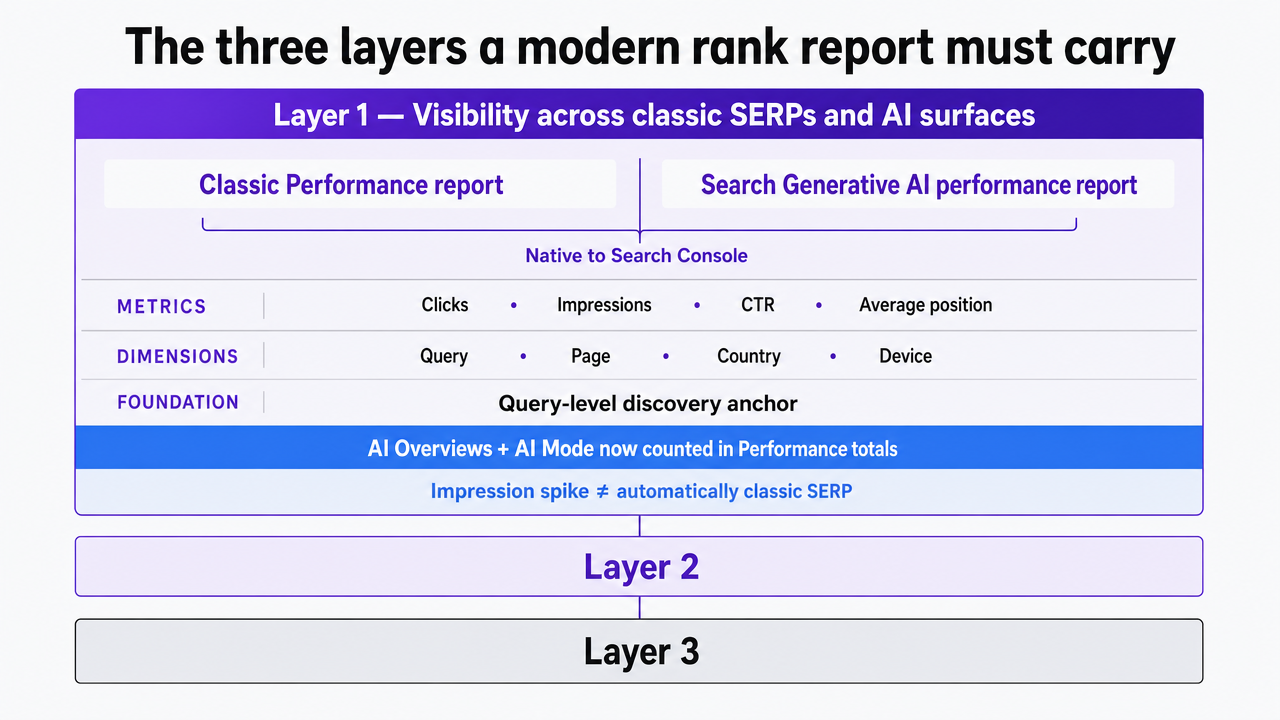 Visualize the three-layer framework the article defines as the core structure of a modern rank report, since this section explicitly walks through Layer 1, Layer 2, and Layer 3 as an operating model
Time windows: reconciling recent-data volatility with weekly and monthly trends
Granularity is a reporting decision, not a data decision. Search Console now supports four time windows in the Performance report chart — hourly and daily through the recent data view, and weekly and monthly through the granularity selector added to Search results, Google News, and Discover 8, 9. Each window tells a different story about the same query set, and the wrong window sends the wrong signal to the reader on the other side of the report.
The recent data view shows clicks, impressions, CTR, and average position broken down by query, page, and country with minimal delay 8. That resolution is useful to the strategist who needs to catch an algorithm update or a tracking regression the day it happens. It is almost never useful in a client-facing monthly report. Daily lines on a thirty-day chart amplify noise the client cannot act on and invite questions about single-day dips that reverse within seventy-two hours.
Weekly and monthly aggregation compress that noise into trend 9. A weekly view smooths day-of-week seasonality — Monday query volume against Saturday query volume stops distorting the line — and surfaces the multi-week direction that ties to content, technical, and link work already in flight. Monthly aggregation is the right default for QBRs and executive summaries, where the reader is deciding whether to renew, not whether to intervene this afternoon.
The practical rule for a 2026 rank report is to match granularity to the audience receiving it. Strategist-facing internal views run on daily and recent data so volatility is caught early. Client-facing monthly reports run on weekly aggregation as the primary chart, with monthly overlays for quarter-over-quarter framing. When a movement in the weekly view demands a shorter-window drill-down, the report includes the daily chart for that specific query cluster and names why it is there — usually an algorithm update, a technical fix, or a competitor change. The daily view earns its place in the report by answering a question the weekly view raised, not by appearing as the default.
The corollary is that a report showing only daily data is a monitoring tool, not a strategy document, and a report showing only monthly data hides the volatility a strategist needs to explain. Both windows belong in the artifact, in that order, with the audience for each explicitly named.
Test data-rich SEO reporting workflows instantly
Experience hands-on with live client ranking data and actionable reporting before making any commitment.
What to remove from the legacy rank report
Three artifacts belong in the archive, not in the 2026 report. Each of them once carried real signal. Each of them now competes with more accurate data sitting one tab over.
The first is the average position chart as the hero metric. Average position is aggregated across every impression a URL received for a query, blended across devices, countries, and result types — including AI Overviews and AI Mode appearances that are now folded into Performance totals 1. A single line on a monthly chart hides the fact that a query moved from position 4 on desktop in one country to position 12 on mobile in another. It also invites the client to fixate on a number that Google itself treats as one dimension among clicks, impressions, and CTR, not the summary metric 10. Keep average position in the data table. Stop making it the headline.
The second is the third-party rank tracker screenshot presented without conversion context. Screenshots of position tables from external trackers describe a simulated SERP, not the impressions and clicks the client's property actually received, and they rarely reconcile with GSC because GSC aggregates by property and applies privacy-driven approximations to its own data 4. When a client asks why the tracker shows position 3 and GSC shows position 6, the report needs the caveat language, not another screenshot.
The third is the "keywords in top 10" vanity count. A count with no linked landing page, no conversion column, and no AI-surface breakdown is a scoreboard, not a decision input. Replace it with the Layer Three action queue.
Data caveats that make the report defensible under client scrutiny
Every 2026 rank report needs a footer that names the limits of its own data. Search Console performance data is aggregated by property, not per individual user, and some values are approximated to protect user privacy 4. That single sentence, restated in the client's own report, resolves most of the quarterly disputes that used to consume a strategist's Friday afternoon.
Three caveats belong in the footer of every report:
- First, GSC totals now fold AI Overview and AI Mode appearances into classic Performance impressions, so a period-over-period impression shift can reflect surface mix, not query demand 1.
- Second, average position is aggregated across devices, countries, and result types, which is why the number on the chart rarely matches what a client's team sees in an incognito window 10.
- Third, recent-data views trade freshness for stability — the same query can settle to a different average position once the full period consolidates 8.
Named caveats are not a hedge. They are the language a strategist reaches for when a client asks why the third-party tracker shows one number and the report shows another. A footer that quotes Google's own aggregation and privacy notes ends that conversation faster than a screenshot ever will 4.
See How Advanced Rank Reporting Drives Real SEO Impact in 2026
Request a walkthrough of actionable, AI-enhanced SEO rank reporting—built for agencies managing multiple brands at scale. Discover metrics, insights, and workflows that support efficient, data-driven decision-making without manual overhead.
If you manage a portfolio: standardizing the report across dozens of clients
The template that lets one strategist review forty accounts
Scope shift: the rest of this piece assumed a single-account report. This section is for the strategist who has to run the same artifact across a book of thirty, fifty, or seventy-five clients on the same review cadence. At that scale, the report stops being a document and becomes a schema.
The template that survives portfolio review has five fixed blocks in the same order for every account:
- Block one is a three-line executive summary: total clicks and impressions versus prior period, one sentence naming the largest visibility movement, one sentence naming the largest conversion movement. That structure mirrors the summary logic Google itself adopted in Search Console Insights, which leads with total clicks and impressions and trending pages before drilling into queries 7.
- Block two is the Layer One visibility panel — classic Performance dimensions next to Search Generative AI dimensions, pulled on the same date window 10, 6.
- Block three is the Layer Two landing-pages table joining GSC query context to GA4 sessions, engagement, and conversions 3, 2.
- Block four is the Layer Three action queue.
- Block five is the caveats footer, identical language across every account 4.
What makes the template scalable is that every block is a query against the same two APIs and the same two dimensions — property and date range. A strategist reviewing forty accounts is not rebuilding forty reports. They are reading forty instances of the same schema and spending judgment time only on the action queue in block four, which is the block the client is paying for. The three-line executive summary in block one lets the strategist triage in seconds: accounts with flat summaries move to a quick scan, accounts with a divergence between visibility and conversions get the full review. That triage is the mechanism that turns a portfolio into a workload one person can hold.
Reporting economics: cost per account at portfolio scale
The economics of portfolio reporting are a straight multiplication problem, and most agencies have never written it down. Current monthly reporting cost equals N client accounts multiplied by H hours per manual report multiplied by the strategist's blended hourly rate. An agency running fifty accounts at four hours per report at a $110 blended rate is spending $22,000 per month producing reports before a single client conversation happens. The rate and hours are variables the reader will fill in with their own numbers; the structure is the point.
Standardizing the five-block template compresses the variable in the middle. When every account pulls from the same GSC Performance and Search Generative AI queries 10, 6, the same GA4 landing-pages configuration 2, and the same caveats footer 4, the strategist's per-account time collapses to the executive summary and the action queue. The visibility panel, the landing-pages table, and the caveats footer are populated by the schema, not by the strategist. Review time per account drops from four hours to something closer to thirty minutes, and the released capacity moves to the action queue in block four — the block the client renews on.
The comparison a Head of SEO can run internally uses three variables.
| Model | Per-account monthly cost | Portfolio monthly cost (50 accounts) |
|---|---|---|
| Manual reporting | H hours × blended rate | 50 × H × rate |
| Standardized template | (H ÷ 4) hours × blended rate | 50 × (H ÷ 4) × rate |
| Platform benchmark | $599/mo trial reference | Compared against released strategist hours |
Platforms like Vectoron exist at this seam — the question the reader is running is whether the internal template build recoups its own cost faster than a per-seat subscription. The math, not the vendor pitch, decides.
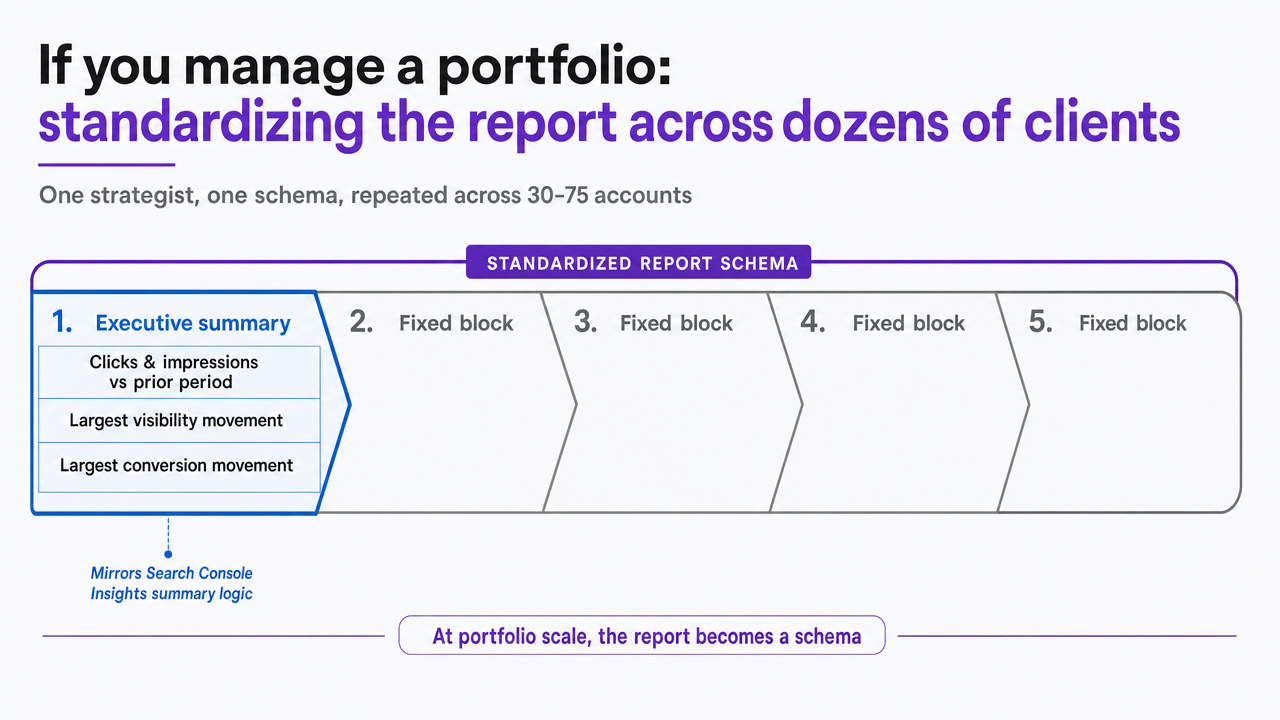 Illustrate the five-block report schema described in the section as the standardized template that lets one strategist scale across a client portfolio
The narrative report: borrowing from Search Console Insights
Google's own reporting product has moved toward story before dashboard. Search Console Insights leads with total clicks and impressions versus the prior period, then surfaces trending pages and the top queries sending users to the site, before any dimension breakdown is offered 7. That ordering is a design choice, and it is the one an agency report should copy.
A narrative rank report opens with three sentences, not three charts. Sentence one names the direction and size of the visibility change across both classic and AI surfaces 1, 6. Sentence two names the landing page or query cluster that drove most of it. Sentence three names what the strategist is doing about it next. The tables, panels, and time-series charts still sit underneath — the visibility panel, the landing-pages join, the action queue — but they exist to support the opening story, not to replace it.
The narrative frame changes who can read the report. A CMO scanning fifteen agency reports on a Monday morning does not want a dimension selector. They want to know, in one paragraph, whether their organic channel is compounding or leaking, and whether the strategist has a plan. The specialist-grade data stays on page two for the internal team that will act on it.
Frequently Asked Questions
References
- 1.Latest Google Search Documentation Updates | Google Search Central.
- 2.Top 10 SEO Reports in Google Analytics 4.
- 3.Google Search Console vs Google Analytics 4 (Explained).
- 4.Making sense of Search Console performance data.
- 5.SEO Starter Guide.
- 6.Introducing Search Generative AI performance reports in Search Console.
- 7.The new Search Console Insights report is here.
- 8.An improved way to view your recent performance data in Search Console.
- 9.Introducing weekly and monthly views in Search Console.
- 10.How To Use Search Console.