
Key Takeaways
- AgencyAnalytics functions as the QBR assembly layer, consolidating Search Console, GA4, and paid channel data into templated client reports that cut manual strategist hours.
- Semrush Position Tracking annotates rank movement against confirmed Google core updates, letting strategists separate algorithmic volatility from client-specific changes without cross-referencing external sources 2.
- Ahrefs Rank Tracker covers the full keyword universe including long-tail queries, pairing position data with backlink and content diagnostics inside one interface for portfolio investigations.
- STAT Search Analytics delivers ZIP-code, city, and device-level daily positions, matching how multi-location clients experience revenue geography and supporting more defensible contribution analysis 7.
- SE Ranking treats generative AI surfaces as a primary visibility layer, tracking AI Overview and AI-mode citations alongside classic positions as Search Console reports these impressions 3.
- Sistrix condenses domain performance into a single Visibility Index that holds up during algorithm volatility and translates cleanly into board-level trend lines for CMOs.
- Looker Studio with the Search Console BigQuery export replaces vendor reporting layers, removing the 1,000-row sampling limit and letting agencies model attribution directly 1.
Why Rank Tracking Alone Stopped Proving ROI in 2026
Search accounts for a significant portion of US digital advertising spend, leading to intense scrutiny from clients during quarterly reviews 14. This scrutiny has reshaped the requirements for agency SEO leaders regarding rank software. A screenshot showing a third-place ranking for a head term no longer satisfies a CMO's fundamental question: what was organic search's contribution to the pipeline, and how does it compare to paid channels?
Google's own documentation emphasizes this shift. Their guidance on integrating Search Console with Google Analytics positions rankings as one signal within a broader measurement framework. It explicitly identifies Search Console clicks and GA4 sessions as the most comparable metrics for correlating visibility with website behavior 1. Rank data feeds into clicks and impressions, which then inform sessions and conversions, ultimately contributing to an attribution model and the client's Quarterly Business Review (QBR). Software that only tracks positions provides an input, not a measurable outcome.
Two key changes between 2024 and 2026 further elevated these standards. Search Console introduced a 24-hour view with hourly granularity, significantly shortening the feedback loop between an SEO adjustment and observable changes in clicks and position 13. Additionally, Search Console now reports impressions, pages, countries, devices, and dates for URLs appearing in generative AI features 3. This means visibility is no longer solely tied to the traditional "ten blue links" that a rank tracker typically monitors.
The Five ROI-Proof Criteria Used to Score These Tools
Each tool below was assessed against five criteria crucial for ensuring rank data can withstand client QBRs. While keyword database size, crawl frequency, and interface quality were considered baseline expectations, the true differentiator for an ROI-proof reporting tool lies in its ability to seamlessly integrate position data with Search Console clicks, GA4 sessions and conversions, a fair attribution model for organic search, and scalable reporting workflows that minimize manual effort for strategists.
Search Console and GA4 Comparability
Effective rank software should both retrieve data from and contribute data back to the Search Console and GA4 ecosystem, which Google itself considers authoritative. Google's guidance highlights Search Console clicks and GA4 sessions as the most suitable metrics for aligning visibility with on-site user actions, while also noting that perfect alignment is impossible due to differing measurement events 1. Tools that ingest both data sources, highlight any discrepancies, and allow strategists to annotate these differences receive high marks. Tools that only report position in isolation fall short.
Attribution Model Compatibility Beyond Last-Click
The value of position data is directly tied to how an attribution model credits it. Attribution models distribute credit for a conversion across all online and offline touchpoints that influenced the customer journey, accounting for carryover and spillover effects between channels 10. Last-click attribution often undervalues organic search by ignoring the initial, top-of-funnel queries that initiate the customer path 9. Rank tools that facilitate export to platforms utilizing data-driven, position-based, or Marketing Mix Modeling (MMM)-aligned models, rather than being limited to last-click dashboards, were rated favorably.
Generative AI Visibility Reporting
The traditional "ten-blue-link" Search Engine Results Page (SERP) no longer represents the entire surface where a client can achieve visibility. Search Console now provides data on impressions, pages, countries, devices, and dates for URLs appearing within generative AI features, with granularity ranging from hourly to monthly 3. Rank software that exclusively measures classic organic positions overlooks a growing portion of impressions relevant to QBRs. Tools were evaluated on their ability to integrate this new generative AI performance data or offer a comparable visibility layer for AI surfaces.
Portfolio-Scale Reporting and Core Update Annotation
A tool that performs well for a single website can become a burden for a delivery team managing dozens of accounts. Portfolio-scale scoring prioritized features like bulk keyword grouping, cross-account rollups, and automated client reports that require strategist review rather than manual assembly. Core update annotation was equally important: Google advises waiting a full week after a core update concludes before analyzing Search Console changes 2. Rank tools that timestamp updates on position graphs enable agencies to differentiate between algorithmic volatility and client-induced changes without manual investigation.
Test SEO rank tracking workflows in real time
Measure actual keyword ranking shifts and client ROI using your own live campaigns for seven days.
The Seven Tools Worth an Agency Stack Budget
This shortlist includes six commercial rank platforms and one customizable configuration. Each entry highlights the tool's role in ROI reporting, its integration with Search Console and GA4 1, and any limitations an agency lead should consider before committing to an annual contract.
AgencyAnalytics: The QBR Assembly Layer
AgencyAnalytics is primarily valued as the reporting connective tissue that overlays rank data, rather than as a standalone rank engine. While its position tracking is competent, its strength for portfolio managers lies in its automated client report layer. This feature consolidates Search Console clicks and impressions, GA4 sessions and conversions, Google Business Profile data, and paid channel metrics into a templated deliverable, aligning with Google's recommended workflow for reconciling visibility with on-site behavior 1.
For agencies managing numerous accounts, the key metric is the time spent per QBR. A strategist who previously spent hours building slide decks can now review a pre-populated dashboard and add commentary. The platform's white-label domain, scheduled PDF exports, and per-client user roles significantly reduce the manual assembly work that inflates delivery costs per account.
A limitation is its analytical depth. AgencyAnalytics does not operate its own SERP crawler at the scale of dedicated rank platforms, and its attribution logic inherits the settings of the connected GA4 property. Agencies requiring daily desktop and mobile position tracking across thousands of keywords per client typically pair AgencyAnalytics with a more robust rank engine, using it as the presentation layer.
Semrush Position Tracking: Core Update Context at Scale
Semrush Position Tracking earns its place due to its specific capability: annotating rank movement against Google's confirmed algorithm updates. Google's guidance on core updates explicitly states that analysts should wait at least a full week after an update concludes before drawing conclusions from Search Console data, and that top pages and queries should be compared across matched time windows 2. Semrush timestamps confirmed updates directly on the position graph, allowing strategists to distinguish between a client's technical migration and a broader algorithmic shift without needing to consult multiple sources.
The Sensor volatility index and daily desktop and mobile tracking further support this. When a client inquires about a traffic drop, the answer can be either "a core update finished rolling out three days ago, and here's the recovery pattern across your peer set" or "the drop is site-specific, and here's what changed." This distinction is critical for delivering a defensible QBR.
The trade-off for this capability is the cost per tracked keyword at a portfolio scale, which can increase rapidly with multi-client plans.
Ahrefs Rank Tracker: Portfolio Keyword Universes
Ahrefs Rank Tracker is valued for its breadth. Its role in a portfolio stack is to manage the complete keyword universe for each client, including long-tail queries that may not appear in QBR slides but contribute significantly to the click volume reported by Search Console 1. For agency leads managing 40 accounts, its practical value lies in tracking share-of-voice trends across a competitive set, defined once and reviewed quarterly, rather than just pulling a single head term's position.
Ahrefs' backlink and content databases elevate it beyond a simple rank tracker to a diagnostic tool. If a rank cluster drops, a strategist can investigate position data, referring domain changes, and on-page shifts within the same interface, streamlining the investigation process that would otherwise involve multiple tools.
Two limitations are relevant for ROI reporting. First, position updates on standard plans are weekly, which lags the 24-hour Search Console view when a client requires immediate evidence of a change 13. Second, its client-facing reporting layer is less robust than dedicated portfolio platforms, so most agencies integrate Ahrefs data into separate deliverables rather than directing clients to the interface.
STAT Search Analytics: Market-Level Granularity
STAT Search Analytics is distinguished by its geographic and device-level precision. It tracks daily positions by ZIP code, city, and device, which is essential for clients whose revenue relies on local visibility rather than national rankings. This granularity mirrors Nielsen's argument for regional data in marketing mix modeling, where models built on regional inputs significantly outperform national-level ones 7. The same principle applies to rank data informing client contribution analysis.
For agencies with multi-location clients, STAT's tag hierarchy allows for simultaneous segmentation of the same keyword universe by location, service line, and intent stage. A strategist can quickly answer questions like "how did we rank for emergency dental in Phoenix on mobile last Thursday" with a single query. This directly aligns with how clients perceive their own revenue geography.
The trade-offs are cost and scope. STAT is priced for enterprise and mid-market use, not for individual consultants, and it does not aim to provide the comprehensive diagnostic capabilities of Ahrefs or Semrush. Most agencies deploy STAT specifically for clients where market-level position data is crucial for a location-scored performance narrative, and use a lighter tracker for national brand accounts where ZIP-level detail might introduce unnecessary complexity.
SE Ranking: Generative AI Visibility Reporting
SE Ranking is included for its treatment of generative AI surfaces as a primary visibility layer. Search Console now reports impressions, pages, countries, devices, and dates for URLs appearing in generative AI features, with varying granularity 3. SE Ranking's AI Overview and AI-mode tracking complement its classic position tracker, enabling strategists to demonstrate to clients that a URL might have lost a traditional position but gained citation frequency in generative answers for the same query cluster.
This is important for the ROI narrative because click-through behavior on generative surfaces differs from the traditional "ten-blue-link" CTR curves agencies have relied on for years. Clients whose industries are being reshaped by AI overviews require a rank platform that measures these new surfaces, rather than one that only reports declining positions on a shrinking traditional SERP.
SE Ranking's competitive analysis and white-label reporting address portfolio needs, although its keyword database is smaller than Ahrefs or Semrush. For agencies with clients focused on informational or research-intent queries heavily impacted by AI overviews, this trade-off is beneficial. For portfolios with purely transactional intent, the AI visibility layer may be less critical, and a more robust classic rank engine might be more suitable.
Sistrix: Visibility Index as a Client-Facing KPI
Sistrix is valued for its Visibility Index, a single numerical score that summarizes a domain's overall search presence across a defined keyword set. For client reporting, its value is presentational. A CMO who might disregard a table of 400 keyword positions will readily track a single trend line, which can be easily translated into board-level language in a way individual rankings cannot.
The Visibility Index also remains stable during algorithm volatility because it is calculated against a consistent keyword basket. When Google confirms a core update, an agency can demonstrate whether the client's visibility score maintained, declined, or recovered against a category benchmark, utilizing Google's recommended seven-day post-completion analysis window 2.
Sistrix is more prominent in European markets than in the US, and its historical data depth is valuable for clients seeking multi-year visibility trends. The limitation is that the Visibility Index abstracts away the granular position data that strategists use for planning work. It serves as a reporting artifact, not a diagnostic tool. Agencies adopting Sistrix typically use it alongside a daily position tracker, leveraging the index specifically as the headline number in QBRs.
Looker Studio with BigQuery: The Custom Stack Option
The seventh option is a configuration rather than a product. Google recommends the Search Console BigQuery export combined with Looker Studio as the most reliable method for analyzing search performance at scale, particularly when reconciling Search Console clicks with GA4 sessions and conversions 1. For agencies with in-house data engineers or technical partners, this stack can replace the reporting layer of all the aforementioned tools.
The benefits are amplified at a portfolio scale. Raw Search Console data resides in BigQuery without the 1,000-row sampling limit of the standard interface, GA4 conversion events can be joined at the query and page level, and a single Looker template can be applied across all client accounts with parameter adjustments. Attribution logic can be modeled directly, rather than being inherited from a vendor's default.
The primary cost is engineering time. Building the data pipeline, maintaining schemas as Google updates exports, and training strategists to use Looker represents a significant investment, and no commercial rank crawler offers this out-of-the-box. Most agencies that choose this route pair the custom stack with one of the tools above for SERP crawling, using Looker as the client-facing reporting and QBR layer.
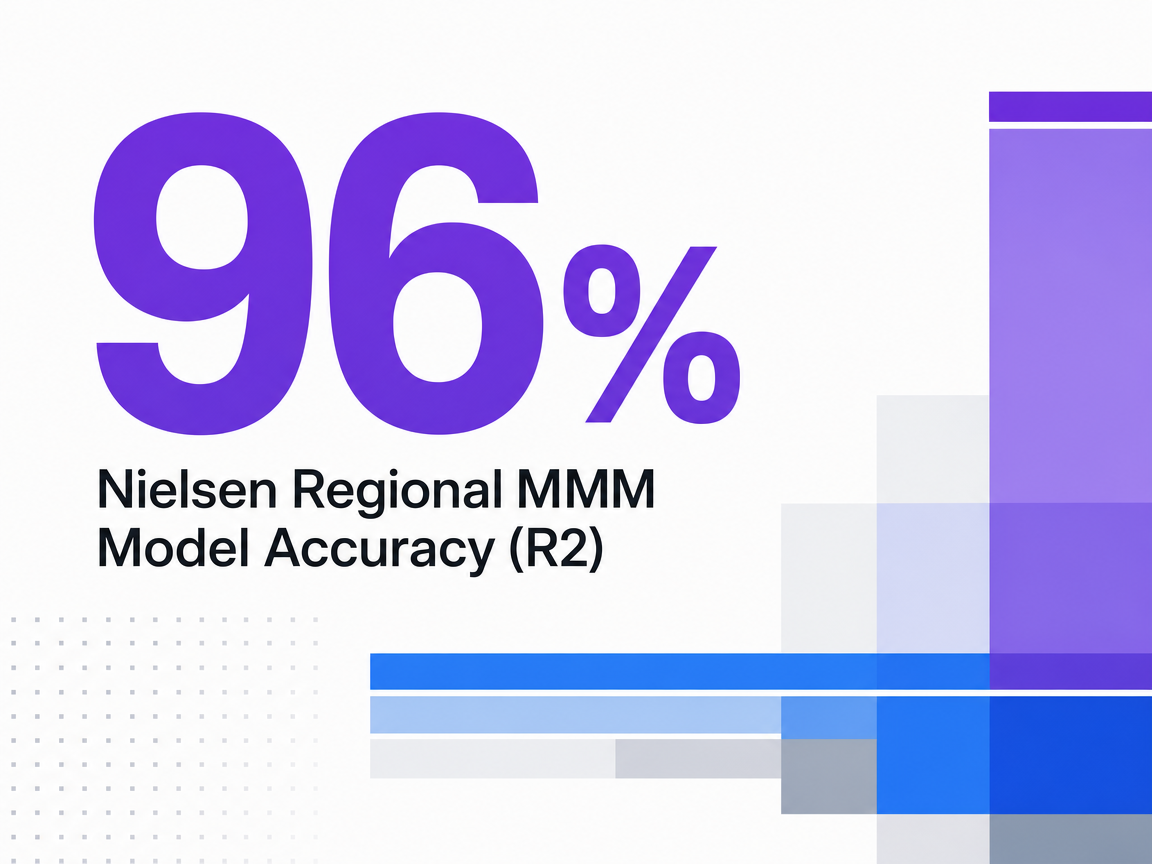 Nielsen Regional MMM Model Accuracy (R2)
Nielsen Regional MMM Model Accuracy (R2)
If You Manage 10 to 100+ Client Accounts: Portfolio Economics
The evaluation criteria shift when managing a portfolio of 10 to 100+ client accounts. Agency leads face a different equation: stack cost per client, hours spent per QBR, and the extent to which the reporting layer can be automated to preserve margins.
Three primary configurations dominate the market. A fragmented stack involves a dedicated rank crawler, a separate GA4 connector, a reporting platform, and manual QBR assembly by a strategist. A consolidated rank-plus-reporting platform integrates tracking and client deliverables into a single solution. A coordinated execution layer sits above both, routing rank-triggered recommendations through an approval workflow before publication. The variables an agency lead directly controls are seats, tracked keywords per client, and reporting hours per QBR.
| Stack Configuration | Seats | Tracked Keywords per Client | Reporting Hours per QBR |
|---|---|---|---|
| Fragmented (rank + analytics connector + reporting tool + manual QBR) | 3–4 per strategist | 500–2,000 | 6–10 |
| Consolidated rank + reporting platform | 1–2 per strategist | 500–2,000 | 2–4 |
| Coordinated execution layer with approval workflow | 1 per strategist | 500–2,000 | 1–2 |
While dollar figures are omitted as they are operator-specific, the accuracy penalty associated with aggregated data is not variable. Nielsen's benchmark across 19 marketing mix modeling studies in Japan revealed that regional-level models achieved an R² of 96% with a mean absolute percentage error (MAPE) of 4%, whereas national-level models using the same underlying data averaged an R² of 86% and a MAPE of 7% 7. This principle applies to rank data used in multi-location client contribution analysis: ZIP-code and city-level position tracking provides a significantly more defensible ROI narrative than national averages, and the platforms in the shortlist that support market-level granularity justify their higher per-account cost specifically for portfolios where such precision drives retention.
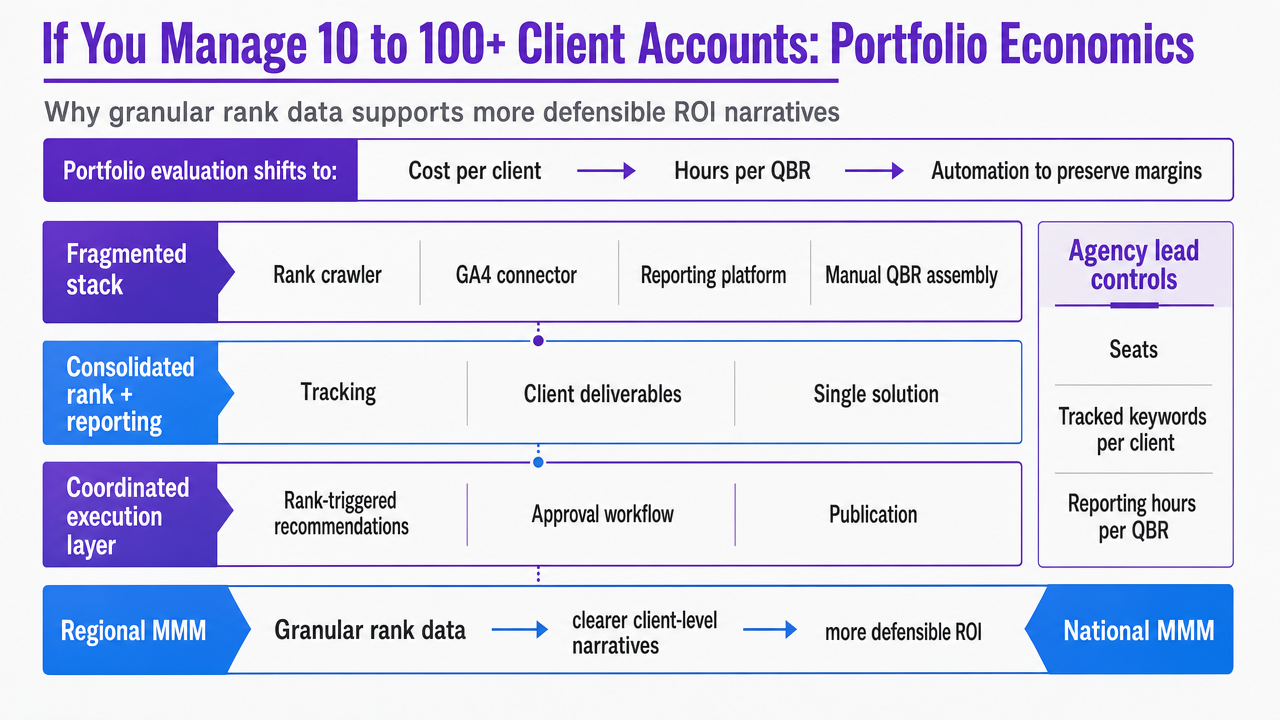 Compare Nielsen regional vs national MMM accuracy metrics cited in this section to reinforce why granular rank data supports more defensible ROI narratives
See How Leading Agencies Quantify SEO Impact at Scale
Connect with our team for a walkthrough of real-world workflows that automate rank tracking, reporting, and ROI attribution for multi-client portfolios—without adding analyst hours or manual processes.
Connecting Rank Data to Revenue in the Client QBR
Rank software provides positions, but a QBR requires revenue contribution. The link between the two is a measurement layer that translates clicks and impressions into sessions, sessions into conversions, and conversions into credited pipeline. Google's guidance frames Search Console clicks and GA4 sessions as the most comparable pair for this translation, while acknowledging that perfect reconciliation is unlikely due to differing measurement events 1. An agency lead aiming to secure organic search budget must manage this translation, rather than relying on the default attribution settings of the client's GA4 property.
Two critical decisions determine the validity of the resulting narrative. First, which attribution model credits the touchpoint influenced by the rank tool. Second, whether the same Key Performance Indicator (KPI) definitions are applied across all accounts, ensuring that a strategist reviewing 40 clients compares consistent units of contribution rather than 40 disparate reporting schemas. Both decisions precede the QBR slide and follow the position data, and it is at these points that most agency reporting quietly loses credibility.
Why Last-Click Under-Credits Organic Search
Attribution modeling distributes credit for a conversion across all online and offline channels that contributed to the customer's progression, factoring in carryover effects from previous exposures and spillover between channels 10. Last-click attribution, by design, ignores this structure. It assigns full credit to the channel that closed the session, which typically includes branded search, direct traffic, or a retargeting ad, rather than the informational query that initiated the journey weeks earlier.
The impact on organic search is quantifiable. Research by the Marketing Science Institute on attribution in the online purchase funnel found that model choice can significantly alter channel credit when carryover and spillover are considered. Organic search is among the channels whose credit changes most between last-click and multi-touch models 9. Agencies that report using data-driven, position-based, or MMM-aligned models can reclaim credit that their rank data already earned.
Building a Common KPI Currency Across Accounts
Portfolio reporting becomes challenging when each client defines conversions differently. If one account tracks form fills, another qualified calls, and a third booked appointments, a strategist reviewing all three cannot compare organic contribution without manual normalization. BCG's measurement work advocates for a common KPI currency across accounts, combined with incrementality experiments and frequent MMM refreshes, specifically to reduce the time between a measurement question and a defensible answer 8.
For rank software, this translates to a mapping layer: position and click data on one side, a standardized conversion definition on the other, and a per-client multiplier that converts the standardized event into the client's specific revenue unit. The IAB's cross-channel measurement playbook emphasizes the governance aspect, recommending a unified data strategy with defined KPIs, benchmarks, and ETL processes before dashboard creation 4.
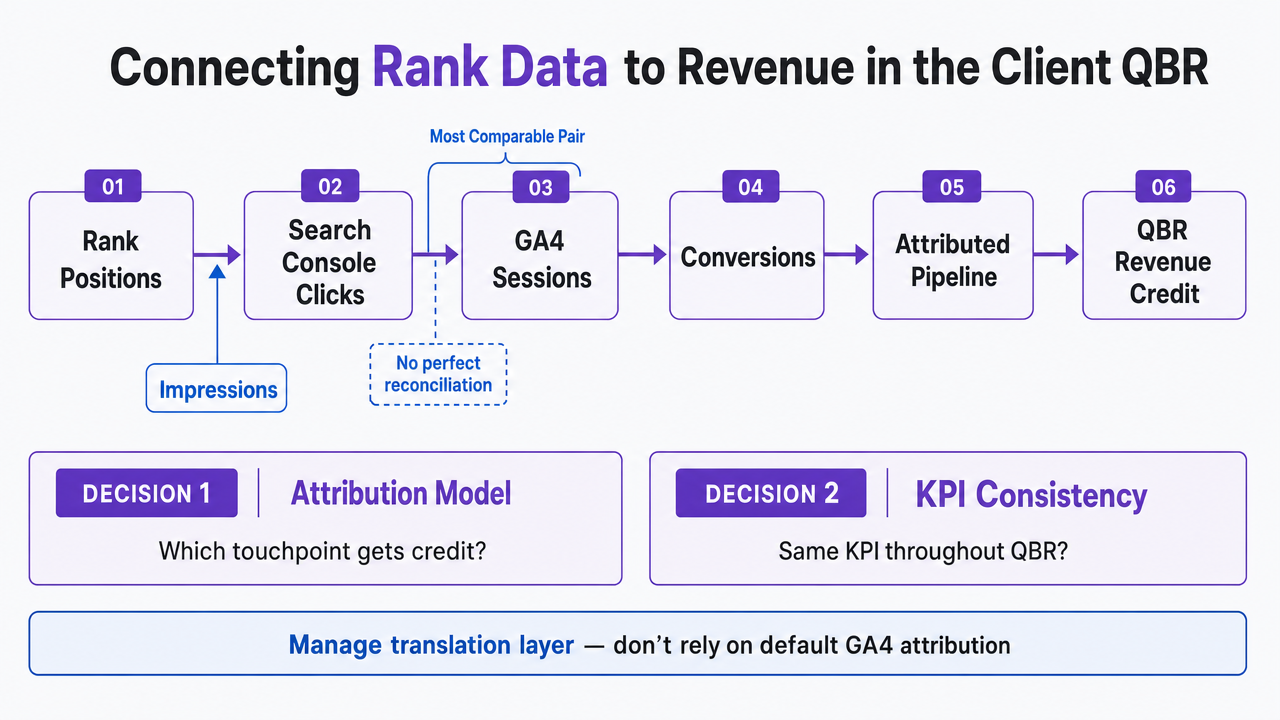 Visualize the measurement chain the section describes: rank positions flowing through Search Console clicks, GA4 sessions, conversions, attribution model, and QBR revenue credit
The Approval Workflow Layer Above Rank Data
Rank software identifies movement. However, deciding on a course of action and implementing it is where many agencies lose efficiency. A position drop for a key keyword triggers a briefing cycle: the strategist drafts a recommendation, the account manager forwards it to the client, revisions are exchanged, a writer or developer is scheduled, and by the time the fix is deployed, Search Console's 24-hour view has already updated 13. The rank tool performed its function, but the delivery process did not.
An approval workflow layer positioned above the rank stack bridges this gap. Rank-triggered signals—such as position loss in a tracked cluster, the analysis window opening after a core update 2, or a URL gaining or losing generative AI feature impressions 3—are routed into a queue of prioritized recommendations. Each recommendation includes the strategic rationale and the proposed change. The strategist reviews, approves, or edits. Execution proceeds after sign-off, and the resulting click and conversion impact is linked back through the Search Console and GA4 pairing already used for QBRs 1.
For agency leads aiming to scale delivery without increasing headcount, this represents the operational shift that the rank stack should facilitate. Vectoron is designed to serve as this crucial layer.
Frequently Asked Questions
References
- 1.Using Search Console and Google Analytics Data for SEO.
- 2.Google Search's Core Updates.
- 3.Introducing Search Generative AI performance reports in Search Console.
- 4.Implementing Cross-Channel Measurement for Marketers Playbook.
- 5.IAB/MRC Retail Media Measurement Guidelines.
- 6.Microsoft Word - MRC Digital Audience-Based Measurement ....
- 7.Marketing mix modeling best practices: Understanding why regional data delivers more accurate results than national data.
- 8.Six Steps to More Effective Marketing Measurement.
- 9.Attribution Modeling: Understanding the Influence of Channels in the Online Purchase Funnel.
- 10.The path to purchase and attribution modeling.
- 11.The new Marketing Mix Modeling - Google Search.
- 12.Forrester Analytics: Global Search Marketing Forecast, 2021 to 2026.
- 13.An improved way to view your recent performance data in Search Console.
- 14.Search Marketing Forecast, 2019 To 2024 (US).