
Key Takeaways
- Rank tools measure SERP position, impression share, and visibility — nothing downstream. Revenue lives in the CRM, and rank movement functions as a leading diagnostic rather than proof of causation.
- A defensible measurement stack has three layers: visibility (queries and clusters), attribution (sessions and conversions), and revenue (CRM stages), with cluster tags and source metadata persisting across every handoff.
- Call-driven verticals under-report pipeline without dynamic number insertion, qualified-call events, and persisted consent artifacts, since the majority of conversions never touch the form event analytics is watching 7.
- Portfolio economics turn on analyst hours per client — manual stitching caps bench capacity fast, while warehouse integration and AI-assisted analysis reallocate senior time from reconciliation to CMO-facing review.
What Rank Data Can Prove About Revenue — And What It Cannot
A rank tool measures where a client's pages appear in search results for tracked queries. That is the entire scope of what it proves. Position, share of voice, and impression-weighted visibility describe a page's competitive standing at the top of the funnel — nothing further downstream. Revenue lives in the CRM, not the rank tracker.
This distinction matters because CMOs evaluate marketing against customers, revenue, and profit, not channel-level standings 1. A deck that opens with average position for 400 tracked keywords answers a question the CMO did not ask. The same movement, reframed as impressions gained on commercial-intent queries feeding a specific set of landing pages, at least points toward the pipeline conversation — but it still does not prove revenue causation on its own.
Rank data is diagnostic. It explains why organic sessions rose or fell on a given query cluster, whether a page's visibility is expanding into new terms, and where competitors are gaining ground. It does not credit closed-won deals to a tracked keyword. Attribution credits touchpoints with revenue 2, and rank tools do not observe touchpoints, sessions, or opportunity stages. They observe SERPs.
The practical consequence for an agency delivery lead: rank data has to be handed off cleanly to analytics and CRM systems before any revenue statement is defensible. The rest of this article specifies what that handoff looks like, what it costs in analyst hours, and how to present the result without overclaiming.
The Three-Layer Measurement Stack
Visibility Layer: Queries, Pages, and Impression-Weighted Signals
The visibility layer is the rank tool's native territory. It answers three questions and only three: which queries a client's pages appear for, at what position, and with what impression volume behind that position. Everything a rank tracker exports — average position, share of voice, SERP feature ownership, keyword cannibalization flags — is a permutation of those three variables.
Query clustering is what makes this layer legible to the rest of the stack. A raw list of 4,000 tracked keywords cannot be handed to analytics or CRM in a useful form. Grouping queries into commercial-intent clusters — say, estate planning attorney [city], revocable trust cost, probate lawyer near me — creates the unit of analysis that downstream systems can reason about. A landing page inherits the cluster tag, and every session on that page can then be attributed to a visibility movement that actually preceded it.
Impression-weighted signals matter more than average position in a portfolio context. A three-position gain on a query with 40 monthly impressions is noise. The same gain on a 12,000-impression head term is a leading indicator that should trigger a look at click-through, session, and conversion data one layer down. Rank exports should carry impression volume alongside position, or the visibility layer produces vanity charts.
What the visibility layer cannot see: whether the click happened, what the visitor did on the page, or whether a form or call followed. Those events belong to the next layer.
Attribution Layer: Sessions, Conversions, and Touchpoint Credit
Once a click leaves the SERP, the rank tool loses jurisdiction. The attribution layer picks up the session, records what the visitor engaged with, and credits touchpoints against conversion events. This is where organic sessions get tied to form submissions, phone-call events, chat starts, or scheduled appointments — and where the choice of attribution model quietly decides how much credit SEO receives.
Three model families dominate the practical conversation. Single-touch attribution assigns 100% of conversion credit to one touchpoint — usually first-click or last-click — and produces clean numbers that are easy to defend and easy to mislead with. Multi-touch attribution distributes credit across the session graph, using position-based, linear, or algorithmic weighting, and captures the assisted role that organic search plays in longer buying cycles. Marketing-mix modeling steps outside the session graph entirely and estimates aggregate paid and organic contributions using time-series regression against outcome data.
No single one of these is correct. Forrester's position on the umbrella term is direct: no single approach can provide a complete view of marketing's business contribution 3. A delivery lead who picks last-click because the export is cleanest is choosing a story, not a measurement. The same reader who picks data-driven multi-touch because the vendor demo was convincing has still chosen a story — a different one, weighted by whichever sessions the model happened to observe.
The operational implication for a rank-to-pipeline handoff: session data has to carry the source metadata that attribution needs regardless of model choice. That means UTM discipline on any campaign-tagged organic destination, GA4 event definitions that match CRM conversion definitions one-for-one, and a decision — made once, documented, and applied consistently across clients — about which model runs the primary report and which models run as sensitivity checks. Attribution credits touchpoints between buyers and firms with revenue 2; the credit is only as defensible as the source metadata riding on the session.
Revenue Layer: Opportunity Stages and the B2B Revenue Waterfall
The revenue layer lives in the CRM. A conversion event that reaches this layer stops being a session outcome and becomes an opportunity record with a stage, an owner, a value, and a timestamp for every transition it undergoes. This is the layer a client CMO recognizes, and it is the only layer where the word revenue can be used without a footnote.
Forrester's B2B Revenue Waterfall provides the standardized stage language that most enterprise revenue teams already use to evaluate marketing contribution 12. Mapped against the SEO signal chain, the waterfall reads as a boundary diagram more than a funnel: impressions and clicks belong to the rank tool, engaged sessions and conversion events belong to analytics, and MQL, SQL, opportunity, and closed-won belong to the CRM. Each boundary is a handoff where metadata either persists or dies.
The waterfall reframe changes what a delivery lead is measuring. Instead of reporting organic sessions up 22% quarter-over-quarter, the report reads engaged sessions on commercial-intent clusters generated N form conversions and M call conversions, which produced X MQLs, Y SQLs, and Z opportunities at an aggregate stage-transition rate of R%. The numbers are traceable end-to-end because every object carries the cluster tag, the source metadata, and the conversion event ID all the way into the opportunity record.
Two operational rules make the revenue layer reliable. First, CRM stage definitions must be written down and reviewed with the client at the start of engagement, because a MQL definition that drifts silently across quarters destroys year-over-year comparisons. Second, the opportunity record must retain the original source metadata even after sales-team reassignment; a common CRM anti-pattern is overwriting the lead source with the last-touch salesperson's channel, which erases the SEO contribution entirely.
Forrester's framing on this is unambiguous: marketing performance must be evaluated in terms of its impact on opportunity creation and progression through the revenue waterfall, not on lead volume alone 12. For an agency, that means the renewal-review deck is a waterfall document, not a rank document — and the rank tool's job is to feed the top of that waterfall with clean, cluster-tagged visibility data that the next two layers can carry the rest of the way.
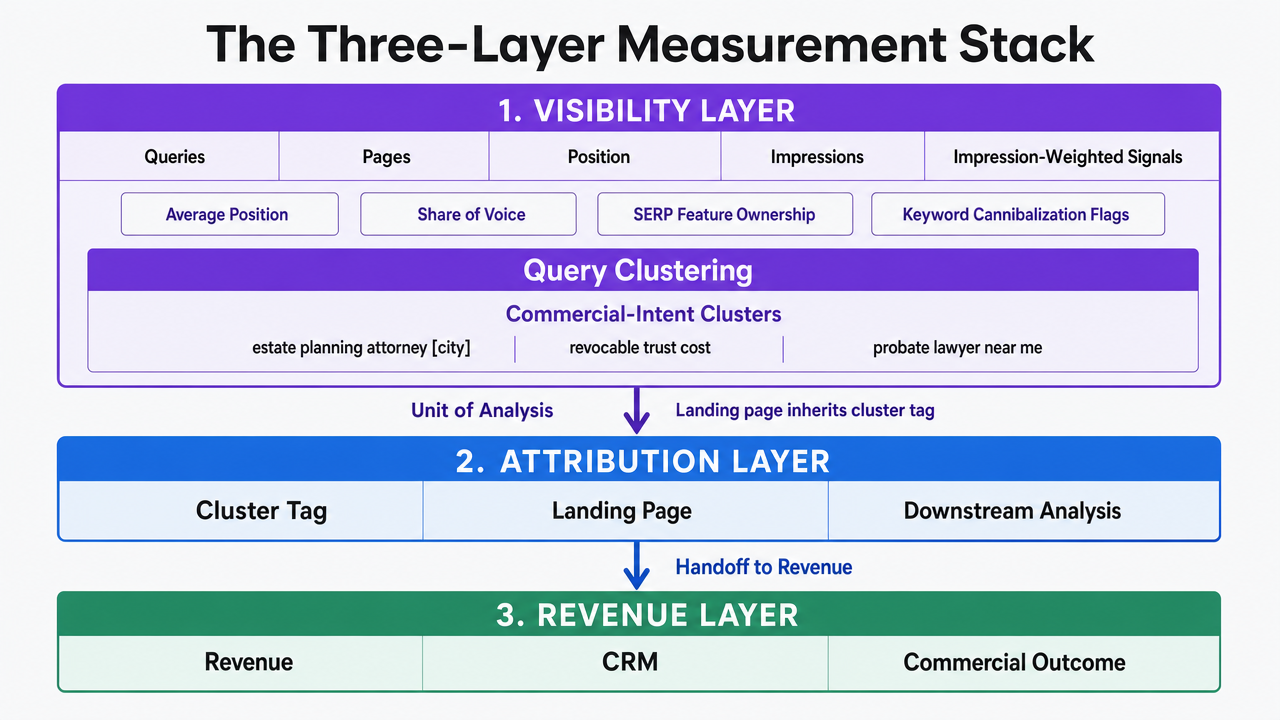 Visualize the three-layer measurement stack (visibility, attribution, revenue) and the specific data objects that hand off between them, directly reinforcing the section's operating model
Data Objects and Handoffs Between the Three Layers
Three objects have to move cleanly between systems for a rank-to-pipeline report to hold up under scrutiny. Each object is created in one layer, enriched at a handoff, and consumed by the next. When any of them loses metadata in transit, the revenue statement at the far end collapses into a directional guess.
- The first object is the query-cluster-tagged landing page. It originates in the rank tool's cluster taxonomy and travels to analytics through the page URL itself — either as a canonical path pattern the analytics team has mapped to a cluster, or as a URL parameter that survives the click. Without this tag, an organic session on /services/probate arrives at analytics as anonymous traffic; with it, the session inherits the commercial-intent classification that the rank tool established upstream.
- The second object is the conversion event with source metadata. Analytics generates the event when a form submits, a call connects, or a chat starts, and it must carry the source, medium, landing page, cluster tag, and session-scoped campaign fields into the CRM record. A form-post integration that drops UTM parameters at the CRM boundary is the single most common failure point in this stack, and it is silent — the CRM record looks complete, but the SEO contribution is gone.
- The third object is the stage-transition timestamp. Each time an opportunity moves from MQL to SQL to closed-won, the CRM writes a timestamp that the reporting layer joins back against the original session date. Without transition timestamps, sales-cycle length and stage-conversion rates cannot be computed, and rank-tool leading indicators cannot be tied to lagging revenue outcomes. Attribution credits touchpoints with revenue 2; the credit needs a time axis to be legible.
The operational discipline is straightforward: audit each handoff quarterly, confirm the payload arrives intact at the receiving system, and treat any dropped field as a production incident rather than a reporting nuisance.
Test Pipeline-Connected SEO Insights in Real Time
Experience live SEO rank data linked directly to actual client pipeline performance within days.
Attribution Humility: Why Rank Movement Is a Signal, Not a Cause
A tracked keyword moves from position 8 to position 3. Organic sessions on the associated landing page rise 34% over the next month. Three closed-won deals in the same quarter came through that page. The temptation is to draw a straight line from the rank gain to the revenue — and the line will not hold.
Forrester's critique of tactic-level attribution is blunt on this point: assigning revenue credit to a single tactic has intrinsic shortcomings that distort reality and impair marketing planning 4. Rank movement is one input among several. Concurrent shifts in paid spend, referral coverage, seasonal demand, sales-team activity, and product-page conversion rate all touch the same session. A rank tool cannot isolate its own contribution because it cannot see the other inputs.
The defensible framing treats rank movement as a leading indicator that correlates with downstream pipeline activity when the query cluster is commercial-intent and the landing page converts. The report language shifts from this rank gain produced $X in revenue to this rank gain increased impression share on cluster Y by N%, which coincided with a M% lift in conversions from that page over the following 30 days. The first sentence is a claim a CMO will disassemble. The second is a diagnostic finding a CMO can act on — and one the agency can substantiate from the data objects already moving through the stack.
Governance: Data Lineage, Privacy, and Aggregate Client Reporting
A rank-to-pipeline stack is a data-sharing arrangement dressed up as a reporting workflow. Query strings, page URLs, session IDs, conversion events, and opportunity records cross system boundaries on every report cycle, and each hop is a place where lineage and privacy obligations attach. NIST's Data Governance and Management Profile treats these obligations as first-class priorities rather than downstream cleanup, framing governance as an ongoing risk-management practice across systems that share data 5.
Three artifacts should live in the agency's client-services documentation and be reviewable on demand. The first is a data lineage map that names every field traveling from rank tool to analytics to CRM to reporting layer, identifies which system is the system of record for each field, and specifies who can modify definitions. When a client's MQL definition changes, the lineage map is what tells the analyst which reports need reconciliation.
The second is a privacy control register aligned to the NIST Privacy Framework's Govern, Control, Communicate, and Protect functions 6. Even for agencies not subject to sector-specific regulation, the register documents lawful basis for CRM processing, retention windows for session-level data, and the boundary between identified and de-identified reporting. NIST continues to update this framework and its cross-references to cybersecurity guidance, and agencies working with regulated verticals should track those revisions rather than treating the register as a one-time deliverable 11.
The third artifact only matters for agencies that publish aggregate cross-client benchmarks — average conversion rates by vertical, median stage-transition times, and similar portfolio statistics. NIST's guidance on differential privacy provides a formal way to quantify how much individual-client information can be inferred from an aggregate figure, and it defines the utility-versus-privacy tradeoff that determines how granular a benchmark can be before it discloses a specific client's data 13. Small denominators are the practical risk: a benchmark computed across four DSO clients is closer to a client-identifying disclosure than a genuine industry statistic, and the register should record which benchmarks are safe to publish externally versus safe only for internal calibration.
The Call-Conversion Blind Spot in Rank-to-Pipeline Reporting
Form submissions are the default conversion event in most analytics setups. In legal, dental, senior living, home services, and behavioral health, they are also the minority path. A caller who lands on a ranked page, reads for 90 seconds, and dials the tracked number never touches the form event that GA4 is watching — and the CRM record that gets created downstream carries no source metadata unless something in the call stack captured it. The rank tool did its job. The attribution layer never heard about the outcome.
Closing this gap requires dynamic number insertion tied to session source, call recording that persists the session identifier alongside the audio file, and a conversion event fired from the call platform back into analytics when a call meets qualification criteria. The qualification step matters as much as the routing: a raw call count inflates conversion volume with wrong numbers, hang-ups, and existing-client inquiries, none of which belong in the pipeline report. Call intelligence that reads the recorded call, tags qualified inquiries, and flags missed opportunities is what turns the raw call log into an event stream the CRM can accept without manual triage.
Two compliance obligations attach to this workflow the moment outbound follow-up begins. The FTC's Telemarketing Sales Rule requires that consent, disclosure, and recordkeeping obligations be met for calls that fall within its scope, and records supporting those obligations must be retained for the periods the rule specifies 7. The 2023 enforcement sweep made clear that lead generators and intermediaries who misrepresent consent provenance can be targeted directly, not just the entity making the outbound call 10. For a rank-to-pipeline stack, the operational consequence is that consent artifacts — form language, opt-in timestamps, call-recording disclosures — need to persist on the CRM record alongside the source metadata. If the reporting layer can trace a closed-won deal back to an organic session, it should also be able to produce the consent record for any outbound touch that occurred between the session and the close.
Agencies serving call-driven verticals that skip this layer are reporting on the wrong denominator. The rank movement looks real, the form conversions look flat, and the pipeline result is invisible because the majority of the pipeline arrived by phone.
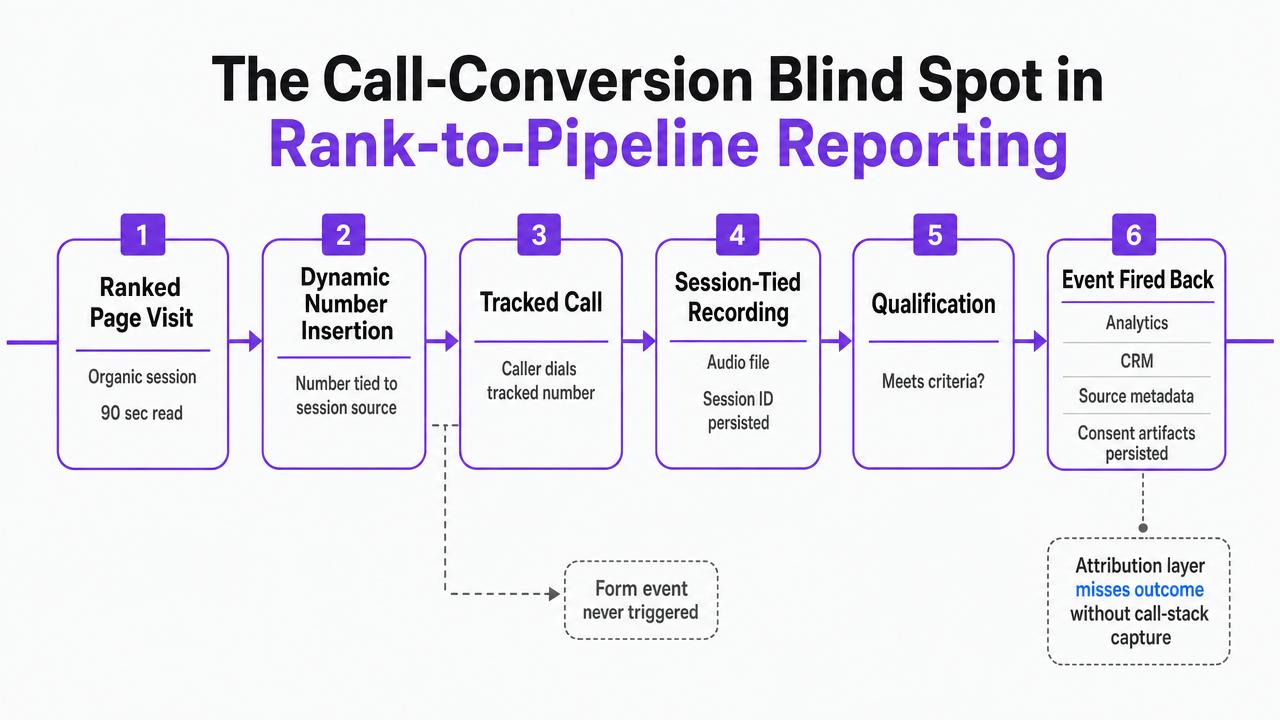 Visualize the call-conversion workflow described in the section — dynamic number insertion, session-tied recording, qualification, event fired back to analytics and CRM, and persisted consent artifacts — as a horizontal process diagram
Bridge the Gap Between SEO Rankings and Real Pipeline Impact
See how integrating rank tracking with pipeline analytics enables agencies to connect keyword movement directly to qualified leads and revenue outcomes—without manual reporting or resource drain.
If You Manage a Book of Clients: Delivery Economics of Rank-to-Pipeline
The article shifts here from single-client measurement to book-level delivery. A Head of SEO running 15 to 50 clients across a small analyst bench is not evaluating whether the three-layer stack is defensible in principle — that question is settled by the preceding sections. The operator question is how many analyst hours per client each client consumes to produce a defensible waterfall report, because that number sets the ceiling on how many clients an analyst can carry before quality degrades or the P&L inverts.
Three integration approaches produce meaningfully different economics. Manual spreadsheet stitching — analysts exporting rank data, GA4 reports, and CRM extracts, then reconciling cluster tags and source metadata by hand each cycle — is the highest-hour approach. Call it H hours per client per month. Clients per analyst (C) is bounded by analyst monthly capacity divided by H, and loaded cost per client is H × the analyst's fully loaded hourly rate. When H sits in the double digits, C collapses fast; a 160-hour analyst carrying 12-hour clients tops out around 13 accounts before quality slippage shows up in decks.
A BI-dashboard integration — rank, analytics, and CRM piped into a shared warehouse with modeled joins on the cluster tag and source metadata — moves fixed cost from monthly analyst time to one-time engineering, then reduces recurring H substantially. C rises in proportion. The tradeoff is that the dashboard has to be maintained: schema changes at any upstream vendor, or a client's CRM-stage redefinition, become engineering tickets rather than analyst spreadsheet edits.
An AI-assisted analysis layer compresses H further by handling the pattern-recognition and narrative-drafting work that consumes the most senior analyst hours — reconciling anomalies across systems, drafting the waterfall commentary, tagging call transcripts against qualification criteria. C rises again, and the analyst's time reallocates from reconciliation to review and client strategy.
The chart below plots H, C, and loaded cost per client across the three approaches as ratios rather than absolute dollars. What matters at the portfolio level is the direction and magnitude of the H → C relationship, because that is what determines whether the bench scales with the book or whether every new logo requires a new hire. CMOs evaluate marketing against customers, revenue, and profit 1; agency P&Ls answer to the same hierarchy, and analyst hours per client is the lever that moves it.
Presenting Rank-to-Pipeline Findings to Client CMOs
The renewal decision happens in the deck, not the dashboard. A CMO reviewing an agency's quarterly work has 20 minutes, a preloaded skepticism about channel-level claims, and a mental model built around opportunity creation and stage progression. The presentation either meets that model or it does not.
A defensible deck opens with the waterfall, not the rank chart. Slide one shows engaged sessions on commercial-intent clusters flowing into form and call conversions, then into MQLs, SQLs, and opportunities, with stage-transition rates on each hop 12. The rank data appears two slides later as the diagnostic explanation for the top-of-waterfall movement — impression share gained on cluster Y, position improvements on the head terms feeding page Z, and the resulting session lift. Reversing that order signals that the agency is measuring its own activity rather than the client's pipeline.
Three presentation disciplines separate the decks that renew from the ones that get discounted. Name the attribution model on every revenue-adjacent slide, because a CMO who cannot tell whether the number is last-click or data-driven cannot trust it 3. Distinguish diagnostic findings from causal claims in the slide language itself — coincided with, preceded, and correlated with are the load-bearing verbs, not drove or produced. And close with the next-quarter hypothesis the data supports, not a recap of the quarter that just ended. The CMO is buying the next 90 days, not applauding the last 90.
Frequently Asked Questions
References
- 1.Metrics That Matter For B2B Marketers.
- 2.What B2B Marketers Must Know And Do To Make Attribution Work.
- 3.Gaining Clarity: Marketing Attribution.
- 4.Tactic Attribution: Applying Practical Alternatives.
- 5.Data Governance and Management (DGM) Profile.
- 6.NIST CSWP 40 Initial Public Draft, NIST Privacy Framework 1.
- 7.Complying with the Telemarketing Sales Rule.
- 8.Telemarketing Sales Rule - Federal Trade Commission.
- 9.Q&A for Telemarketers & Sellers About DNC Provisions in TSR.
- 10.FTC, Law Enforcers Nationwide Announce Enforcement Sweep to Stem the Tide of Illegal Telemarketing Calls.
- 11.NIST Updates Privacy Framework, Tying It to Recent Cybersecurity Guidelines.
- 12.Measure Marketing Performance With The B2B Revenue Waterfall.
- 13.Guidelines for Evaluating Differential Privacy Guarantees.
- 14.NIST Privacy Framework.
- 15.Telemarketing Sales Rule.