
Key Takeaways
- Treat the ranking report as a governed data product with a fixed contract, defined metric spine, and versioned release cycle rather than a document rebuilt each cycle.
- Structure delivery in four layers — data contract, metric spine, narrative, and decision — so automation handles data assembly while strategists focus on interpretation and prioritized recommendations.
- Demote keyword rankings to the diagnostic tier and open the executive view with clicks, qualified conversions, and generative-search impressions from Search Console's AI performance report 2.
- Tier the template across executive, marketing lead, and analyst views to reconcile the three-to-five metric ceiling 8with enterprise depth like striking-distance and cannibalization detection 4.
Why the Ranking Report Deserves to Be Treated as a Product
Most agencies still ship the ranking report the same way they did five years ago: a strategist opens a template, refreshes a rank tracker, exports a Search Console screenshot, writes a paragraph of commentary, and PDFs the result. Multiply that by 40 clients and the delivery model collapses under its own weight. The template stops being a document and starts behaving like unmanaged software — patched by whoever touched it last, inconsistent across accounts, and impossible to audit.
The agencies compounding margin in 2026 are treating the ranking report as a governed data product with a fixed contract, a defined metric surface, and a versioned release cycle. Guidance from practitioners running client-facing Search Console workflows makes the point directly: reports need a defined period, clearly labelled source metrics, supporting page or query detail, a concise interpretation, and practical next actions — assembled in that order, not improvised each cycle 14.
Productizing the template does two things. It standardizes the 80% of the report that shouldn't vary between clients — the data pulls, the metric definitions, the comparison windows — so senior strategists only spend hours on interpretation and prioritized recommendations 8. And it makes the remaining 20% defensible, because every number on the page traces to a labelled source rather than an analyst's memory.
The Four-Layer Architecture
Layer 1 — The Data Contract
The data contract defines what enters the template and under what rules. It is the least glamorous layer and the one that fails most often when agencies scale past 20 accounts. Two engineering practices separate templates that hold up from templates that quietly rot.
First, label sources aggressively. Search Console and GA4 use different collection and attribution methods, and mixing them in a single chart without provenance is how disputes over "why do our numbers not match?" consume an entire client call 14. Every metric in the template should carry its origin — GSC Site Impression table, GSC URL Impression table, GA4 organic session, GA4 key event — as a first-class attribute, not a footnote. When a client asks why the impression count in the executive summary differs from the impression count in the keyword detail view, the strategist should be able to answer in one sentence.
Second, store raw API responses before aggregating anything. Agencies pulling GSC data through the API should preserve the untransformed payload so analysis can be re-run without re-querying and so every number in every past report can be audited months later 12. That single discipline — raw storage first, aggregation second — is what turns the ranking report from a document into a data product with a paper trail.
Layer 2 — The Metric Spine
The metric spine is the fixed list of numbers that appear in every client report, in the same order, with the same definitions, no matter who owns the account. The temptation is to expand it. The discipline is to compress it.
The current best-practice ceiling is three to five metrics tied to decisions the client actually makes 8. Anything more and the report becomes a scanning exercise where nothing stands out. Anything less and the spine cannot support the narrative layer that comes after it.
The defensible five for a stakeholder-facing template map cleanly to business questions. Clicks answer whether organic search is generating demand. Impressions answer whether the site is visible for the queries that matter. CTR answers whether titles and descriptions are earning the click when the impression is present — effectively the performance of positioning at the SERP level. Average position answers whether the site is competitive on the query set being tracked. Qualified conversions — however the client defines them in GA4 — answer whether the traffic is worth anything 7.
Each metric in the spine needs three attributes locked in the template: the source (GSC or GA4, per the data contract), the comparison window (which the cadence section handles), and the business question it answers. That third attribute is what account managers reach for when a metric moves and the client wants to know why it matters. If a strategist cannot state the question a metric answers in one sentence, that metric does not belong in the spine. Push it to the analyst tier.
Layer 3 — The Narrative Layer
The narrative layer is where senior strategists earn their rate. Everything below it can be automated. Everything above it depends on interpretation the client is paying for.
The rule for the narrative layer is that context and clear recommendations matter more than raw data — the section should focus on what stakeholders can actually act on, not what the dashboard happens to display 5. In practice, that means every material movement in the metric spine needs a one-paragraph explanation attached, and every paragraph needs to end somewhere the client can respond to.
A useful monthly narrative structure covers four things: top impression and click growth by content pillar, new keyword opportunities uncovered through position and CTR analysis, resolution status for indexing errors or enhancement warnings, and the measured impact of initiatives shipped in the prior cycle — schema deployments, content refreshes, technical fixes 15. That structure keeps the narrative anchored to work the agency has actually done, rather than drifting into general market commentary.
The narrative layer is also where interpretation risk lives. Directional signals from GSC — a two-position average movement, a CTR shift on a small query set — should not be inflated into claims the data cannot support 14. When the movement is noise, the narrative should say so and move on.
Layer 4 — The Decision Layer
The decision layer is what the executive actually reads. It sits at the end of the report and specifies what the agency recommends the client do next. Every SEO report should end with prioritized recommendations that support the decisions on the table 8. Not a bulleted list of tactics. A ranked queue.
Each recommendation in the decision layer follows a fixed anatomy:
- Observation — names what changed.
- Evidence — links to the specific query, page, or report in the narrative layer where the observation was surfaced.
- Strategic reasoning — explains why the recommendation follows from the observation — the connective tissue that most reports skip and that clients notice is missing.
- Proposed action — states who does what by when.
- Expected KPI impact — ties the action back to the metric spine so the next cycle can measure whether the recommendation worked.
Prioritization is the other half of the decision layer. Three recommendations, ranked, with the top one clearly flagged, force the account into a real conversation about sequencing. Ten recommendations, unranked, force nothing. The template should cap the visible decision layer at three items for the executive view and route deeper opportunities — striking-distance queries, cannibalization fixes, content gaps — into the analyst tier where they belong.
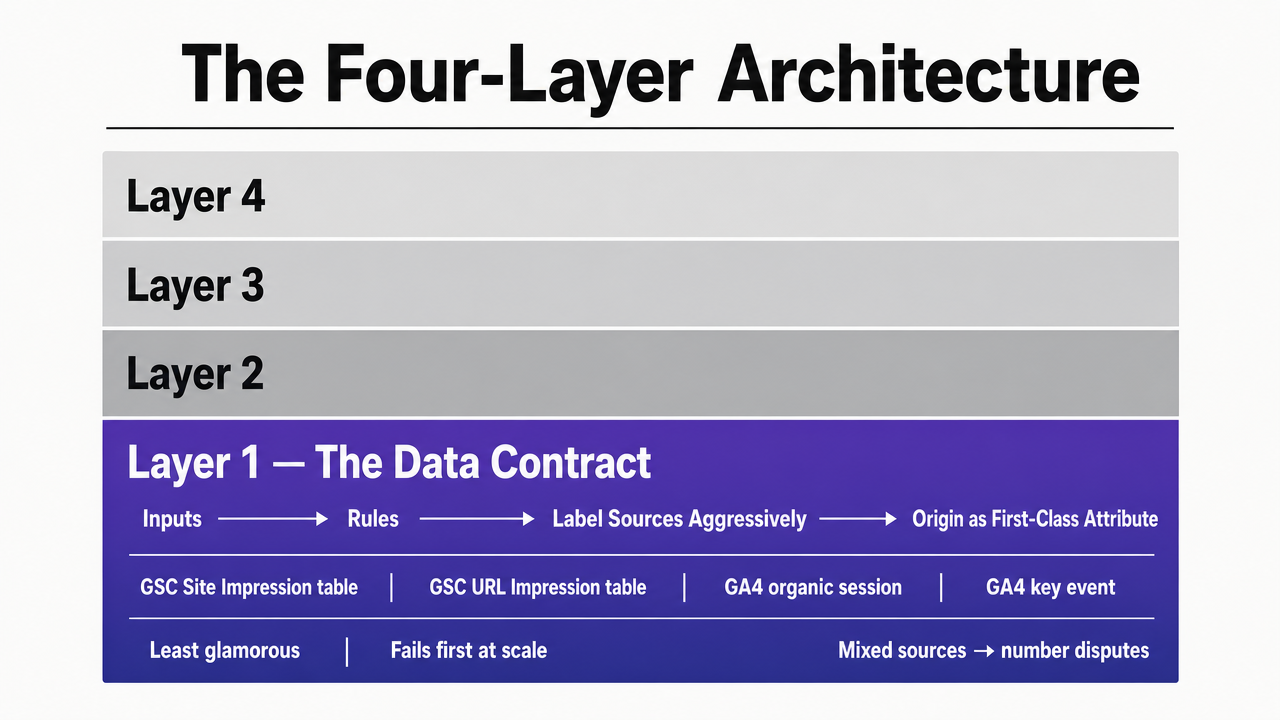 Visualize the four-layer template architecture described in the section as a stacked framework diagram, matching the section's core structural argument
Demoting Rankings, Promoting Generative Visibility
The 2026 template redraws its section hierarchy around a single argument: rankings are a diagnostic, not an executive KPI. The clearest statement of the shift comes from the reporting research telling agencies to stop reporting on rankings and start reporting on what keeps the business in business — revenue, sales, and leads 3. The template does not delete rankings. It moves them down the page, out of the executive summary and into the diagnostic band where average position, striking-distance queries, and CTR-by-position sit next to the actions they inform.
What replaces rankings at the top of the report is a two-column visibility view: traditional organic performance on one side, generative-search visibility on the other. Search Console now exposes a dedicated Search Generative AI performance report covering Impressions, Pages, Countries, Devices, and Dates for URLs surfaced in AI Overviews and AI Mode across Search and Discover 2. That dimension set matches the traditional Performance report almost exactly, which is what makes the side-by-side comparison structurally clean. The template can hold both streams without inventing new metric definitions.
Practically, three changes cascade from the demotion. The executive summary opens with clicks, qualified conversions, and generative impressions — not a keyword count. The keyword ranking section moves to the diagnostic tier, framed as an input to prioritized recommendations rather than an outcome. And the report gains a Generative Visibility block covering AI Overview impressions by pillar and the pages Google is surfacing in AI Mode, so the client sees where the site is showing up in the surfaces that increasingly precede a traditional click.
Test a live SEO ranking report workflow now
Build, review, and deliver real ranking reports to clients using actual project data during your trial.
Tiering the Template Across Stakeholders
Executive View — Five Metrics, One Page
The executive view is the version the client's CMO or founder actually opens. It fits on a single page, contains no more than five numbers, and ends with the ranked recommendations from the decision layer. Everything else routes downstream.
The composition is fixed: clicks, qualified conversions, generative-search impressions, average position, and a period-over-period delta on the client's declared north-star KPI. The layout borrows directly from the stakeholder-report structure that segments delivery into Performance Overview, Key Business Metrics, Challenges and Solutions, and Next Steps 9. Keeping it short and scannable is the point — long, detail-heavy reports lose the executive within thirty seconds, and the strategist loses the room 9.
What the executive view deliberately excludes is the keyword table. Position-level detail belongs in the diagnostic tier, not on the page where the client decides whether the retainer is working.
Marketing Lead View — Performance and Prioritized Actions
The marketing lead view is the working document. The client's in-house marketing manager or content director reads it weekly, argues with it, and uses it to brief their own team. It expands the executive view by adding the narrative layer in full and surfacing the three top prioritized recommendations with their complete anatomy — observation, evidence, strategic reasoning, proposed action, expected KPI impact.
Performance detail sits between the spine and the recommendations. Impression and click growth broken out by content pillar, resolution status for indexing and enhancement warnings, and the measured impact of initiatives shipped in the prior cycle give the marketing lead enough substrate to defend the SEO line item in their own internal reviews 15. This is the tier where context and clear recommendations matter more than raw data — the lead needs to know what to do next, not admire the trend lines 5.
Length discipline still applies. Two to three pages, not ten.
Analyst View — Striking Distance, Cannibalization, Page-Type, Query-Category
The analyst view is where the deep reports live. It is not client-facing in the traditional sense — it is the working file the agency's own senior strategists and junior analysts open between cycles, and the tier that gets shared with a client's technical SEO or data team on request. Enterprise dashboards routinely surface traffic performance, page-type performance, query-category performance, striking-distance opportunities, cannibalization detection, and multi-window date-range comparisons at this layer 4.
Four reports do most of the operational work:
- The striking-distance report isolates queries where the site ranks between positions 11 and 40 — the band with the highest expected return on optimization effort, because a small position gain moves an impression into a click 17.
- The cannibalization report flags queries where two or more URLs on the site are competing for the same intent.
- Page-type performance segments clicks and impressions by template (product, category, blog, resource, location page) so the strategist can see which content model is compounding and which is stalling.
- Query-category performance groups queries by topic cluster and exposes which pillars are gaining or losing share of voice 4.
None of this reaches the executive view. It feeds the recommendations that do.
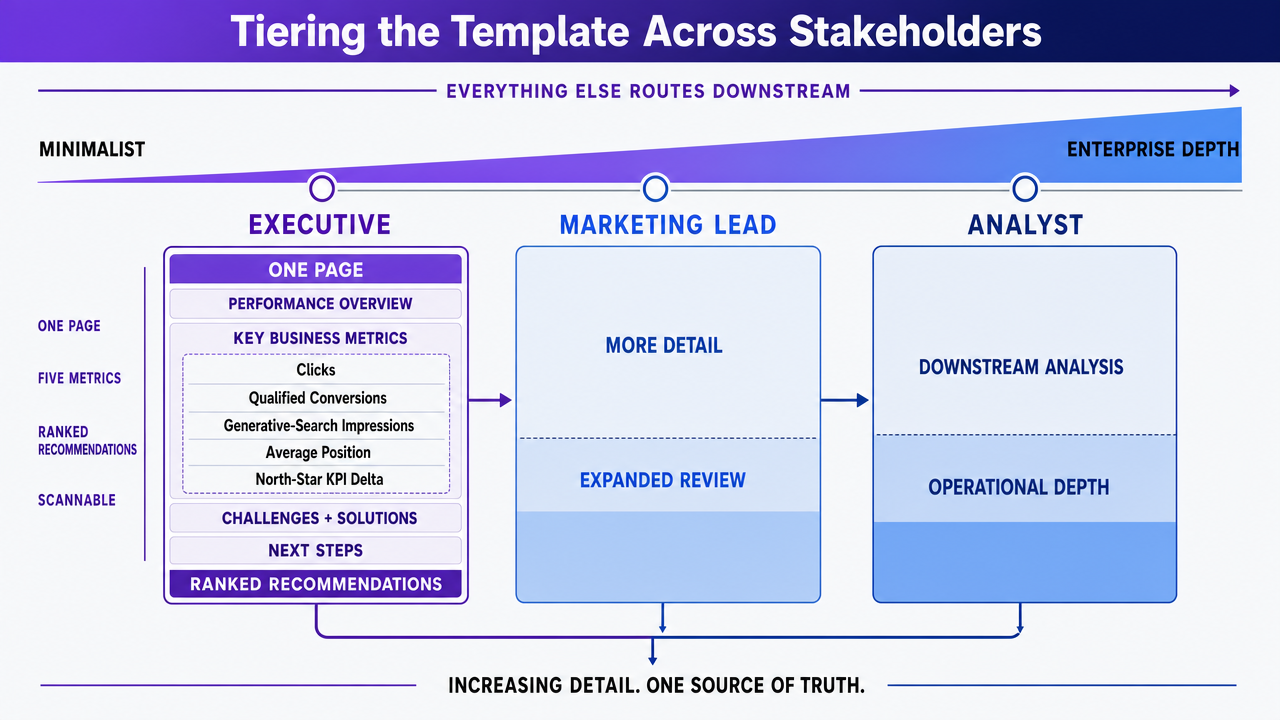 Compare the three stakeholder tiers (Executive, Marketing Lead, Analyst) side-by-side to reinforce the section's central resolution of the minimalist-vs-enterprise tension
Cadence, Comparisons, and the Weekly/Monthly Toggle
Cadence is a template decision, not a reporting preference. The template should hard-code two comparison windows and one granularity default, then expose the rest as parameters the strategist can toggle without rebuilding the view.
Search Console's Performance report now supports weekly and monthly aggregation directly in the chart area, with a granularity selector that switches the default daily view to a smoothed period view 1. That single control resolves a recurring template problem: daily volatility that reads as signal in an executive summary but is actually noise. The default for the executive view should be monthly with a prior-period comparison. The default for the marketing lead view should be weekly with a rolling twelve-week window. The analyst view keeps daily granularity because striking-distance and cannibalization detection depend on it.
Two comparison windows belong in every tier: period-over-period and year-over-year. Period-over-period catches recent movement the client's team caused or needs to respond to. Year-over-year controls for seasonality that period-over-period cannot see. Reporting only one of the two produces the wrong conclusion roughly half the time — a strong month against a weak prior period reads as growth until the year-over-year line shows the site is still down against the same month last year.
The Automation Stack: Looker Studio, GSC API, and Versioned Queries
The automation stack determines whether the template scales to 50 clients or dies at 15. Three layers do the work, and the boundary between them decides where a strategist's hours actually go.
Looker Studio sits closest to the client. Connected to Search Console, it produces branded, live-refreshing dashboards without additional cost, and extends cleanly into GA4 and Google Ads for cross-channel context 7. The connector exposes two tables — Site Impression and URL Impression — and the choice matters: site-level for the executive spine, URL-level for the diagnostic and analyst tiers 11. Building one Looker Studio template with client-name and property-ID parameters, then cloning it per account, is what turns dashboard construction from a per-client project into a per-client configuration.
The GSC API sits behind the dashboard. Direct API pulls are what agencies graduate to when the connector's row limits, sampling, and 16-month history stop covering the analyst tier. The discipline that separates a durable pipeline from a fragile one is versioned queries — every query definition kept under source control so a report from ten months ago can be regenerated exactly, quotas are handled explicitly, and audit trails survive staff turnover 12. Store raw responses first, aggregate second, and treat data freshness (typically a 24–48 hour lag) as a labeled attribute in the template rather than a footnote the client discovers during a call.
The payoff of the stack is compounding. A dashboard change ships to every client at once. A query fix propagates through every historical rebuild. The template stops being 40 documents and becomes one system with 40 configurations.
Get a Data-Driven SEO Ranking Report Template Tailored for Agency Workflows
See how top agencies streamline client reporting with a customizable template that integrates SERP data, KPI tracking, and multi-site rollups—engineered for high-volume, multi-channel SEO teams.
Scaling Economics: Hours Per Client Per Month
The template's value shows up in a single equation the agency's finance lead can actually read. Let
H : senior strategist hours spent per client per report cycle
C : the client count
R : report frequency
Total senior strategist hours per month equal H × C × R. A hand-built PDF workflow — refresh the rank tracker, export screenshots, write commentary, format the deck — typically pushes H into the range where senior strategists spend the majority of their available hours on production rather than interpretation. Scale C past thirty and the model breaks before the retainer economics do.
The layered template attacks H directly. The data contract and metric spine remove data assembly from the strategist's plate entirely once the Looker Studio parameters are set per account 7. The narrative and decision layers stay with the senior strategist because interpretation is what the client is paying for 8. The math changes shape: strategist hours become roughly constant per client regardless of R, because moving from monthly to weekly delivery does not add production work when the dashboard is live.
The compounding effect matters more than the per-client savings. Every template improvement — a new query-category cut, a refined striking-distance filter, a cleaner generative-visibility block — ships to every client at once. Fixed cost, distributed benefit.
Resolving the Minimalist vs. Enterprise Tension
Two credible schools of thought pull the template in opposite directions. One school argues for radical compression: three to five metrics, one page, prioritized recommendations, nothing else 8. The other builds enterprise dashboards with traffic performance, page-type performance, query-category performance, striking-distance, and cannibalization reports layered on top of each other 4. Both are correct. They are answering different questions.
The tiering resolves the tension mechanically. Minimalism governs the executive view because stakeholders lose long, detail-heavy reports within thirty seconds 9. Enterprise depth governs the analyst view because operational decisions require the substrate. The marketing lead view sits between them. One template, three surfaces, one source of truth — the tension disappears the moment the template stops trying to serve every reader on the same page.
Frequently Asked Questions
References
- 1.Introducing weekly and monthly views in Search Console.
- 2.Introducing Search Generative AI performance reports in Search Console.
- 3.How to report SEO results executives actually care about.
- 4.Enterprise SEO Reporting: Tips For Developing Effective Dashboards.
- 5.SEO Reporting Essentials: The Ultimate Guide.
- 6.SEO Ranking Report Template: Complete Guide (2026).
- 7.SEO Reporting: Client Dashboard & Metrics Guide.
- 8.8 SEO Reporting Best Practices to Follow in 2026.
- 9.Creating Enterprise SEO Reports for Stakeholders.
- 10.Using Search Console and Google Analytics Data for SEO.
- 11.Data Studio Search Console Connector.
- 12.Search Console API: The Complete Guide to Programmatic SEO Reporting.
- 13.Google Data Studio: How to create an actionable Search Console Performance Report.
- 14.Google Search Console Reporting for SEO Clients.
- 15.Google Search Console SEO Optimization Playbook.
- 16.A Guide to Google Search Console Reporting for SEO Agencies.
- 17.Using Google Search Console To Improve Your SEO.