
Key Takeaways
- Reframe ranking reports around three layers: leading indicators like rank and AI citations, lagging indicators like sessions and MQLs, and revenue indicators like sourced pipeline and an SEO ROI ratio 1, 10.
- Match attribution to sales cycle length: Last Interaction plus an assist view for short-cycle local accounts, and Linear or data-driven models stitched to CRM for long-cycle B2B pipelines 2, 8.
- Cap the executive summary at five KPIs tied to business goals, group rank data by cluster, and treat AI visibility from Search Console as a required leading-indicator block 5, 9, 11.
- Protect margin and renewals by pruning vanity metrics, automating a fixed reporting schema with strategist approval, and publishing consistent ROI inclusion rules month over month 3, 6, 11.
Why Ranking Reports Have Become the Weakest Link in Agency Retention
Ranking reports were initially designed to demonstrate activity. However, this very purpose now jeopardizes agency retention. When a CFO reviews a monthly SEO report displaying position changes, impression counts, and a Search Console screenshot, it confirms effort but fails to validate economic impact. Such reports often survive the account manager's review but falter during finance evaluations.
Current industry guidance emphasizes a shift towards reporting organic-sourced pipeline, organic-assisted pipeline, and a justifiable SEO ROI ratio, rather than just position charts 1. Dashboards should address a client's business objectives before presenting metrics. Rank tracking should serve as a leading indicator of trajectory, not the primary headline number 10. Client reports should prioritize revenue or leads, limiting the primary Key Performance Indicator (KPI) set to approximately five figures directly linked to business goals 11.
Heads of SEO managing numerous accounts face the compounding effect of this reporting gap. Each account relying on a rankings-first report risks renewal decisions based on client sentiment rather than quantifiable business value. Transforming the report into an attribution artifact, rather than merely a status update, shifts retention from a defensive stance to a data-backed one.
The Three-Layer Report Model: Leading, Lagging, and Revenue Indicators
Leading Indicators that Predict Trajectory
Leading indicators are metrics that show movement before revenue changes. They provide delivery teams with early signals of strategy effectiveness, often weeks before CRM data confirms outcomes. While crucial for operations, they typically appear secondary in client-facing narratives.
Metrics like rank position, impressions, and indexed pages serve as leading indicators because they signal potential trajectory rather than direct results. Rank tracking and impressions are early-warning tools that should be integrated with downstream traffic and conversion data, not presented in isolation 10. For instance, a cluster of target queries moving from position 14 to 6 forecasts future session growth, but does not represent the growth itself. Similarly, indexed page counts and technical health signals indicate the capacity to generate traffic, not the actual traffic volume 9.
AI citation rate is a recent addition to this category. Search Console's generative AI performance report details impressions, pages, and devices for URLs appearing in AI features. This provides agencies with a leading signal for AI-mediated visibility, aligning with the same trajectory logic as traditional rank data 5. Treating AI citations as a distinct discipline overlooks its function as a predictive metric similar to rank.
Lagging Indicators that Confirm Traffic Quality
Lagging indicators address whether initial trajectory translated into meaningful volume. Organic sessions, conversion counts, and marketing-qualified (MQL) and sales-qualified (SQL) lead totals confirm that rank improvements led to tangible client value 10.
Effective reporting here relies on segmentation. A 30% increase in organic sessions is uninformative if the additional traffic lands on non-converting informational pages. Reports should segment sessions by intent cluster and ensure conversions are tracked with consistent event tagging. This links each lagging metric to a specific business question, moving beyond generic dashboard displays 8, 10.
MQL and SQL counts belong in this layer, as they measure quality before economic value. Pedowitz highlights organic search as a multi-touch demand and influence channel, making MQLs sourced or influenced by organic content a critical link between session data and pipeline reporting 8. Reporting MQLs and SQLs alongside sessions provides clients with evidence that the funnel is attracting the right prospects, a prerequisite for any subsequent revenue claims.
Revenue Indicators that Justify the Retainer
The third layer is the only one that resonates with a CFO. Organic-sourced pipeline, organic-assisted pipeline, and an SEO ROI ratio transform ranking reports into economic documents rather than mere activity logs 1.
Sourced pipeline identifies deals where organic search was the initial recorded touchpoint. Assisted pipeline includes deals where organic contributed to a multi-touch journey but was not the origin. Both metrics are derived from CRM data integrated with analytics, underscoring that executive-level reporting requires CRM stitching, not just GA4 1, 8. Pedowitz advises reporting MQLs, SQLs, opportunities, sourced pipeline, influenced pipeline, and closed-won revenue tied to organic content to accurately reflect SEO's contribution in long sales cycles 8.
The ROI ratio is calculated as attributed organic revenue minus SEO cost, divided by SEO cost, expressed as a percentage 3. The crucial aspect is defining which revenue components are attributed and which cost components are included (e.g., retainer, tooling, contractor spend, internal hours). Agencies that clearly state their inclusion rules alongside the ratio provide a number that finance teams can audit. Without these rules, the reported ROI is likely to be dismissed.
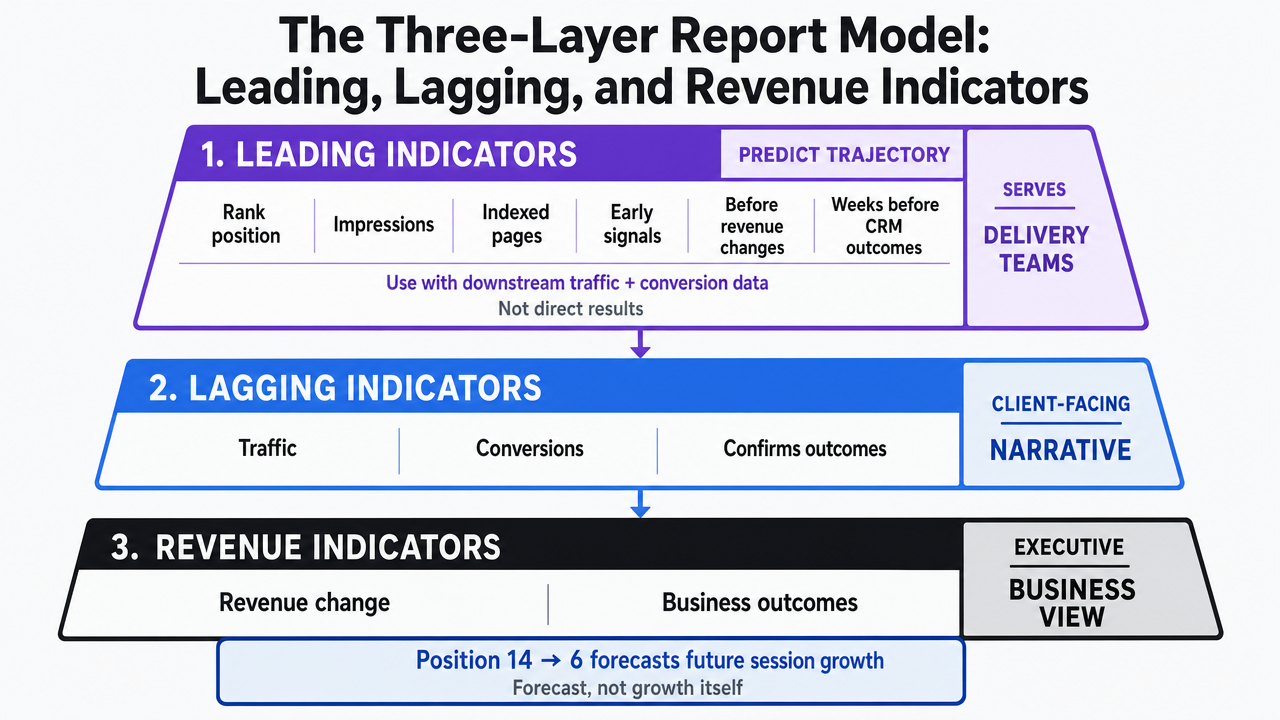 Visualize the three-layer report framework (leading, lagging, revenue indicators) as a stacked hierarchy showing what each layer contains and who it serves
Attribution Model Selection by Client Type
Short-Cycle Local Service Accounts: Last Interaction with an Assist View
Local service accounts with decision windows under 14 days do not require complex data-driven attribution to justify organic search. A Last Interaction model combined with a simple assist view is sufficient, as the brief buyer journey means a single-touch model largely reflects reality.
Last Interaction credits the final channel before conversion, which is appropriate for services like plumbing or dental practices where a searcher moves from query to phone call in a single session 2. The limitation is that it may overlook earlier organic discovery that leads to a branded return visit and conversion. This gap is addressed by a secondary assist view, showing organic-assisted conversions alongside the last-click number.
Delivery teams should present both figures in the same table. This allows the client to see direct organic conversions and instances where organic contributed without being the final touch, establishing a minimum standard for defensible short-cycle reporting 7.
Long-Cycle B2B Accounts: Linear or Data-Driven with CRM Stitching
For B2B accounts with sales cycles ranging from 60 to 300 days, relying solely on Last Interaction undersells organic search's contribution. A multi-touch view, supported by CRM data, is essential.
Google's Attribution Playbook describes the Linear model as distributing equal credit to each channel interaction leading to conversion 2. This approach clearly illustrates organic search's role in journeys where a prospect engages with multiple articles, downloads a report, returns via branded search, and ultimately converts through a sales-assisted demo. Data-driven attribution offers a more sophisticated approach by weighting touchpoints based on their observed contribution, but it typically requires a higher volume of conversions than most agency B2B accounts generate at the property level.
A practical recommendation is a three-view report: Last Interaction organic conversions, organic-assisted conversions or paths, and, where volume permits, a first-touch or data-driven contribution view 7. Each view answers a different question, and presenting all three prevents any single model from dominating the argument.
None of this is effective without CRM integration. Organic search should be recognized as a multi-touch demand and influence channel, not just a single-session traffic source. This necessitates consistent tagging of analytics events and their linkage to CRM records, enabling MQLs, SQLs, opportunities, sourced pipeline, influenced pipeline, and closed-won revenue to be traced back to organic content 8. Without this integration, the multi-touch model remains a theoretical chart; with it, it becomes a compelling renewal argument.
GA4 Lookback Windows and Reporting Model Configuration
Attribution model selection is only one part of the configuration. The lookback window determines how far back GA4 searches for qualifying touchpoints to assign credit. The reporting attribution model setting impacts both historical and future conversion and revenue data within the property 6.
Two settings are operationally significant: acquisition conversion events use one lookback window, and other conversion events use another, both configurable in the AttributionSettings resource 6. Short-cycle local accounts can use the shorter default without issue. Long-cycle B2B accounts should extend the "other-events" lookback to match their sales cycle duration; otherwise, early organic touches may be silently excluded from the credit path.
Delivery teams creating automated dashboards must document the lookback window and reporting model for each client property and version-control any changes. When the reporting model shifts, historical numbers also change. A client noticing a restated figure without a documented explanation can trigger churn conversations.
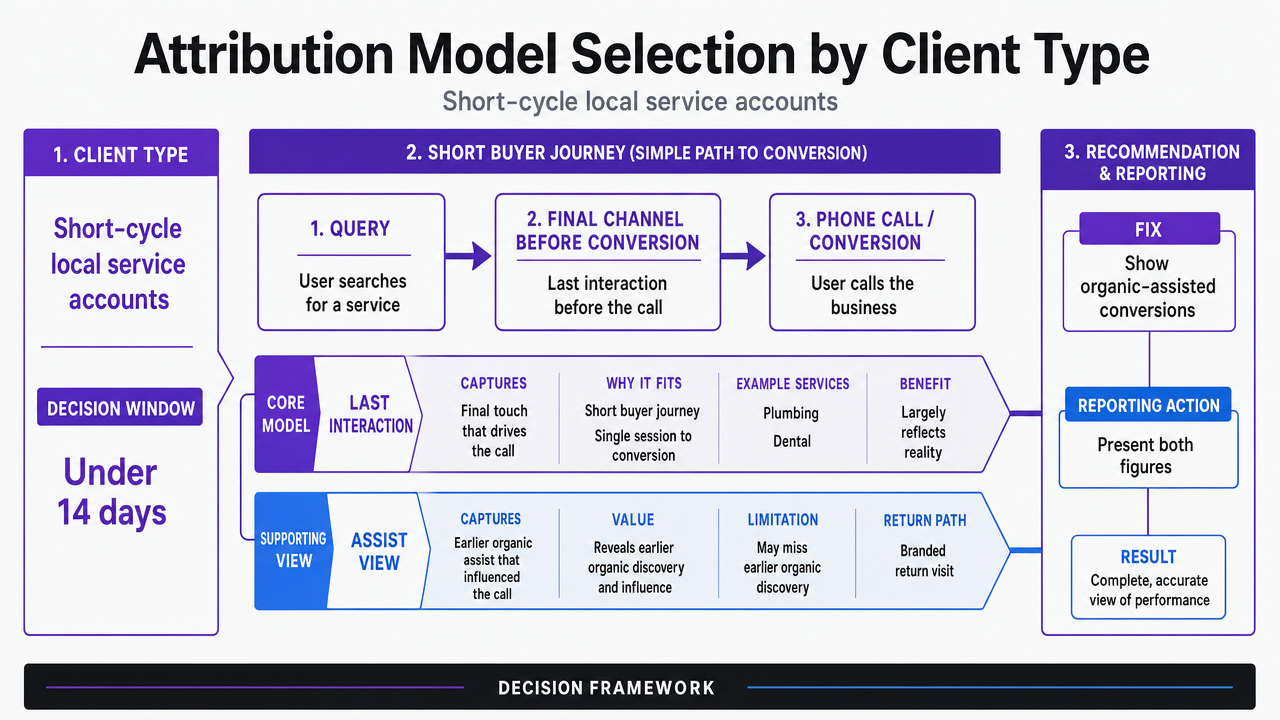 Compare attribution model selection across short-cycle local and long-cycle B2B accounts as a decision framework
Test Data-Driven SEO Reporting With Real Campaigns
Build and export fully functional SEO ranking reports using your own client data during the trial.
The 2026 Report Structure Clients Actually Read
Executive Summary and the Five-KPI Ceiling
The executive summary is the only page a CFO is guaranteed to read. Its purpose is to answer three key questions immediately: what changed, what was produced, and what happens next. Current best practices dictate leading with revenue or leads, not rankings, and capping the primary KPI set at approximately five figures directly tied to the client's business goals 11.
The five-KPI ceiling is a strict discipline. A report with twelve headline numbers forces the client to prioritize, which is the agency's responsibility. Delivery teams should fix the primary set to include organic-sourced pipeline, organic-assisted pipeline, an SEO ROI ratio, organic conversions, and a single trajectory metric like rank movement within a priority cluster 1, 11. All other metrics should be moved to an appendix.
The summary should conclude with a three- to five-item "next steps" block. This transforms the document from a status update into an actionable plan that the client can approve 11.
Rankings by Cluster, Technical Health, and Backlink Progress
Rank data is important, but it should not be presented as a mere list of positions. The modern report structure groups keyword movement by cluster, linking each block to a commercial theme relevant to the client, such as service line, geography, or funnel stage 9.
Cluster reporting changes the client's perception. Instead of 400 keywords sorted by delta, the report shows five to twelve clusters with average position, share of top-three coverage, and the two or three queries driving movement within each. This makes trajectory clear without requiring the client to interpret raw rank tables.
Technical health and backlink progress are placed alongside the cluster view because they both describe the capacity to earn traffic, rather than traffic already earned. A technical health section should cover indexation coverage, Core Web Vitals status, and outstanding crawl issues. A backlink progress section should highlight referring domain growth against priority clusters, not just a raw link count 9. Both belong in the leading-indicator tier, preventing them from being misinterpreted as outcome metrics.
Conversion Attribution and Revenue Narrative
The conversion attribution block is where the report demonstrates its value. It should present three views on a single page: last-click organic conversions, organic-assisted conversions or paths, and, if sufficient volume exists, a first-touch or data-driven contribution view 7. Presenting all three prevents a single model from becoming the sole argument and provides the client with a defensible range rather than a contested single number.
Each view requires its revenue equivalent. Analytics conversion counts, when stitched to CRM records, yield MQL, SQL, opportunity, sourced pipeline, influenced pipeline, and closed-won totals attributable to organic content 8. Reports that only provide conversion counts force the client to translate volume into monetary value, which often stalls ROI discussions.
The revenue narrative should be concise. Two or three sentences explaining what changed, which cluster or content set drove it, and how the number reconciles with the previous period. This narrative transforms the attribution table from raw evidence into an argument the client can present during a finance review 11.
AI Visibility as a Required Layer
AI visibility is no longer an optional appendix. Search Console's generative AI performance report provides impressions, pages, countries, devices, and dates for URLs appearing in AI features 5. This offers delivery teams a native data source for this metric, eliminating reliance on scraped estimates. This shift enables AI visibility to be reported with the same fidelity as classic Search Console performance data, and clients with content programs targeting AI-mediated queries will expect to see it.
This section should include two key figures and a list: impressions in AI features across priority clusters, a citation rate (AI-feature impressions divided by total impressions for the same URLs), and a brief list of currently surfacing pages 5, 9. This structure mirrors classic performance reports, making the metric easily understandable without a separate methodology page.
Search Console's near-real-time 24-hour view supports rapid iteration on AI visibility tests. Therefore, the report should highlight AI-feature movement that occurred within the reporting window, rather than waiting for a monthly refresh 4. Treating AI visibility as a live signal, not a quarterly novelty, establishes it as a defensible reporting layer.
What to Prune from the Standing Report
Pruning is a crucial discipline often overlooked in standard reports. Adding new layers like AI visibility and a three-view attribution block without removing anything results in a longer, not sharper, document. The five-KPI ceiling is compromised when dashboard tiles persist out of habit 11.
Three categories should be removed first. Average position across the entire keyword universe is a statistical artifact that obscures meaningful cluster movement; the cluster-level view discussed earlier should replace it 9. Bounce rate and time on page are irrelevant to revenue discussions, as they don't answer client business questions and often lead to unproductive debates 10. Raw backlink counts, when disconnected from priority clusters, indicate volume without capacity and should be replaced by referring domain growth mapped to relevant clusters 9.
The test is straightforward: if a metric cannot be linked to a specific client business question or one of the five primary KPIs, it should be moved to the appendix or removed entirely from the report 10, 11. Only essential metrics should remain.
See How Data-Driven Ranking Reports Can Quantify True SEO Impact
Request a walkthrough of automated reporting workflows that tie rankings to client ROI, integrating multi-channel KPIs for clear, audit-ready performance proof at scale.
If You Manage a Portfolio: The Economics of Reporting Itself
Analyst Hours Per Account Across Manual, Templated, and Automated Workflows
The focus here shifts from individual account reporting to portfolio management, which presents a margin challenge for Heads of SEO overseeing 15 to 80 accounts.
The economics are clear. Let H be analyst hours per client report per month, C be the active client count, and R be the blended analyst rate. Total monthly reporting labor is H × C, and total monthly reporting cost is H × C × R. The variable that can be influenced is H, as C is a growth target and R is a market rate.
| Workflow | Hours per report (H) | 40-client book (H × C) | Reclaimed capacity vs. manual |
|---|---|---|---|
| Manual: fresh pulls, hand-built decks | ~4.0 | 160 hours/month | — |
| Templated: standing Looker views, manual narrative | ~2.0 | 80 hours/month | 80 hours (~0.5 FTE) |
| Automated: piped data, generated narrative, human approval | ~1.0 | 40 hours/month | 120 hours (~0.75 FTE) |
At four hours per report for a 40-client portfolio, reporting alone consumes 160 analyst hours monthly, equivalent to a full-time employee dedicated to document production instead of strategy. Reducing H to one hour reclaims 120 hours, which could fund a new strategist or increase the capacity of existing team members. The five-KPI ceiling makes this reduction feasible: by fixing the primary KPI set to five figures tied to client business goals, the report template remains stable, providing a consistent schema for automation 11. Templated dashboards handle half the work, while approval-first automation generates the narrative and next-steps block, transforming data into a client-ready document.
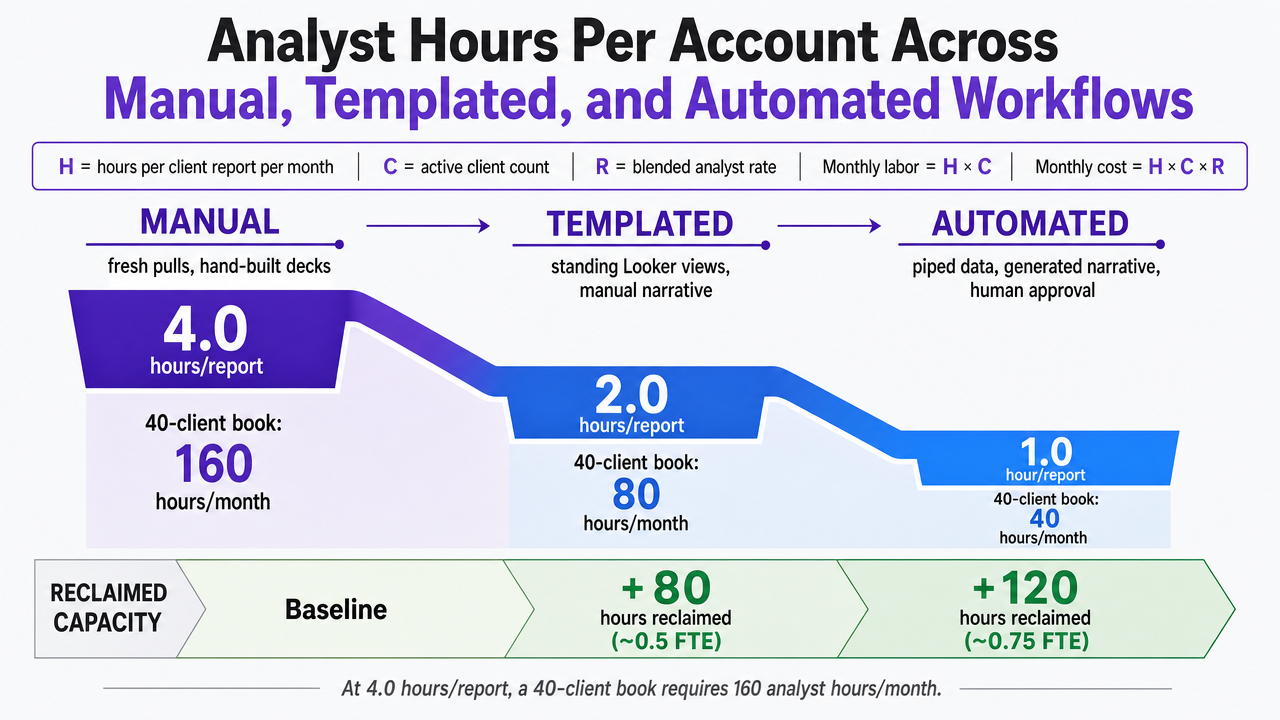 Visualize the hours-per-report and reclaimed capacity across manual, templated, and automated reporting workflows as cited in the article table
Approval-First Automation and the Renewal Conversation
Automation without a human approval step often gives automated reporting a negative reputation within agencies. A system that pushes numbers directly into a client-facing deck without strategist review produces the type of document a CFO will disregard: activity without a clear argument.
The solution is a workflow that separates data assembly from expert judgment. Piped data populates a fixed schema, including cluster rank movement, organic conversions, sourced and assisted pipeline, the SEO ROI ratio, and AI-feature impressions 1, 5. A strategist then approves the narrative and the three- to five-item next-steps block before the report is sent 11. Changes to reporting models, lookback windows, and restated historical figures are routed through the same approval gate, preventing silent numerical shifts that can derail renewal conversations 6.
This approach yields significant benefits during renewal. A client who consistently receives the same five primary KPIs each month, with transparent inclusion rules for revenue and cost, enters renewal with a document their finance team has already vetted. The strategist's time shifts from report production to engaging in conversations that secure account retention. This resolves the retention-versus-margin trade-off for Heads of SEO, benefiting both.
Defending Fees During Renewal: Turning the Report into the Contract
Renewal is not a new sales cycle; it is a review of the ongoing report. Agencies that treat the report as the renewal document have already built their case.
Three strategies make the report defensible under fee pressure. First, publish the SEO ROI ratio with its inclusion rules for revenue and cost every month. This ensures that the ratio presented at renewal is the twelfth consistent reading of a number already audited by the client's finance team, not a new figure introduced under duress 3. Second, maintain the primary KPI set at the same five figures throughout the contract term. This allows for clear trajectory analysis across quarters, avoiding resets with each template change 11. Third, route every reporting model change, lookback window adjustment, and restated historical figure through a documented approval process. This prevents silent numerical shifts that can undermine renewal discussions 6.
The economic argument mirrors the report's structure. Organic-sourced pipeline and organic-assisted pipeline, when linked to CRM records, transform the retainer into a measurable cost of pipeline that clients can benchmark against paid channels 1, 8. When these figures are consistent, the fee conversation shifts from justification to straightforward arithmetic.
Frequently Asked Questions
References
- 1.How To Define & Report SEO KPIs That Actually Move The C-Suite.
- 2.Attribution Playbook - Google.
- 3.Measuring SEO Value and ROI | The SEO Handbook.
- 4.An improved way to view your recent performance data in Search Console.
- 5.Introducing Search Generative AI performance reports in Search Console.
- 6.AttributionSettings | Google Analytics.
- 7.How to Measure SEO ROI for Clients: Rankings to Revenue.
- 8.How should SEO integrate with marketing attribution?.
- 9.Client SEO Report Guide: Templates, KPIs, and AI Metrics (2026).
- 10.SEO Reporting: Client Dashboard & Metrics Guide.
- 11.19 SEO Client Reporting Best Practices That Retain Clients.