
Key Takeaways
- Rank and visibility tools like Ahrefs, Semrush, and AccuRanker are sensors that feed the stack—standardize on one platform per portfolio so exports flow cleanly into analytics rather than living as standalone dashboards.
- Web and conversion analytics platforms such as GA4, Adobe Analytics, and Piwik PRO price the visibility by turning sessions into events, requiring a shared taxonomy before downstream layers can join data 2.
- Call tracking through CallRail, Invoca, or CallTrackingMetrics closes the offline attribution gap in law, healthcare, and home services, where the sale happens on the phone rather than a form fill 4.
- Multi-touch attribution via GA4 DDA, Rockerbox, or Dreamdata distributes credit across the journey; different models produce divergent ROI numbers, so run a primary and secondary as sensitivity checks 3.
- The execution and approval layer converts diagnoses from the first four layers into shipped work under human sign-off, replacing specialist headcount rather than coordinating it against Forrester's TEI cost side 8.
- Portfolio economics turn on how many specialist FTEs the stack lets an agency avoid as accounts grow, not on which rank tracker costs least—that number defines gross margin per account 8.
Why Rank Trackers Alone Stopped Winning Renewals
The quarterly business review used to end with a rankings screenshot. A dozen commercial keywords moved from page two to the top five, the client nodded, and the retainer rolled. That reflex no longer holds. Finance leads at law firms, DSOs, and multi-location home services want a straight line from organic visibility to signed matters, booked consults, and closed jobs. Position deltas do not draw that line.
Forrester's Total Economic Impact model for SEO reframes the program as an investment quantified by benefits (traffic, conversion lift, paid media savings), costs (technology, agencies, salaries), and risk-adjusted returns tied to algorithm volatility and implementation drag 8. A rank tracker reports one input into the benefits column. It cannot price the conversion lift, isolate the paid media offset, or absorb the risk discount a CFO applies to next quarter's forecast.
McKinsey's decision journey work compounds the problem. Buyers now touch search, review sites, referrals, and paid channels before they call, and marketers are expected to measure impact across those touchpoints rather than at a single point of purchase 7. Last-click keyword reporting undersells assisted contribution and hands ammunition to any client questioning the invoice.
The agencies keeping accounts through pricing pressure are not the ones with prettier rank dashboards. They are the ones running a stack that converts visibility into revenue evidence a controller will sign off on. The rest of this piece names the five layers that stack requires, and the tools that fit each one.
The Five-Layer ROI Stack Framework
Rank tracking sits inside a larger measurement architecture, and the agencies proving ROI treat that architecture as five distinct layers that feed one narrative. Forrester's Total Economic Impact model for SEO organizes the program into benefits (traffic, conversion lift, paid media savings), costs (technology, agencies, salaries), and risk-adjusted returns tied to algorithm volatility and implementation drag 8. Each of the five layers below maps to a specific claim the agency needs to defend inside that TEI structure.
- Layer one, rank and visibility, quantifies the top-of-funnel benefit: which commercial queries surface the client and at what share of voice.
- Layer two, web and conversion analytics, prices the conversion lift by turning sessions into form fills, bookings, and downstream events.
- Layer three, call tracking and lead attribution, closes the offline gap in verticals where the sale happens by phone.
- Layer four, multi-touch attribution, allocates credit across the journey so assisted contribution counts against the invoice.
- Layer five, execution and approval, converts the insights the first four layers produce into shipped work without adding specialist headcount.
The layers stack in that order because each one depends on the data the layer above it emits. Skip a layer and the ROI narrative collapses at the seam.
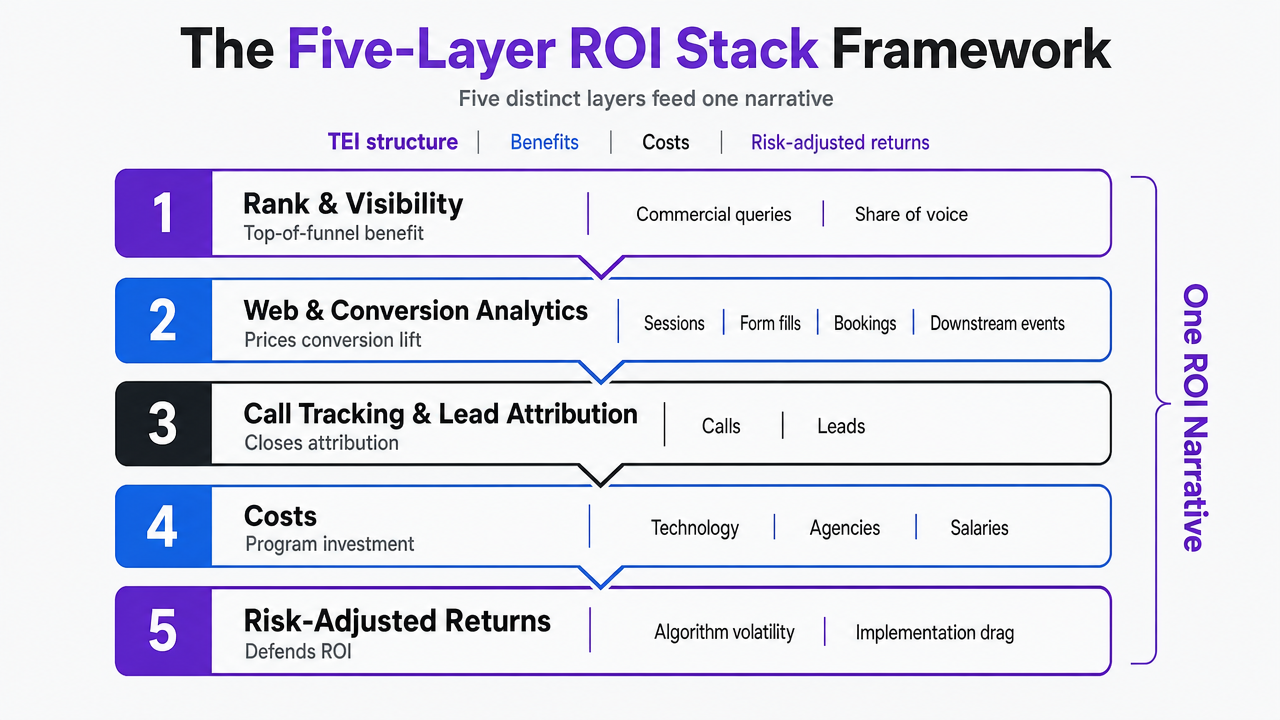 Visualize the five-layer stack architecture described in the section, showing how each layer feeds the next in the ROI narrative
Layer One: Rank and Visibility Tools That Feed the Rest of the Stack
Rank and visibility platforms are the raw sensor array. They tell the agency which commercial queries surface the client, at what position, in which geography, and against which competitors. That signal is upstream of every ROI claim the rest of the stack will make, which is why the choice of tool at this layer is about data fidelity and export discipline, not dashboard aesthetics.
Ahrefs and Semrush remain the default enterprise picks because their index depth and keyword databases feed the visibility side of Forrester's TEI benefits column with defensible traffic estimates and share-of-voice math 8. AccuRanker and SE Ranking earn their seats through daily SERP granularity and cleaner API access, which matters when a delivery team is piping rank data into a client BI layer rather than screenshotting a dashboard. STAT and Nozzle sit further along the same axis, built for portfolios that need SERP feature tracking and pixel-depth analysis at scale. Google Search Console is not optional at this layer; it is the ground-truth impression and query stream every third-party tool has to be reconciled against.
The peer-reviewed literature reinforces why this layer matters as a starting point rather than an ending one: SEO is treated as a cost-effective visibility investment that has to be measured against business results, not celebrated as a standalone output 1. Rankings alone describe reach. They do not describe whether the reach produced anything.
The operational takeaway for a Head of SEO is narrower than the vendor comparison charts suggest. Pick the tool whose API and export model will feed layers two through five cleanly, and standardize on it across the portfolio. Two rank trackers running in parallel across accounts is a reporting tax that compounds every QBR. One tool, one taxonomy, one export cadence—then the stack downstream can actually price what the visibility is worth.
Measure SEO performance impact with real data
Test-drive advanced ranking analytics and publish live client results in your first week—no commitment required.
Layer Two: Web and Conversion Analytics as the Quantitative Backbone
Once the rank layer establishes reach, web and conversion analytics has to price it. This is where sessions become form fills, chat starts, appointment requests, and quote submissions—the events a client's finance lead will accept as evidence that organic visibility produced something. The peer-reviewed synthesis on this topic is direct: web analytics supplies the quantitative measures of user behavior required to evaluate the effectiveness and ROI of online marketing campaigns 2. Without that measurement, the visibility numbers upstream have no denominator.
GA4 is the default at this layer for one reason: it is the only platform every client already has, and its event model can be shaped to fit vertical-specific conversion definitions. Adobe Analytics earns its place in enterprise portfolios where audience segmentation and pathing analysis need to survive a legal review. Piwik PRO and Matomo have gained ground in law and healthcare accounts where server-side data ownership matters for compliance posture. Hotjar and Microsoft Clarity sit alongside as behavioral overlays that explain why a landing page converts at 2.1% instead of 4%—information the rank tracker cannot supply.
The operational discipline at this layer is event taxonomy. A DSO with 40 locations, a personal injury firm with three practice areas, and a home services operator with eight service categories cannot share one generic conversion event schema and expect the reporting downstream to hold. Each conversion event needs a value assignment, a source dimension, and a definition the client's intake team will recognize. Engagement signals—scroll depth, dwell, satisfaction proxies—belong in the same schema, since search system evaluation increasingly treats relevance and user experience as core performance measures alongside position 6.
Standardize the event dictionary before layer three arrives. Call tracking data has to land in the same schema or the attribution math breaks.
Layer Three: Call Tracking and Lead Attribution in Service Verticals
In law, healthcare, dental, home services, senior living, and behavioral health, the sale still happens on the phone. A ranking that produces 400 monthly organic sessions to a personal injury landing page is not the ROI unit. The 22 intake calls those sessions generated, the 14 that qualified, and the 3 that signed retainers are the ROI unit. Without a call attribution layer, that entire chain is invisible to the reporting stack, and the agency is effectively asking the client to trust that traffic became revenue.
The call tracking literature is explicit on this point: call tracking enables attribution of inbound phone leads to specific marketing campaigns, closing a critical gap in ROI measurement for service-oriented businesses 4. CallRail, Invoca, CallTrackingMetrics, and DialogTech occupy this layer for most agency portfolios, with dynamic number insertion assigning unique tracked numbers to organic sessions so a call can be traced back to a keyword, landing page, and campaign source. Invoca and DialogTech push further into conversation intelligence, using speech analytics to score whether a call was a qualified lead, a price shopper, a scheduling request, or a wrong number—which is the difference between reporting 22 calls and reporting 14 qualified leads at a defensible cost per acquisition.
Two operational caveats belong here rather than scattered through the rest of the piece. First, call tracking sits inside a regulated data perimeter. Privacy and data protection concerns around call recording and tracking complicate deployment in law and healthcare, where consent language, BAA coverage, and recording disclosure requirements vary by jurisdiction 4. Legal review of the vendor contract is not optional. Second, even well-resourced organizations struggle to attribute outcomes to specific campaigns, as the GAO documented across federal digital advertising programs 5. That is a useful credibility beat when a client's finance lead pushes back on attribution precision: the ask is a defensible model, not a perfect one.
The integration discipline at this layer decides whether the data is useful. Tracked numbers, call outcomes, and qualification scores need to write into the same event schema layer two established, keyed to the same source dimensions, so a call that started from an organic session on a specific practice-area page can be joined to the keyword that produced the session. When that join works, the agency can report cost per qualified lead by keyword cluster. When it does not, the call tracking tool becomes a parallel dashboard nobody reconciles.
Layer Four: Multi-Touch Attribution and the Journey Beyond Last Click
Rank data, conversion analytics, and call tracking each produce credible evidence in isolation. Multi-touch attribution decides how that evidence gets distributed across the journey that produced a signed client. This is the layer where the agency stops arguing about whether SEO worked and starts negotiating how much credit it earned against paid search, direct, referral, and email touches on the same conversion.
The methodological reality is uncomfortable but useful. Attribution models allocate credit for conversions across multiple touchpoints, and different models produce divergent ROI estimates for the same campaign 3. A last-click model routes a signed personal injury retainer to the branded search that closed the loop. A linear model spreads credit evenly across the six touches that preceded it. A time-decay model weights the touches nearest the conversion. A data-driven model uses the conversion history to assign fractional credit. The same 14 qualified leads can produce four defensible ROI numbers depending on which model the agency runs. That divergence is not a flaw to hide from the client. It is the negotiation.
Google Analytics 4's data-driven attribution, Adobe Analytics' Attribution IQ, Rockerbox, Dreamdata, and HubSpot's revenue attribution reporting occupy this layer for most agency portfolios. Enterprise accounts increasingly expect this measurement to sit inside a cross-channel marketing hub, since Forrester's landscape work documents that leading hubs now offer built-in attribution and measurement capabilities to demonstrate marketing impact across channels 9. Agencies competing for those accounts need attribution outputs that can feed a CCMH cleanly, not a standalone dashboard the client's marketing operations team has to reconcile by hand.
McKinsey's decision journey work supplies the framing the agency should carry into every QBR: marketers must measure what matters across the entire journey, not only at the point of purchase 7. The operational discipline is to pick one primary attribution model per client, document why, run a secondary model as a sensitivity check, and report both. When the primary and secondary models produce different ROI figures, that gap is the credibility beat—it tells the CFO the agency understands the assumptions behind the number rather than defending a single figure as truth. The client that signs off on the methodology once will accept the ROI narrative it produces every quarter after.
See How Top Agencies Report and Scale SEO ROI with Unified Ranking Data
Connect with our team to explore advanced SEO ranking analytics, automated reporting, and actionable insights purpose-built for agencies managing multi-client portfolios at scale.
Layer Five: The Execution and Approval Layer Most Roundups Skip
The first four layers produce a diagnosis. Rank data flags where visibility is thin, conversion analytics prices what the visibility is worth, call tracking closes the offline gap, and multi-touch attribution distributes credit across the journey. None of them ship a single page, brief, backlink, or landing page revision. The gap between insight and executed work is where most agency retainers quietly leak margin, and it is the layer almost every 'best SEO ranking tools' roundup omits.
The economic case for treating execution as its own layer sits inside Forrester's TEI cost column. Benefits accrue from traffic and conversion lift, but costs are dominated by technology, agencies, and salaries 8. When a delivery lead reads a ranking drop on a client's cornerstone practice-area page, the response is not another dashboard. It is a brief, a content revision, a schema fix, an internal link change, and an approval before anything ships. Every hour spent moving that work through Slack threads, ticket queues, and status calls is a cost the TEI model prices against the ROI number the first four layers just produced.
Cross-channel marketing hub literature raises the bar further. Forrester's landscape work documents that enterprise buyers now expect measurement, orchestration, and execution to sit inside a governed loop rather than a stack of disconnected point tools 9. Agencies competing for those accounts need an execution layer whose approval trail, audit history, and change log a client's marketing operations team can actually inspect.
Vectoron sits at this layer as an AI marketing execution platform with specialist strategists for content, SEO, PPC, backlinks, social, and call intelligence coordinated through a Command Center approval workflow. The relevant claim for an agency lead is narrow: it turns the diagnoses the first four layers produce into shipped work under human approval, without adding a specialist to run each channel. That is the ROI claim this layer underwrites in a QBR—headcount avoided against work shipped, priced against the TEI cost side.
Stack Economics for Multi-Location and Portfolio Operators
A note on audience scope: the framework so far applies to any agency proving ROI on a single client account. The math below narrows to delivery leads running multi-location portfolios—DSOs with 20 to 200 locations, personal injury firms with multiple practice areas, home services franchisors, and senior living operators with regional footprints. These portfolios are where stack economics either defend margin or quietly erode it, because every layer's cost gets multiplied by the number of brands, locations, or practice areas the delivery team supports.
Forrester's Total Economic Impact model prices SEO costs across technology, agencies, and salaries 8. In a portfolio context, the salaries line is the one that moves fastest. A rank layer, an analytics layer, a call tracking layer, an attribution layer, and an execution layer each imply an operator—someone who owns the taxonomy, reconciles the exports, and turns the output into shipped work. Hire one specialist per layer and the fully loaded headcount cost dominates the tech spend by an order of magnitude. Consolidate the operators without consolidating the tools and the reconciliation tax shows up in QBR prep hours instead.
The table below sketches the stack against the specialist role each layer would otherwise require. Tool costs are marked variable because vendor pricing turns on seats, tracked keywords, tracked numbers, and event volume—assumptions that shift by portfolio size.
| Layer | Representative tools | Monthly cost | Specialist role replaced |
|---|---|---|---|
| Rank and visibility | Ahrefs, Semrush, AccuRanker, STAT | Variable by seat and tracked keyword volume | SEO analyst (rank ops) |
| Web and conversion analytics | GA4, Adobe Analytics, Piwik PRO | Variable by event volume; GA4 free tier | Analytics engineer |
| Call tracking and lead attribution | CallRail, Invoca, CallTrackingMetrics | Variable by tracked numbers and minutes | Conversion analyst |
| Multi-touch attribution | GA4 DDA, Rockerbox, Dreamdata | Variable by connected sources and seats | Attribution/marketing ops lead |
| Execution and approval | Vectoron | $599/mo trial rate; portfolio pricing on request | Content, SEO, PPC, backlinks, social, call intelligence specialists |
Illustrative five-layer stack against the specialist headcount each layer would otherwise require. Tool costs vary by vendor terms; only the Vectoron trial rate is a supplied figure.
The interpretation a delivery lead should carry into a margin review is direct. The first four layers each replace roughly one specialist function; the fifth replaces the delivery pods that ship the work those layers diagnose. Priced against the TEI cost side, the portfolio question is not which rank tracker is cheapest—it is how many specialist FTEs the stack lets the agency avoid hiring as the account count grows 8. That is the number that shows up in gross margin per account, and it is the one worth defending.
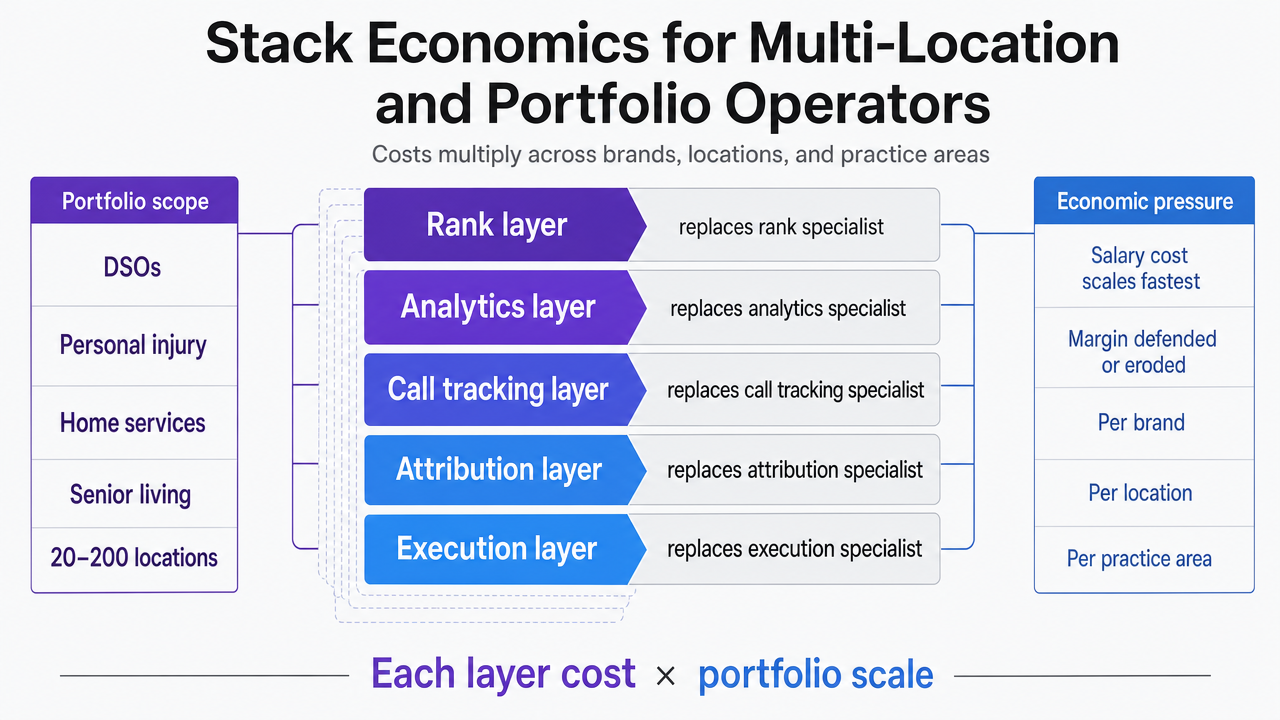 Reinforce the table by visualizing each stack layer mapped to the specialist role it replaces, supporting the section's cost/headcount argument
Assembling the Stack: A Direct Recommendation
The five-layer framework is not a shopping list. It is a sequencing decision. A delivery lead assembling the stack for the first time should build it in the order the layers depend on each other, not in the order the vendor demos land in the inbox.
Standardize on one rank and visibility tool across the portfolio and lock the export cadence into the analytics layer before touching anything else. Ship a shared event taxonomy in GA4 or the enterprise equivalent next, with conversion values assigned per vertical and per practice area. Only then add call tracking, because the tracked-number data has to write into the schema layer two already established, or the join breaks. Attribution comes fourth: pick one primary model per client, run a secondary as a sensitivity check, and document both in the QBR deck so the methodology becomes the negotiation rather than the number 3.
The fifth layer is the one that closes the retainer. Insight the first four layers produce is only worth the work it ships. An execution and approval layer—Vectoron sits here—turns diagnoses into approved briefs, revisions, and published pages under human sign-off, priced against headcount avoided on the TEI cost side 8. That is the ROI narrative a CFO signs.
Frequently Asked Questions
References
- 1.Search Engine Optimization and Its Importance in Digital Marketing.
- 2.Web Analytics for Measuring Online Marketing Performance.
- 3.Digital Marketing Analytics: Methods and Metrics.
- 4.Call Tracking and Conversion Analytics in Service Businesses.
- 5.Digital Advertising: Federal Practices and Measurement.
- 6.Search engine Performance optimization: methods and techniques.
- 7.The consumer decision journey.
- 8.The ROI Of SEO - Forrester.
- 9.The Cross-Channel Marketing Hubs Landscape, Q2 2024.
- 10.The Forrester Wave: Cross-Channel Marketing Hubs, Q1 2023.