
Key Takeaways
- A credible SEO report answers three sequential questions: can search engines index the pages that matter, is visibility trending upward, and do those clicks convert into pipeline.
- Rank alone is no longer diagnostic — reports must annotate position changes with SERP feature context, segment branded from non-branded queries, and split CTR by device and query intent.
- Page experience belongs in the report as Core Web Vitals field data at the 75th percentile, not Lighthouse lab scores, and AI surface impressions deserve their own trend line separate from classic organic.
- Run the report against the seven-check rubric on Monday: fewer than five yeses means the vendor is billing for activity rather than measurement, and non-brand clicks must be joined to booked pipeline with a named attribution window.
The three questions a credible report has to answer
Strip away the rank tables, the keyword count screenshots, and the backlink pie charts, and a serviceable SEO report for a website answers three questions in sequence. Can search engines find and index the pages that matter? Is visibility on those pages trending in the right direction? And is that visibility producing clicks that convert into pipeline?
Everything else is decoration. The sequence matters because each question gates the next: a page that isn't indexed can't rank, a page that ranks without click yield doesn't produce traffic, and traffic that doesn't convert doesn't defend a marketing budget to a CFO. Google's own Search Console workflow reflects this order — index coverage, then performance data on clicks, impressions, CTR, and average position, then the downstream reports that surface content-level engagement 1, 3.
What has changed in the past two years is the interpretive layer. Position alone is no longer diagnostic. SERP features now compress or amplify click yield at the same rank, device mix shifts CTR benchmarks, and generative AI surfaces have introduced a new impression source that most vendor reports still ignore 7, 10. A report that lists rankings without segmenting branded versus non-branded queries, or that shows lab performance scores instead of field data, is answering a 2018 version of the question.
The rubric that follows applies to any SEO report already sitting in a VP's inbox.
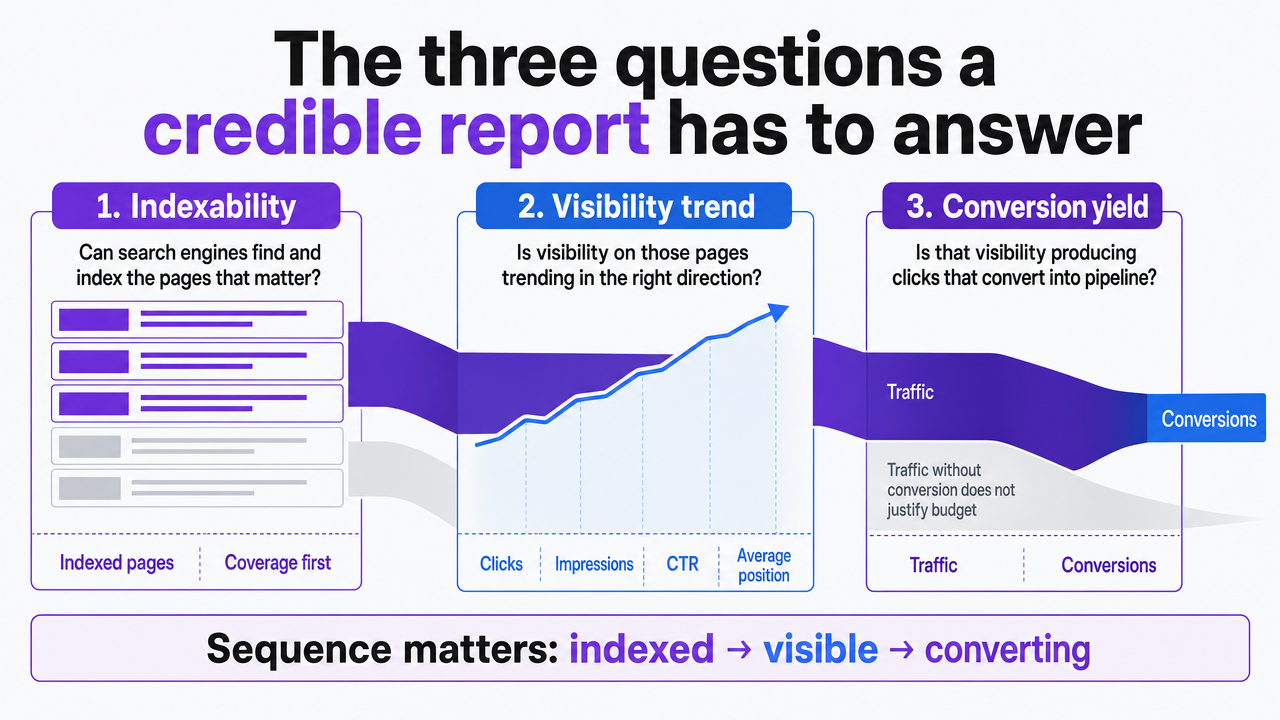 Visualize the three sequential diagnostic questions a credible SEO report must answer, mirroring the section's gating logic (indexability → visibility trend → conversion yield)
Findability: the layer most reports skip past
Index coverage, crawl status, and the manual actions blind spot
A page that Google cannot crawl or has chosen not to index produces zero impressions, zero clicks, and zero pipeline. That should be the first slide in any SEO report for a website, and in most vendor decks it isn't there at all.
The Search Console workflow Google publishes for site owners puts index coverage on equal footing with performance data, alongside manual actions, security issues, removals, and rich results status 1. Each of those is a binary risk indicator: either the site is clean, or a specific set of URLs is being suppressed for a specific reason. A monthly report should name the count of indexed URLs, the delta from the prior period, the top exclusion reasons (noindex, crawled but not indexed, discovered but not indexed, soft 404), and whether any manual action or security notice is active.
The manual actions blind spot is the one that ends careers. A partial match penalty on a subdirectory, or a structured data manual action on review markup, can suppress an entire product line's visibility without moving the aggregate traffic line enough to trigger an internal alarm. If the report cannot confirm zero manual actions this period, the report is not doing its job.
What Search Console actually surfaces (and what your vendor is filtering out)
Search Console exposes the raw signal set that any credible SEO report is built on: clicks, impressions, average CTR, and average position, broken down by query, page, country, device, search appearance, and date 1. The 24-hour view with hourly granularity now lets teams inspect fresh performance data across Search, Discover, and News, though Google flags that the most recent data may still be preliminary 2.
What vendors filter out tends to fall into three buckets:
- Anonymized queries — the ones Search Console hides for privacy reasons — often get quietly excluded from query tables, understating true impression volume.
- Discover and News impressions get lumped into a single organic number, which flatters flat weeks and hides shifts in surface mix.
- The Insights view, which reports trends against the prior period at the content level rather than the query level, is rarely included because it exposes which pages are actually earning attention versus which are just ranking 3.
Ask for the raw Search Console export alongside the summary. If a vendor cannot produce it, the report is a narrative, not a measurement.
Visibility: why rank is no longer diagnostic on its own
Clicks, impressions, CTR, position — read in that order
The order matters. A report that opens with average position and buries clicks in an appendix has inverted the diagnostic hierarchy. Clicks are the outcome the business cares about. Impressions size the opportunity. CTR reveals how efficiently that opportunity is being converted into traffic. Position is the last variable, useful only for explaining why the other three moved.
Search Console exposes all four in a single view, broken down by query, page, country, device, and date 1. The reason to read them in outcome-first order is that the same click number can mean two entirely different things depending on the underlying impression and CTR trend. Flat clicks with rising impressions and falling CTR signal a visibility problem inside a growing market. Flat clicks with falling impressions and stable CTR signal a demand problem no on-page fix will solve.
Peer-reviewed CTR benchmarks on Google organic data now estimate 9.28% at position 1, 5.82% at position 2, and 3.11% at position 3, with meaningful variance by device 11. A report that shows a page ranking third but pulling a 1.2% CTR is flagging something the position number alone would never surface — likely a SERP-feature compression the next section addresses directly.
SERP features and organic incrementality change what a rank means
Position two in 2018 and position two in 2026 are not the same real estate. Above that blue link may now sit an AI Overview, a featured snippet, a People Also Ask stack, a local pack, a video carousel, and a shopping unit. A cross-website study of 24 SERP features found they exert a strong influence on organic CTR, and on average that influence is negative — the same ranking earns fewer clicks when the SERP is dense 7, 12.
The behavioral shift shows up in adjacent research as well. Google's own analysis of organic and paid interaction found that 50% of ad clicks that occur alongside a top-ranked organic result are incremental, compared with 100% when no associated organic result appears on the page 9. The narrow finding is about ad incrementality, not organic CTR directly. The broader implication for reporting is what matters: SERP composition materially changes what users click, which means a rank number stripped of its SERP context is a partial reading.
A credible SEO report accounts for this in two ways:
- It annotates rank movements with SERP-feature presence at the query level, so a drop from position 2 to position 4 that coincides with an AI Overview appearing is labeled as such, not attributed to a content quality problem.
- It tracks the site's own capture of SERP features — featured snippets held, image pack presence, video results — as a separate visibility layer alongside classic rank.
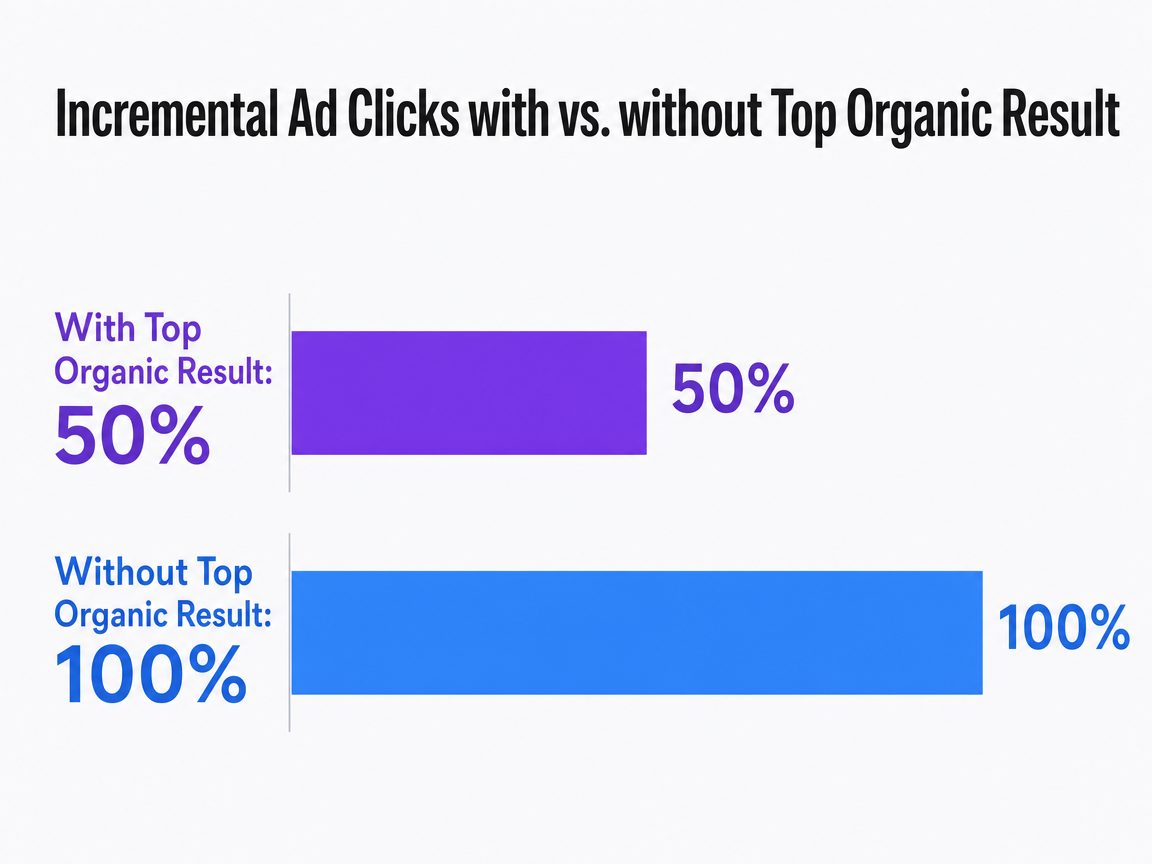 Incremental Ad Clicks with vs. without Top Organic Result
Compares the percentage of incremental ad clicks (clicks that would not have happened otherwise) when a brand's top-ranking organic result is present on the same SERP versus when it is not.
Branded vs. non-branded: the single most underused split in vendor reports
Aggregate organic traffic is the metric most vendors lead with and the metric most likely to mislead a board. Branded queries — searches that include the company name, a product name, or a location-specific brand phrase — reflect demand the SEO program did not create. Non-branded queries reflect the demand the program is actually generating. Reporting them as a single line masks whether the SEO investment is working or whether the marketing team's other channels are simply driving people to search for the brand by name.
Google added a native branded queries filter to the Search Console Performance report in late 2025, applying across all search types, and paired it with an Insights card showing branded versus non-branded click share 4. There is no longer a tooling excuse for omitting this segmentation. Any report that shows organic clicks as a single trend line, without a branded/non-branded breakout, is either being produced by someone who hasn't opened Search Console this quarter or is deliberately smoothing the numbers.
The operational reading is straightforward. Non-brand clicks are the pipeline-relevant number for evaluating SEO work. Brand clicks are useful as a demand-side indicator that tells the marketing team whether awareness efforts are producing search behavior. A report that trends both series side by side, with the ratio shown as a third line, exposes whether organic growth is coming from SEO output or from paid, PR, and product-led lift the SEO channel is quietly claiming credit for.
Device and query-context segmentation
Aggregate CTR hides the two variables that move it most: device and query intent. The device-dependent CTR study cited earlier found that click rates at the same position differ measurably between desktop and smartphone results, driven by differences in screen real estate, SERP layout, and user behavior 11. A report that shows one blended CTR number for a site whose traffic is 70% mobile is averaging two distinct performance curves into a single misleading figure.
Query context is the second cut. Informational queries, transactional queries, and navigational queries produce different CTR expectations at the same rank, and SERP feature density varies systematically across those intents. A useful report segments the top query set by intent — even a rough three-bucket classification is enough — so that a CTR drop on transactional queries is not diluted by stable performance on informational ones.
The minimum viable version of this cut is two tables: clicks, impressions, CTR, and position by device, and the same four metrics by query intent for the top 50 non-branded queries. Anything less blends signal into noise.
Test Full-Funnel SEO Reporting in Real Time
See live, actionable SEO insights and publish data-backed content with zero risk during your trial.
Page experience, measured honestly
Field data at the 75th percentile is the reporting standard
Page experience belongs in an SEO report, but it belongs there measured the way Google actually measures it. That means Core Web Vitals — Largest Contentful Paint, Interaction to Next Paint, and Cumulative Layout Shift — reported from field data, at the 75th percentile of page loads 5. Not the median, not a lab score from a synthetic run in a data center, not an average blended across all sessions.
The 75th-percentile threshold is the number to demand on any page-experience slide. It means three out of four real visits meet the target, which is the experience the majority of users actually receive on the majority of visits 5. Averages hide the tail. A page can post a respectable mean LCP while a quarter of mobile users on mid-tier Android devices wait past the four-second mark, and only percentile reporting surfaces that.
Field data comes from real users on real devices, real networks, and real geographies 6. A credible report names the sample source (Chrome UX Report, a site-owned RUM pipeline, or both), splits the three metrics by device, and shows the 75th-percentile value against the pass threshold for each. Anything reported as a single blended score across desktop and mobile is averaging two populations that behave nothing alike.
When lab scores in a slide deck mislead the executive team
Lab data has its place — regression testing, pre-launch checks, isolating a specific bottleneck under controlled conditions. It does not have a place as the headline metric in an executive SEO report. Lab tests run against a predefined device profile and network setting, which is why the same page can post a green Lighthouse score in a slide deck while its field 75th-percentile INP fails the threshold 6.
The divergence usually traces to three sources: real users on slower devices than the lab profile, third-party scripts that only fire under actual traffic conditions, and interaction patterns that synthetic tests do not simulate. A team-owned RUM pipeline that computes the metric in frontend JavaScript and sends it to an analytics backend closes that gap 8.
The operational rule is simple. If a vendor's page-experience section leads with Lighthouse scores or PageSpeed Insights lab results, ask for the field data next to it. If the two disagree, the field number is the one the CFO should see.
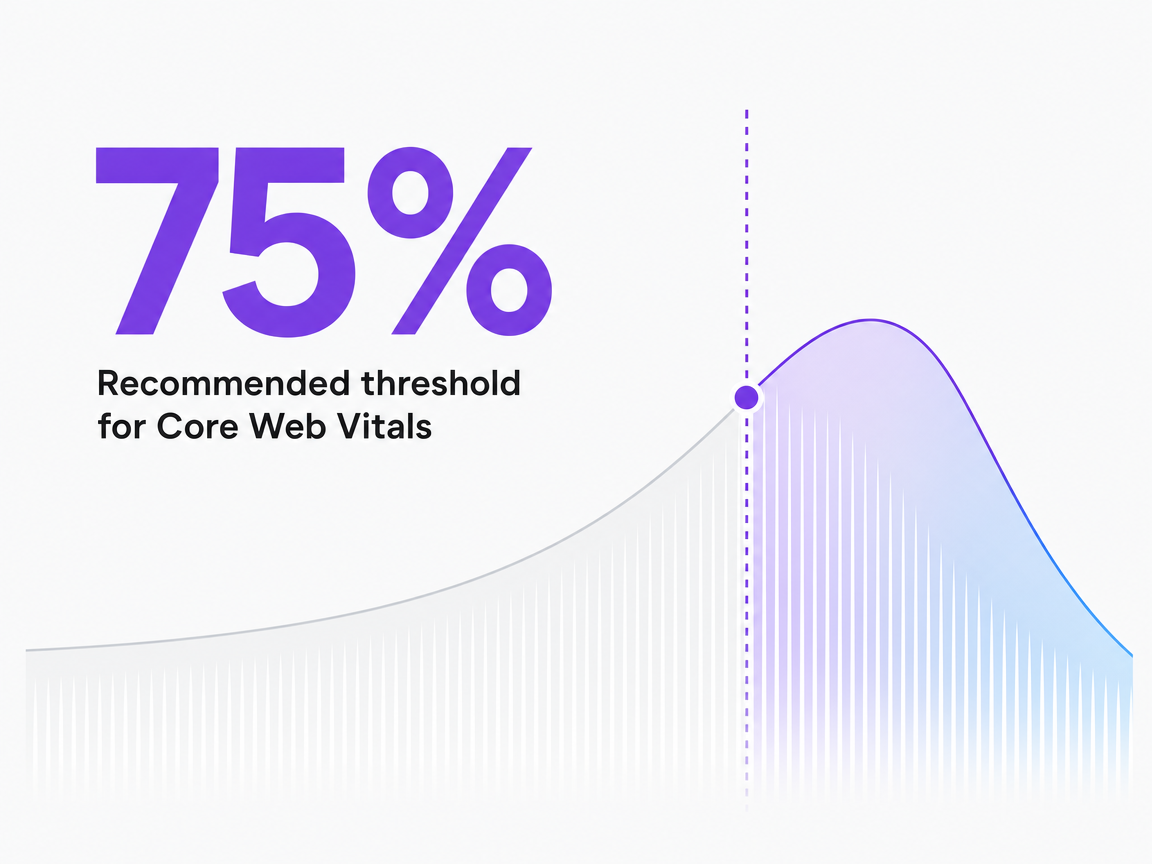 Recommended threshold for Core Web Vitals
Recommended threshold for Core Web Vitals
The generative AI surface most reports are missing
Most SEO reports produced today still treat the search results page as a list of blue links. That model is already outdated. Google rolled out Search Generative AI performance reports in Search Console in 2026, tracking impressions, pages, countries, devices, and dates for generative AI features across Search and Discover 10. If a vendor's report does not include a line for AI surface impressions, the report is missing a visibility layer that already exists in the underlying data.
The immediate reporting move is narrow. Pull the AI features breakout as its own trend, next to classic organic clicks and impressions, without blending them into the aggregate number. Blending hides two things: whether AI surfaces are cannibalizing clicks on queries the site used to win, and whether the site is being cited at all inside generative responses on queries it should be showing up for.
A working AI-surface section shows three cuts — impressions by page, impressions by device, and week-over-week trend against the prior period 10. Benchmarks for click yield on these surfaces do not yet exist at industry scale, so the honest read is directional. Treat this as a monitoring layer now, not a KPI, and revisit the benchmark question when Google publishes normalized CTR data for AI features.
Conversion yield: mapping non-brand clicks to booked pipeline
Visibility that does not convert is a slide, not a business case. The final layer of a credible SEO report for a website connects non-branded organic clicks to booked outcomes — leads, qualified calls, appointments, signed contracts — using whatever attribution surface the business already runs. A full multi-touch stack is not the prerequisite. A defensible pipeline column is.
The minimum version uses the branded-versus-non-branded split from the Performance report 4 as the traffic input, then joins non-brand clicks by landing page to the CRM or booking system's created-date records for the same period. Two columns are enough to defend the channel: non-brand clicks per page, and pipeline-eligible conversions attributed to those pages within the reporting window. A third column — cost per pipeline conversion, calculated against the SEO investment for that period — turns the report from a performance summary into a budget document.
Two guardrails matter:
- Exclude branded clicks from the numerator, since they measure demand the SEO program did not create 4.
- Name the attribution window and the conversion definition on the same page as the number. A 30-day last-non-direct model and a 90-day first-touch model will produce different pipeline figures from the same click set, and a report that hides which model is running is not a report a CFO can act on.
See How Leading Brands Structure Actionable SEO Reporting
Request a walkthrough of data-driven SEO reporting workflows that enable teams to surface real pipeline impact, connect organic initiatives to business KPIs, and streamline stakeholder approvals—without expanding your in-house resources.
If you manage multiple locations: consolidating reports across a portfolio
The rubric so far assumes one website and one report. Multi-location operators — law firm networks, DSOs, senior living portfolios, home services franchises, regional healthcare groups — face a different problem: ten, fifty, or two hundred reports arriving on different templates from different vendors, each with its own definition of an organic click.
The consolidation gap is where visibility gets lost. A portfolio-level view has to normalize four things across every location before any of it is comparable:
- Non-brand click share, using the Search Console branded filter 4.
- Device-split CTR against the site's own position mix, since a location ranking third on mobile is not producing the same yield as one ranking third on desktop 11.
- Field-measured Core Web Vitals at the 75th percentile per location 5.
- AI surface impressions as a separate line, now that Search Console exposes them 10.
| Portfolio input | Present in typical per-location report? |
|---|---|
| Branded vs. non-branded click split | Rarely |
| Device-segmented CTR by position | Rarely |
| Field CWV at 75th percentile | Sometimes (often lab scores instead) |
| AI surface impressions | Almost never |
| Non-brand clicks joined to booked pipeline | Almost never |
If a portfolio operator is paying $X per location per month across N locations and receiving N reports that share none of these columns, the aggregate spend is buying activity, not measurement. Consolidation is the reporting problem worth solving before adding another location.
A Monday-morning rubric for the report already on your desk
Open the most recent SEO report for a website sitting in the inbox and run it against seven checks. Each maps to a layer this article has already argued for, and each is a yes-or-no answer.
- Index coverage is on page one. Indexed URL count, delta, top exclusion reasons, and a zero-manual-actions confirmation appear before any performance chart 1.
- Clicks lead, position trails. The performance view reads clicks, impressions, CTR, position — in that order — with the raw Search Console export available on request 1, 2.
- Branded and non-branded are separate lines. Non-brand click trend is the pipeline-relevant series; brand clicks sit alongside as a demand indicator, not blended into aggregate organic 4.
- Rank movements are annotated with SERP context. Position changes on priority queries note AI Overview, featured snippet, or local pack presence rather than treating rank as a standalone metric 7, 12.
- Device and query intent are segmented. CTR and position appear split by desktop versus mobile, with the top non-branded query set bucketed by intent 11.
- Page experience is field data at the 75th percentile. LCP, INP, and CLS report from real users, not Lighthouse scores in a slide 5, 6.
- Non-brand clicks are joined to booked outcomes. A pipeline column names the attribution window and conversion definition on the same page as the number.
Fewer than five yeses means the report is measuring activity, not performance. That is the conversation to have with the vendor on Monday.
Frequently Asked Questions
References
- 1.How To Use Search Console.
- 2.An improved way to view your recent performance data in Search Console.
- 3.The new Search Console Insights report is here.
- 4.Introducing the branded queries filter in Search Console.
- 5.Web Vitals | Articles | web.dev.
- 6.Why lab and field data can be different (and what to do about it).
- 7.Exploring the Impact of SERP Features on Organic Click-through Rates.
- 8.Best practices for measuring Web Vitals in the field | Articles.
- 9.Impact Of Ranking Of Organic Search Results On The Incrementality Of Search Advertising.
- 10.Introducing Search Generative AI performance reports in Search Console.
- 11.Device-dependent click-through rate estimation in Google organic search results based on clicks and impressions data.
- 12.Beyond Rankings: Exploring the Impact of SERP Features on Organic Click-through Rates.