
Key Takeaways
- Treat the reporting-to-approval loop as the real product—retention and margin depend on how fast a client moves from seeing a number to signing off on the next action.
- Reject feature-checklist evaluations; coverage across on-page, off-page, technical, and local SEO 8is a floor every vendor clears, not a differentiator that predicts retention.
- Confirm the baseline KPI set—organic traffic, CTR, conversion rate, branded versus non-branded, and engagement 4—is native, then move the evaluation to narrative and workflow.
- Score vendors on what the client sees first: a curated eight-to-twelve KPI view aligned to business goals 8beats a 30-metric wall 10the AM has to hide.
- Test data trust directly by probing Search Console ingestion 1, branded-term classification logic, and GA4 reconciliation—unreconciled numbers collapse credibility by week three.
- Judge narrative generation against the work-done, context, traffic, next-targets template 9; a tool that drafts the paragraph absorbs the analyst hour the AM would spend Friday.
- Require built-in period-over-period deltas and benchmark commentary 7, plus recommendation routing that captures a pending-to-approved state inside the report itself.
- Model portfolio economics using hours per account per cycle multiplied by accounts per AM—tools that reduce assembly time on every cycle return more than tools that add metric panels.
The Reporting-to-Approval Loop Is the Real Product
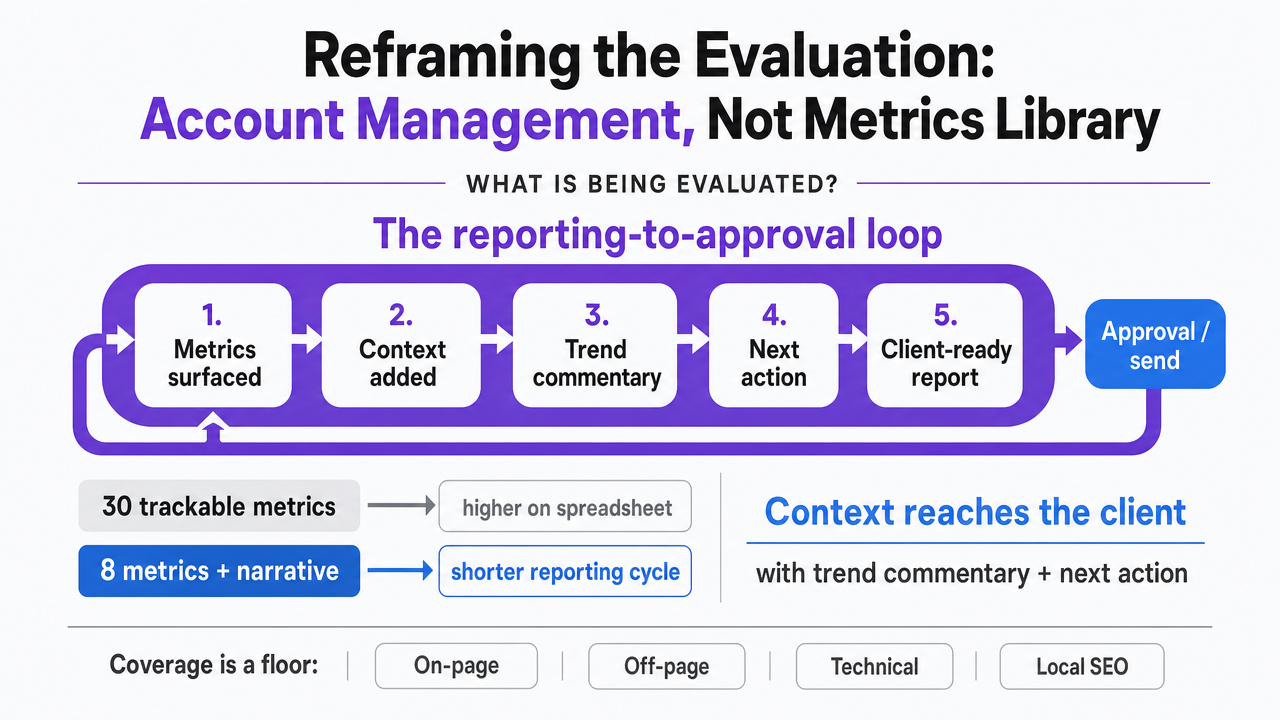
Most SEO reporting software is sold on the length of its metric library. Agency directors of client services buy it for a different reason: to shorten the distance between a client seeing a number and signing off on the next piece of work. That distance—call it the reporting-to-approval loop—is where retention, margin, and account-manager sanity actually live.
A dashboard that surfaces organic traffic, click-through rate, conversion rate, branded versus non-branded splits, and engagement 4is table-stakes. So is coverage across on-page, off-page, technical, and local SEO 8. What separates a reporting platform from a reporting exporter is whether the numbers arrive with enough context, narrative, and routing to move a client from "interesting" to "approved" without another 45-minute call. Reports that stop at visualization leave that translation work on the account manager's desk; the ones that generate actionable insight against benchmarks and historical trends 7absorb it.
The evaluation framework that follows treats KPI coverage as the entry ticket and spends the rest of the analysis on trust, narrative, workflow, and portfolio economics—the criteria that decide whether the next reporting cycle closes faster than the last one.
Reframing the Evaluation: Account Management, Not Metrics Library
Why Feature Checklists Mislead Client-Services Leaders
Vendor comparison grids reward the wrong behavior. A tool that lists 30 trackable metrics 10scores higher on a spreadsheet than one that surfaces eight and routes them into a client-ready narrative, even though the second tool is what shortens the reporting cycle. Directors who evaluate on feature counts end up with dashboards their account managers still rebuild into slides every Monday morning.
The checklist habit persists because it is defensible in procurement, not because it predicts retention. Coverage across on-page, off-page, technical, and local SEO 8is a floor, not a differentiator—every serious vendor clears it. What separates platforms is whether the report reaches the client with context, trend commentary, and a next-action recommendation already attached 7, or whether it arrives as a PDF the AM has to translate into English before the QBR.
Evaluators who read demos for workflow signals—how a recommendation gets from the dashboard to the client's inbox to an approved brief—learn more in fifteen minutes than a 40-row feature matrix ever reveals.
The Director-Level Economics Behind Every Reporting Cycle
The economics that matter to a client-services director are hours per account per reporting cycle, retention risk on the accounts those hours support, and gross margin on the book of business those account managers carry. Metric counts do not appear on that ledger. Time-to-approved-next-action does.
Consider the mechanics of a monthly reporting cycle on a mid-market SEO retainer. An account manager pulls organic traffic, CTR, conversion rate, branded versus non-branded splits, and engagement data 4, reconciles it against Search Console 1, writes context around any Google update or ranking shift 9, drafts a narrative, and books a review call. If the reporting tool absorbs the assembly, reconciliation, and narrative drafting, the AM's cycle time collapses. If it only visualizes the numbers, the AM absorbs the delta—usually on Friday afternoon, usually at overtime.
Evaluators who model this cost per cycle per account, then multiply by portfolio size, discover that a marginally better dashboard rarely pays back. A platform that removes an entire assembly step from every AM's week does.
 Visualize the reporting-to-approval loop as a workflow stages diagram, reinforcing the core framing that the loop—not the metrics library—is the product being evaluated
KPI Coverage Is Table Stakes, Not a Differentiator
The Baseline Client-Facing KPI Set the Tool Must Clear
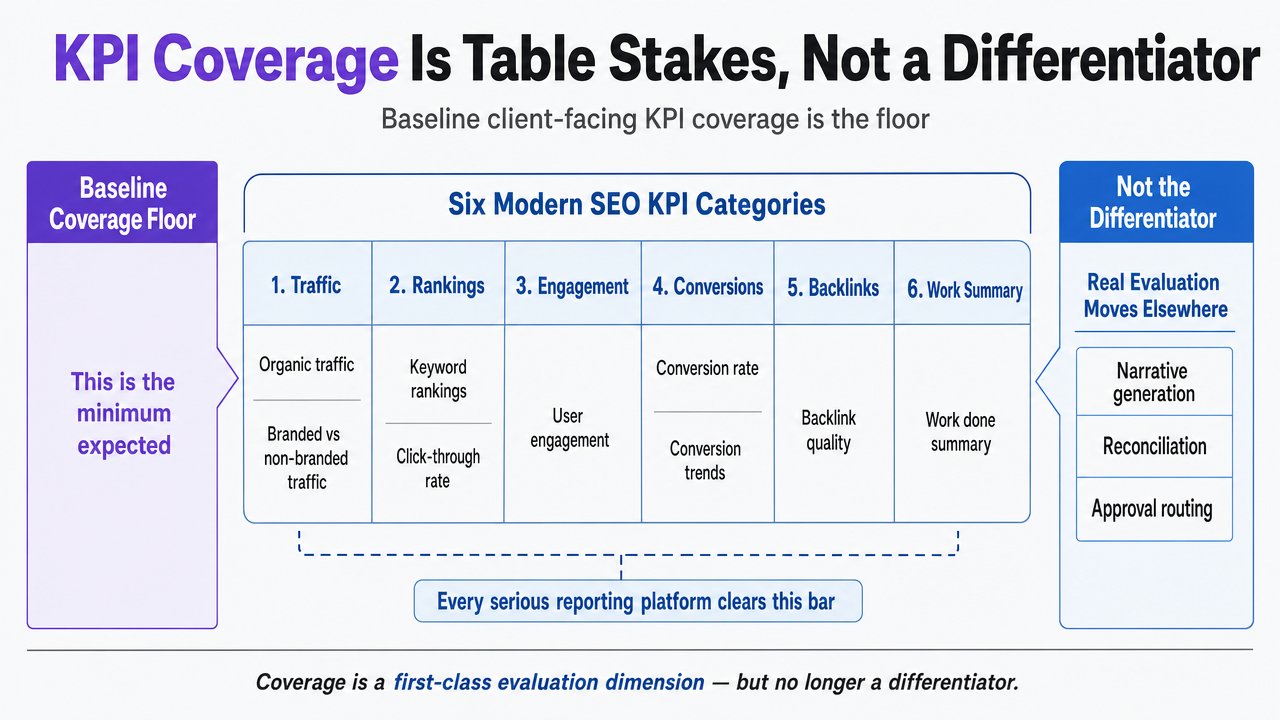
Before any workflow claim gets tested, the tool has to prove it can display the KPIs a client actually reads in a monthly review. That shortlist is well-established: organic traffic, click-through rate, conversion rate, branded versus non-branded traffic, and user engagement 4. Add keyword rankings, backlink quality, and conversion trends alongside a summary of work done 9, and the coverage floor is set.
Every serious reporting platform clears this bar. That is precisely why coverage cannot be the differentiator. When a vendor's demo leans hard on "we track all the KPIs that matter," the evaluator has learned nothing about how the tool performs on the criteria that actually change AM economics—narrative generation, reconciliation, and approval routing.
The useful test at this stage is negative: does the platform miss anything on the baseline list, and does it force the account manager to stitch two systems together to complete a client-ready view? If the answer to either is yes, the tool fails at table stakes. If the answer is no, the evaluation moves on. Coverage confirms the vendor is in the category. It does not confirm the vendor is worth the switch.
Modern KPI Categories: Business Impact and Competitive Visibility
Coverage is not just about which individual metrics appear. It is about which categories of metric the tool treats as first-class citizens. Modern SEO reporting organizes KPIs into six working categories: engagement, SERP visibility, business impact, brand loyalty, technical health, and competitive visibility 5. A platform that surfaces impressions and average position but buries conversion trends and share-of-voice against named competitors is still living in the vanity era, even if its metric count is high.
The distinction matters in a QBR. A client-services director sitting across from a CMO does not win the room with a ranking screenshot. The room shifts when the report ties SERP presence to conversion trends and to competitive movement in the same category 5. Business-impact and competitive-visibility categories are what let the account manager answer the question the client actually asks: is the retainer producing revenue, and is the account gaining or losing ground against the two competitors the CMO watches?
Evaluators should ask each vendor to open a live client report and point to where each of the six categories lives. Categories that require a custom-built widget to appear are not really supported—they are available.
Emerging Signals: LLM Referral Traffic and AI Overview Rankings
Two signals sit outside the traditional KPI stack and are starting to appear on enterprise dashboard specifications: LLM referral traffic tracked over time, and keyword rankings for AI Overview surfaces 6. Neither is a proven standard. Both are described as emerging inclusions in dashboards adapting to generative search 6, not as metrics with settled measurement conventions.
For an evaluation rubric, that ambiguity is the useful part. A vendor that already exposes an LLM-referral view and an AI Overview ranking module—even in beta—signals that the roadmap is tracking where client questions are heading. A vendor that dismisses the category signals the opposite. Client-services directors will field the "are we showing up in ChatGPT?" question in a QBR before the measurement standards settle, and the reporting tool needs to give the AM something concrete to point at.
The evaluation weight here should be modest, not decisive. Emerging signals are a tiebreaker between platforms that pass every other criterion, not a reason to abandon a tool that handles the six established categories well.
 Show the six modern SEO KPI categories cited from ref_5 as a framework diagram, directly supporting the section's argument about category coverage as a first-class evaluation dimension
The Overload Trap: Curated Dashboards vs. Exhaustive Metric Walls
There is a specific failure mode that shows up in agency portfolios once a reporting tool has been in place for a few quarters: the dashboard keeps growing. Every new account manager adds a widget. Every client question spawns a permanent panel. What started as a client-facing report becomes a metric wall, and the AM ends up narrating a scroll instead of a story.
The research on dashboard design points the opposite direction. Guidance for SEO dashboards explicitly cautions against tracking too many metrics or vanity indicators and urges customization to the client's business goals, with holistic but disciplined coverage across on-page, off-page, technical, and local SEO 8. Set that against catalogues that enumerate 30 must-have metrics—organic traffic, mobile traffic, indexed pages, keyword rankings, and twenty-six more 10—and the tension becomes concrete. Both views can be defended in isolation. Only one survives contact with a client who has 25 minutes on a Tuesday.
Evaluators should treat this as a design question about the tool itself, not just a template decision. Does the platform default to a curated view of roughly eight to twelve KPIs aligned to the client's business objectives 8, or does it default to exposing every available signal and rely on the account manager to hide the noise? Tools that default to exhaustive dashboards push curation cost onto the AM every time a new account onboards. Tools that default to curated views, with the 30-metric library available on demand for the technical audit, keep the client report legible.
The operational takeaway is simple: score each vendor on what the client sees first, not what the vendor can theoretically display. A short, goal-aligned dashboard with the deeper metric library one click away is the shape that holds up in a QBR.
Experience Automated Client Reporting in Real Time
Generate and share live SEO reports for clients using your own data—risk-free during your trial period.
Data Trust: Where Reporting Software Quietly Breaks
Multi-Source Ingestion and Search Console Reliability
The dashboard that looked clean in the demo starts leaking credibility around week three. An organic traffic line that disagrees with the client's GA4 view by fifteen percent, a Search Console impression count that drifted overnight, a backlink panel that hasn't refreshed since the last billing cycle—each is small in isolation, and each erodes the account manager's ability to defend the number in the QBR.
Search Console is the anchor. Google's own guidance treats it as the primary surface for monitoring how a site performs in Search 1, which means any client reporting tool that cannot ingest it reliably is not really reporting on SEO. Evaluators should test refresh cadence, historical backfill depth, and whether the platform reconciles Search Console impressions and clicks against the site analytics view, or lets the two drift into two different stories. Multi-source ingestion across analytics, Search Console, rank tracking, and backlink data is the baseline 7—but ingestion is not the same as reconciliation, and only reconciled data survives a client asking why two of the tool's own charts disagree.
Branded vs. Non-Branded Splits and GA4 Reconciliation
The branded versus non-branded split is where most reporting tools quietly fail the QBR test. It is a KPI every serious guide names as essential 4, and it is also the one number an account manager cannot fake in front of a CMO who reads the report closely. If the split relies on Search Console query data with (not provided) gaps, and the tool does not disclose how it classifies branded terms, the resulting percentage is a guess dressed as a metric.
GA4 reconciliation compounds the problem. Session definitions, channel groupings, and conversion attribution have all shifted, and reporting platforms that pipe GA4 data straight through without a documented mapping produce conversion trends 9that the client's internal analyst will contest inside a week. Evaluators should ask each vendor two direct questions: which branded-term list drives the split, and how does the tool reconcile GA4 session counts against its own traffic panel. Vendors that answer clearly pass. Vendors that gesture at machine learning fail.
Narrative-Ready Reports: The Analyst Time the Tool Should Absorb
The single largest hidden cost in a client-services P&L is the analyst hour spent turning a dashboard into a story. Screenshots get pasted into slides. Traffic dips get annotated by hand with the Google update from three weeks earlier. A conversion trend gets contextualized against last quarter because the tool showed the number but not the movement. That translation work is what a narrative-ready report is supposed to absorb, and it is the criterion most vendors quietly fail.
The structural template is well-defined. A client-ready SEO report opens with an overview of work done, strategy, and context—including recent Google updates—then moves through key traffic perspectives and closes with future targets and expectations 9. A platform that auto-generates this scaffolding, populated with the client's actual data and the account manager's month, saves an assembly step per account per cycle. A platform that outputs a data view and leaves the narrative shell blank does not.
The deeper test is trend and benchmark commentary. A great report does not just present data; it provides actionable insight, compares KPIs against historical performance, and flags what changed 7. Evaluators should open a sample export and read it as a client would. If the report says organic traffic rose eleven percent, the tool has visualized. If the report says organic traffic rose eleven percent driven by non-branded gains on three priority clusters after the technical fix shipped in week two, the tool has written the paragraph the AM would have written on Friday afternoon. That difference, multiplied across a portfolio, is the analyst headcount the platform either returns or consumes.
From Insight to Approved Next Action: Workflow Criteria That Matter
Trend Analysis and Benchmarking Built Into the Report
A visualization is not an insight. The distinction becomes obvious in the QBR the Monday after a Google update, when a client points at a traffic dip and the account manager has to explain what caused it without a laptop full of open tabs. Reporting platforms that flag the movement, compare it against the trailing quarter, and note the ranking clusters most affected turn that moment into a two-minute answer. Reporting platforms that show only the current month leave the AM improvising.
The standard is well-articulated: a report should not just present data, it should provide actionable insight by comparing KPIs against historical performance and relevant benchmarks 7. In practical evaluation, that means opening the tool's default view for an existing account and looking for three things:
- Automatic period-over-period deltas on the baseline KPI set
- Annotated trend commentary tied to the metrics that moved
- A benchmark reference the client can interpret without a decoder ring
Tools that ship these built into the report absorb hours of AM prep. Tools that require the AM to configure each trend widget push the work back onto the Friday queue.
Recommendation Routing and Approval States
The reporting cycle only closes when the next piece of work is approved. That is the criterion most reporting platforms ignore entirely. A dashboard surfaces a conversion trend, an AM drafts a recommendation in a separate document, the client approves it over email, and someone re-enters the brief into a production system. Four systems, four handoffs, and a week lost between the insight and the ticket.
The evaluation question is whether the platform can move a recommendation from a data view into a routed, tracked, approval-state artifact. Concretely: does the tool let an account manager attach a proposed next action to the trend it responds to, present that recommendation to the client inside the same report the client is already reading, and capture a pending-to-approved state that a production team can pick up without a re-brief? Client reports that close with future targets and expectations 9are the natural home for this routing—the section already exists in the template.
Platforms that treat approval as a first-class object shorten the reporting-to-approval loop. Platforms that stop at the chart make the AM the loop.
See How Leading Agencies Streamline SEO Reporting With Centralized Automation
Request a walkthrough of unified dashboards and automated client-ready SEO reporting workflows proven to reduce manual status updates and increase transparency across multi-channel campaigns.
If the Agency Manages a Portfolio: Consolidation Economics
The evaluation shifts once the buyer is not a single account but a book of them. A client-services director running 40 or 80 retainers is not optimizing for the best individual report—they are optimizing for the shape of the AM's week across the portfolio. That is a different math problem, and it is the one most vendor demos fail to answer.
The variables that matter are hours per account per reporting cycle (H_a), accounts per account manager (N), and the AM's fully-loaded hourly cost (H). Multiply across the portfolio and small deltas in H_a compound quickly. A tool that shaves an hour off assembly for every account, every cycle, returns N × H hours per AM per month—before any effect on retention or upsell velocity from a faster reporting-to-approval loop.
The table below models three states an evaluator can actually observe in a trial. Figures are illustrative operator variables, not vendor benchmarks.
| Reporting state | Hours per account per cycle (H_a) | Monthly AM cost per account | Portfolio cost per AM (N accounts) ||---|---|---|---|| Manual assembly across analytics, Search Console 1, rank tools | H_a = high | H_a × H | N × H_a × H || Dashboard-only tooling with curated KPI view 8| H_a = medium | H_a × H | N × H_a × H || Orchestration with narrative generation and approval routing 7| H_a = low | H_a × H | N × H_a × H |
The useful evaluation question is not which row is cheapest in isolation—it is which row lets an AM carry more accounts at the current service standard without the Friday queue slipping into Saturday. Portfolio economics reward tools that reduce H_a on every cycle, not tools that add a new metric panel every quarter.
A Working Evaluation Rubric for the Next Vendor Demo
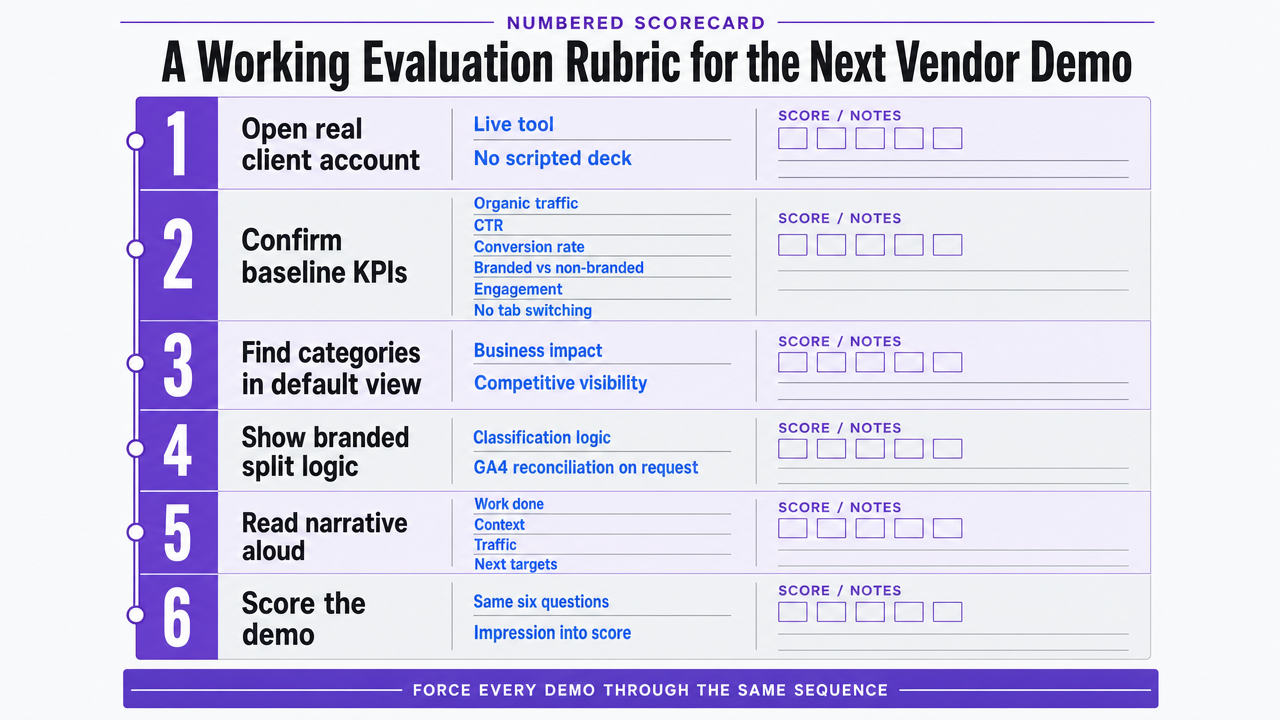
The demo is where evaluations get sloppy. Vendors control the narrative, the sample account looks pristine, and the director walks away with an impression instead of a score. A working rubric fixes that by forcing every demo down the same six questions, in order, with the tool driven live rather than by a scripted deck.
- Open a real client account and confirm coverage of the baseline KPI set—organic traffic, CTR, conversion rate, branded versus non-branded, and engagement 4—without switching tabs.
- Point to where business-impact and competitive-visibility categories live in the default view 5.
- Display the branded split's classification logic and the GA4 reconciliation method on request.
- Read the auto-generated narrative aloud against the work-done, context, traffic, next-targets template 9and judge whether an AM would ship it.
- Show period-over-period deltas and benchmark commentary built into the report 7, not configured after the fact.
- Move a recommendation from a chart into an approval-state artifact the client can sign off inside the report.
A vendor that clears six passes advances. Five or fewer means the AM absorbs the gap.
 Turn the six-question demo rubric into a numbered scorecard infographic, giving readers a takeable checklist that mirrors the article's prescriptive evaluation sequence
Where the Category Is Heading: Approval-First Orchestration
Reporting-only dashboards solved the visualization problem a decade ago. The problem that remains—the one that shows up in every AM's Friday queue—is orchestration. A number gets seen, a recommendation gets drafted, an approval gets chased, a brief gets re-entered into a production system, and the cycle repeats next month with the same friction. The category is moving toward tools that treat the report as the entry point to a governed approval workflow, not the endpoint.
The signals are already in the research. Enterprise dashboards are expanding to include LLM referral traffic and AI Overview rankings 6, multi-channel data ingestion with actionable insight against benchmarks is the stated standard 7, and client reports are expected to close with future targets and expectations 9—the natural handoff to approval. Platforms like Vectoron's Command Center sit at this next layer, routing strategist recommendations from the report into a pending-to-approved state before execution. Directors evaluating tools this quarter should weight orchestration capability accordingly.
Frequently Asked Questions
References
- 1.Search Engine Optimization (SEO) Starter Guide.
- 2.10 Marketing Analytics Dashboard in 2024: Track Key Metrics for ....
- 3.The Ultimate Guide to KPIs and Metrics in SEO.
- 4.The Ultimate Guide to SEO KPIs: 12 Metrics to Measure Success.
- 5.SEO Metrics That Matter: Outdated vs. Modern SEO KPIs.
- 6.The Smart Marketer's Guide to Enterprise SEO Dashboards.
- 7.How to Build the Best Digital Marketing Report for Your Business.
- 8.What to Include in an SEO Dashboard: Examples & KPIs.
- 9.How to Create BEST Client SEO Report for Win Them Over.
- 10.Top 30 Must-Have Metrics in Your SEO Dashboard for Maximum Impact.