
Key Takeaways
- The $2,917 market average 8hides a bifurcated market — 64% of agencies charge under $1,000 while strategy-led providers exceed $10,000 7, making the mean a poor budgeting anchor.
- A $5,000 retainer at 50% gross margin 3funds roughly 20–35 mixed-seniority hours monthly, so pricing conversations belong in hours and seniority, not deliverable counts.
- Each pricing model transfers different risk: hourly punishes provider efficiency, fixed-fee projects suit bounded scopes, retainers risk drift, and value-based pricing rarely holds because SEO attribution is too diffuse 2.
- Growth teams should stop comparing retainer quotes against each other and benchmark them against a production-model baseline that prices the ranked asset rather than the labor hour.
The $2,917 Question Growth Leaders Are Asking Wrong
$2,917 is the average monthly SEO spend across 439 polled providers in Ahrefs' 2025 pricing survey 8. It is also a number that tells a SaaS Head of Growth almost nothing useful about what to budget, what to expect, or whether the current line item is calibrated to pipeline.
The average hides the dispersion. SE Ranking's 2025 survey of 260 agencies found 64% charging under $1,000 per month, while Ahrefs recorded providers above $10,000 7, 8. A market average computed across a commodity tier and a strategy-led tier is an arithmetic artifact, not a benchmark.
The more productive question is structural. What production model delivers the lowest fully-loaded cost per ranked, converting asset at the revenue stage a company actually occupies? That reframes pricing from a retainer comparison into a unit-economics question, and it changes which providers belong on the shortlist.
What follows maps the 2025 pricing market, deconstructs what a mid-market retainer actually buys, weighs the four pricing models against the risk each transfers, and sizes SEO spend against ARR, CAC, and payback benchmarks that matter to a growth-stage P&L.
Mapping the 2025 SEO Pricing Market
Where the Market Actually Clusters
The SEO pricing market is not a normal distribution. It is two markets stacked on top of each other and sold under the same label.
SE Ranking's 2025 agency survey, covering 260 providers, found that 64% charge under $1,000 per month, with the most common retainer band sitting at $500–$1,000 7. Ahrefs' parallel poll of 439 SEO professionals put the overall average at $2,917 per month, with agencies averaging $3,209 and freelancers $1,348 — a roughly 138% premium for agency delivery 8. Two surveys, two methodologies, one consistent shape: a dense commodity tier crowding the bottom, a thinner strategic tier above it, and a long right tail of providers charging over $10,000 8.
The implication for a growth-stage SaaS buyer is that the published average is a poor budgeting anchor. A retainer drawn from the sub-$1,000 cluster is funding task execution — content briefs delivered, audits run, reports compiled — at a labor cost that cannot support senior strategic input on a sustained basis. A retainer at or above the agency mean is funding something structurally different: dedicated strategist hours, technical specialists, and link acquisition capacity. Treating these as comparable line items because they share a category name is the most common pricing error a Head of Growth makes during vendor reviews.
The split also explains why provider proposals at $800 and $4,500 can describe nearly identical deliverable lists. The deliverables are not the product. The seniority and time allocation behind them are.
Tiered Retainers by Buyer Segment
Once the bifurcation is acknowledged, the next useful cut is by buyer segment. SPP's 2025 compilation of agency retainer benchmarks puts local SEO at $1,500–$3,500 per month, small business SEO at $2,500–$5,000, mid-market SEO at $4,000–$8,000, and enterprise SEO at $7,500–$15,000+ 10. The market average of $2,917 8lands inside the small business band and below the mid-market floor — a useful tell that the published mean is being pulled down by volume in lower tiers rather than reflecting where strategy-led work actually prices.
For a Series A through growth-stage SaaS company, the relevant band is mid-market, not small business. The buyer profile that fits — multiple product lines or pricing pages, an existing content library, technical SEO debt accumulating from rapid shipping, and competitive keyword sets contested by funded rivals — does not get served by a $2,500 retainer. The labor required to move rankings against funded competitors in B2B SaaS verticals exceeds what that price supports.
The $4,000–$8,000 mid-market band is also where the pricing model itself starts to matter more than the dollar figure. A retainer at $6,000 with four senior strategist hours and 20 production hours is a different product from a $6,000 retainer with two strategist hours and 35 junior production hours. The segment label is the starting point, not the answer.
The Direction of Spend in 2025
Direction matters as much as level. GoodFirms' 2025 survey of 150 companies found that 57% plan to increase SEO budgets by 10–20% this year, with another 8.2% planning increases above 20% 9. That is not a market signaling commodity pressure on price. It is a market signaling that buyers expect more output, more strategic depth, or both, and are budgeting accordingly.
The pressure cuts in two directions at once. Insight Partners' SaaS budget analysis describes growth teams tightening overall spend, scrutinizing CAC, and eliminating waste while continuing to fund efficient channels 11. Higher SEO budgets inside flat or contracting marketing budgets means SEO is winning share from other line items — typically paid acquisition — because its payback profile holds up under CFO review.
The practical read for a Head of Growth: the question in 2025 is not whether to spend more on SEO. The question is whether the incremental dollar funds more retainer hours or a different production model entirely.
What a $5,000 Retainer Actually Buys
The Agency Margin Formula, Reverse-Engineered
Promethean Research's retainer pricing framework gives the cleanest lens for deconstructing a mid-market SEO fee. The formula is direct: Retainer Price = Team Cost ÷ (1 − Desired Margin), with average gross margins across digital agencies running 25–65% depending on utilization 3.
Run a $5,000 retainer through both ends of that range. At a 50% gross margin — a defensible midpoint for an agency with healthy utilization — the implied team cost is $2,500 per month. At a 35% margin, closer to lower-utilization shops, team cost rises to $3,250. At a 60% margin, the cost compresses to $2,000. Those are the labor dollars actually available to deliver the work, before account management overhead, software licenses, and unbilled coordination time get subtracted from the deliverable pool.
Translate $2,500 in monthly labor into staffing. A senior SEO strategist in North America typically loads in at $80–$150 per fully-burdened hour; a mid-level content producer at $45–$75. A $2,500 labor envelope buys somewhere between 20 and 35 hours of mixed-seniority work per month — a number that has to cover strategy, briefs, production review, technical audits, reporting, and client meetings. The strategist hours inside that envelope are usually fewer than ten.
The point is not that agencies overcharge. A 50% gross margin is unremarkable for a professional services firm carrying real overhead 3. The point is that a $5,000 retainer is, structurally, a 20–35 hour-per-month engagement once margin is removed. Pricing conversations conducted in deliverable language obscure that math; pricing conversations conducted in hours surface it immediately.
Coordination Overhead vs. Output
Inside the labor envelope, not every hour produces a billable artifact. Status calls, internal handoffs, brief revisions, QA loops, and account management eat a share that rarely appears on a scope of work. For a 25-hour monthly engagement, even a conservative 20% coordination tax — five hours — leaves 20 hours for actual production and strategy.
This is where the second pricing tension lives. A growth team paying $5,000 per month is funding roughly 20 hours of net output, of which the senior strategic share is the smaller portion. That ratio is fine when the work is genuinely strategic and the deliverables compound: a quarterly content roadmap, three well-researched long-form pieces, technical fixes prioritized against organic revenue. It is poorly calibrated when the same 20 hours are spread across a dozen tactical deliverables that each require briefing, review, and revision cycles.
AI-augmented production models change the ratio rather than the price. When briefing, drafting, and first-pass editing are absorbed by software, the human hours inside a retainer shift toward strategy, review, and judgment calls. The fully-loaded cost per published asset falls, and the coordination tax — the share of every hour spent on handoffs rather than output — becomes the line item under the most pressure.
Test AI-driven SEO production workflows risk-free
Experience real-time SEO execution and publish live campaigns before making a commitment.
Four Pricing Models, Four Risk Transfers
Hourly Billing and the Incentive Problem
Hourly rates for SEO cluster between $50–$100 in SE Ranking's 2025 agency survey and $100–$150 in Ahrefs' broader poll, with consultants reaching $100–$350 per hour at the top of the market 7, 8, 1. The spread is wide because the unit being sold — an hour — is the wrong unit for the work being delivered.
Hourly billing transfers efficiency risk to the buyer. Faster execution shrinks the invoice; slower execution grows it. Productive.io's pricing-model analysis flags this directly: hourly structures cap revenue at available hours and misalign incentives when outcomes, not effort, define value 2. For a growth team measuring cost per ranked asset, hourly is the model that punishes the provider for getting better at the work.
It survives in two scenarios: short diagnostic engagements where scope is genuinely unknown, and senior advisory time where the buyer wants access, not output.
Project Fees: When Scope Is Real
Project pricing concentrates at $500–$2,000 in SE Ranking's data and $1,000–$5,000 in GoodFirms', with discrete engagements like technical audits, migration support, or one-time content builds anchoring the higher end 7, 9. Fixed fees transfer execution risk to the provider: if the audit takes 40 hours instead of 25, the provider absorbs the gap.
This model prices fairly when the deliverable is bounded and the outcome can be specified before work begins. A site migration, a programmatic landing page template, a competitor gap analysis — each has a definable end state. The model breaks when buyers try to wedge ongoing SEO work into a project frame, which produces underscoped fixed fees that decay into uncompensated revisions.
Retainers: Predictability or Drift
Retainers dominate the market. Ahrefs found 78.2% of providers use monthly recurring agreements as their primary pricing structure 8. ConsultFees frames the appeal cleanly: recurring fees buy ongoing access, defined deliverables, and predictable cash flow on both sides of the table 4.
The model transfers continuity risk to the buyer. The provider receives stable revenue regardless of which month produces compounding rankings and which month produces report-shaped activity. That trade is rational when the work genuinely compounds — content libraries deepen, technical fixes accumulate, link profiles strengthen — and irrational when the retainer becomes a coordination subscription with deliverables drifting toward the easy and away from the strategic.
ConsultFees names the recurring client concern directly: paying for access versus clearly defined outputs, especially when attribution is loose 4. The diagnostic is whether deliverable volume and seniority hold steady across quarters, or whether the same fee buys progressively less as account-management overhead expands.
Value-Based Pricing: Why It Rarely Holds
Value-based pricing ties fees to outcomes — revenue lifted, leads generated, rankings achieved — and Productive.io notes growing interest in models that align provider compensation with client results rather than time spent 2. The structure transfers outcome risk to the provider, which sounds like the cleanest deal on offer.
It rarely holds in SEO contracts. Attribution is the binding constraint: organic traffic that converts six months after a content investment depends on technical state, brand authority, competitor moves, and algorithm shifts that no single provider controls. Providers willing to price purely on outcomes typically reserve the model for narrow scopes — a specific keyword cluster, a defined conversion event — and stack a baseline retainer underneath to cover production costs.
Where it does work, it pairs with a transparent production model that can sustain output even when outcome timing slips.
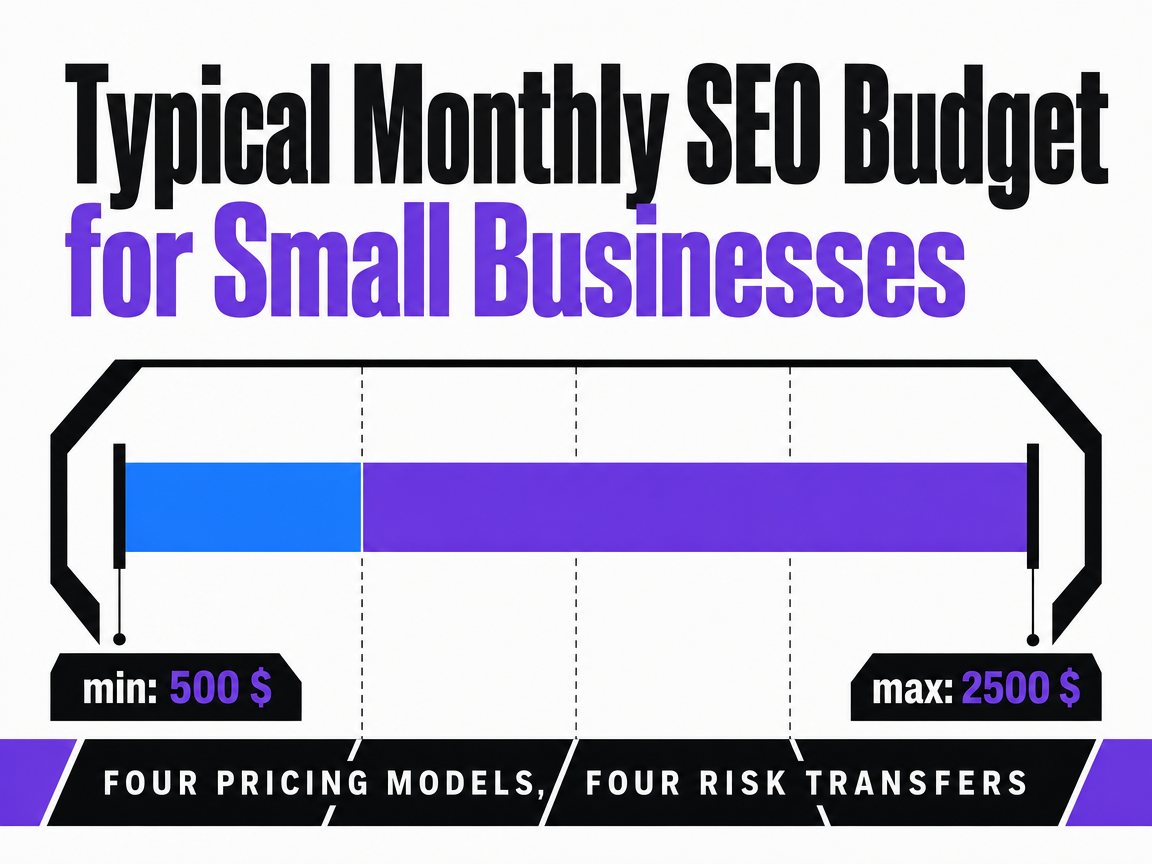 Typical Monthly SEO Budget for Small Businesses
From a synthesis of 2025 agency surveys, this range is suggested for small businesses, with the most popular band being $500-$1,000.
Sizing SEO Against ARR, CAC, and Payback
The 8% Baseline and the 10–20% Growth Premium
SimpleTiger's 2025 SaaS marketing benchmarks put median marketing spend at roughly 8% of ARR, with high-growth, VC-backed companies routinely investing 10–20%+ 5. SEO is a sub-allocation inside that envelope, not a separate budget category — which means SEO pricing decisions are bounded by the marketing percentage a finance team will defend at the next board review.
Run the arithmetic at three revenue points. A $2M ARR SaaS at 8% has a $160,000 annual marketing budget, or about $13,300 per month across all channels — paid, content, events, tooling, and headcount. A mid-market SEO retainer at the $4,000–$8,000 band 10consumes 30–60% of that monthly envelope, which is structurally untenable. At $10M ARR and 12% spend, the monthly envelope is $100,000, and the same retainer occupies 4–8%. At $25M ARR with high-growth spend at 15%, monthly marketing runs $312,500, and SEO at mid-market pricing falls below 3%.
The retainer that looks expensive at Series A is a rounding error at Series B. The pricing model question — retainer hours versus production-model output — sharpens at the revenue stage where SEO must compete for share against paid acquisition that can be turned down next quarter and demand-gen headcount that cannot.
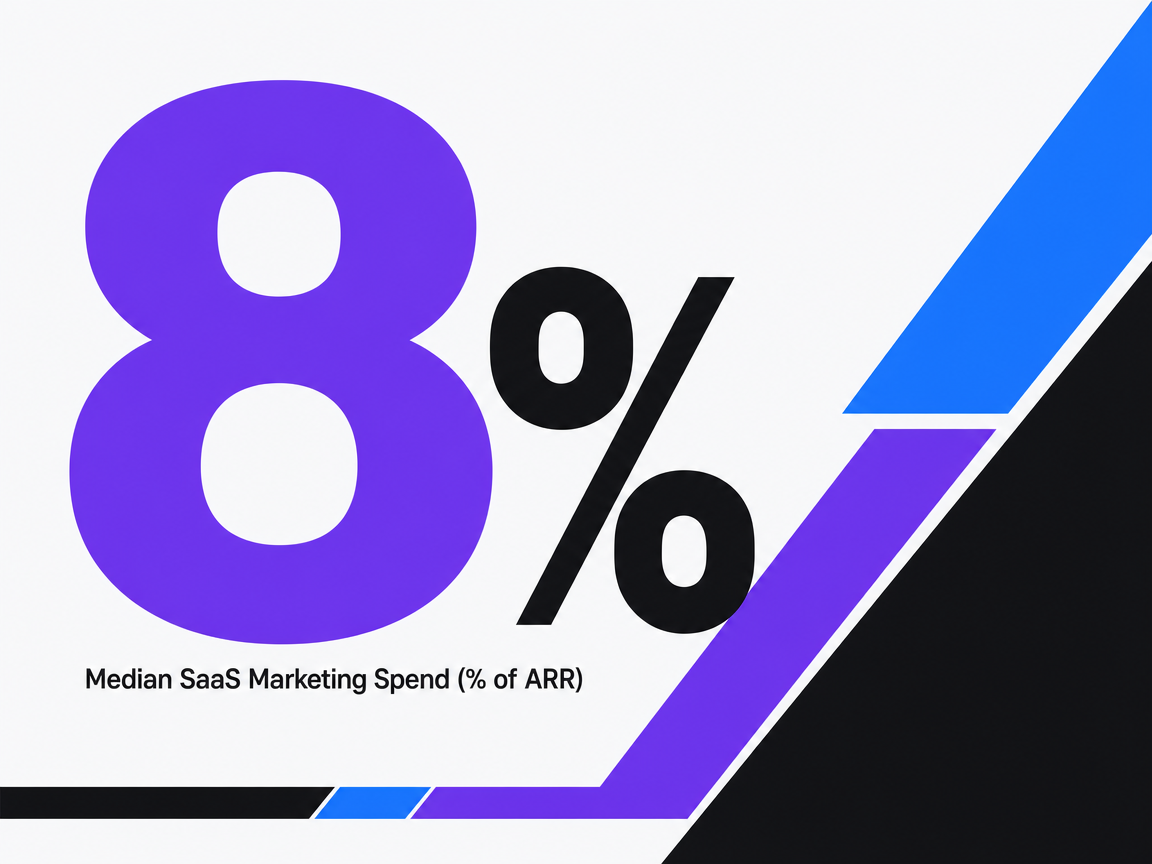 Median SaaS Marketing Spend (% of ARR)
Median SaaS Marketing Spend (% of ARR)
The 702% ROI Figure — and Its Real Scope
Oliver Munro's SaaS benchmark compilation reports an average 702% ROI from SEO for B2B SaaS companies, with break-even around seven months 6. The figure does heavy rhetorical work in vendor decks, and it deserves to be read with its scope attached.
It is a benchmark compilation, not a controlled study. The 702% number aggregates self-reported outcomes from programs that survived long enough to be measured, which selects for SEO investments that worked. Attribution is the second caveat: organic conversions credited to SEO frequently overlap with brand search, direct traffic, and content interactions that paid channels also touched. The seven-month payback assumes a program that compounds — content publishes on cadence, technical debt does not accumulate, and rankings hold against competitive moves.
The figure still anchors a defensible budget argument. Insight Partners' read on 2025 SaaS budgets describes growth teams cutting waste while protecting efficient channels 11, and SaaS Barometer benchmarks place combined sales and marketing investment at 30–35% of revenue once companies reach scale 12. Inside that constraint, a channel with compounding economics and sub-year payback earns its line item — provided the production model behind it can sustain the cadence the ROI assumes.
When Retainers Stop Pricing Fairly: A Diagnostic
A retainer prices fairly when the labor inside it produces compounding output. It stops pricing fairly when the same fee buys progressively less of what moved rankings in the first place. Three signals separate the two states, and each maps to a specific tier in the 2025 market.
- The first signal sits at the bottom of the market. Sub-$1,000 retainers — the band where 64% of agencies cluster 7— hit capacity limits inside the first quarter. Once basic on-page work and a baseline content cadence are established, the labor envelope at that price cannot support the link acquisition, technical depth, or competitive analysis required to keep moving. The retainer continues; the output curve flattens.
- The second signal appears in the mid-market band. A $4,000–$8,000 retainer 10starts drifting when deliverable counts inflate while seniority quietly retreats. Six blog posts replace three long-form pieces; a junior producer takes over briefs the strategist used to write; reports lengthen as substance thins. The fee is unchanged. The product is not.
- The third signal is structural. Account-management hours grow as a share of the engagement, status calls multiply, and the coordination tax — the share of every billed hour spent on handoffs rather than output — crosses a threshold where the buyer is funding the agency's internal operations more than the SEO program. ConsultFees frames this as the recurring tension inside retainers: clients paying for access begin to question what defined outputs the access produces 4.
Any one signal is a renegotiation conversation. Two signals together is a model question, not a pricing question.
See How Modern SEO Pricing Models Benchmark Against 2025 Performance Standards
Request a data-backed comparison of autonomous SEO delivery costs versus traditional agency retainers, including a breakdown of service coverage and ROI projections for multi-location and enterprise-scale operations.
If You Manage Multiple Product Lines or Geo-Page Portfolios
Audience scope shifts here. The reader profile narrows from a single-product SaaS team to growth leaders running multiple product lines, programmatic geo-page sets, or segmented content domains under one organic program — the SaaS analog to multi-location operations. Retainer math changes when the deliverable count multiplies but the labor envelope does not.
Working from Ahrefs' $2,917 monthly average 8and SPP's mid-market band of $4,000–$8,000 10, the implied cost-per-asset depends entirely on how many production units a single retainer is asked to carry. The table below holds the retainer fixed and varies the deliverable count, surfacing the variable that proposals usually bury.
| Monthly retainer | Deliverables/month | Implied cost per asset | % of ARR at $2M / $10M / $25M (8% baseline) 5 |
|---|---|---|---|
| $4,000 (mid-market floor) 10 | Retainer ÷ N | $4,000 ÷ N | 2.4% / 0.48% / 0.19% |
| $6,000 (mid-market midpoint) 10 | Retainer ÷ N | $6,000 ÷ N | 3.6% / 0.72% / 0.29% |
| $8,000 (mid-market ceiling) 10 | Retainer ÷ N | $8,000 ÷ N | 4.8% / 0.96% / 0.38% |
At a $6,000 retainer producing four long-form assets, cost per asset is $1,500. At eight assets, it is $750. A portfolio team needing 15 geo-targeted pages per month at the same fee is paying $400 per asset — a number that only works if the production model behind it is not pure agency labor 3.
From Retainer Math to Production-Model Math
The pricing question a growth leader started with — what should SEO services cost in 2025 — collapses into a different question once the labor envelope behind a retainer is exposed. The market average of $2,917 8and the mid-market band of $4,000–$8,000 10describe what providers charge. They do not describe what production model sits underneath.
Productive.io's analysis of professional services pricing names the shift directly: interest is moving toward models that align fees with outcomes rather than time spent 2. That shift only resolves cleanly when the production model itself can sustain output without inflating hours. A retainer priced on labor caps what a strategist can review; a production model priced on assets caps what a strategist must review. Those are different ceilings, and they produce different cost-per-ranked-asset curves over a 12-month program.
For a growth team running CAC under the scrutiny Insight Partners describes 11, the practical move is to stop comparing retainer quotes against each other and start comparing them against a production-model baseline — agency labor at 25–65% gross margin 3versus AI-augmented operating systems like Vectoron that price the asset, not the hour.
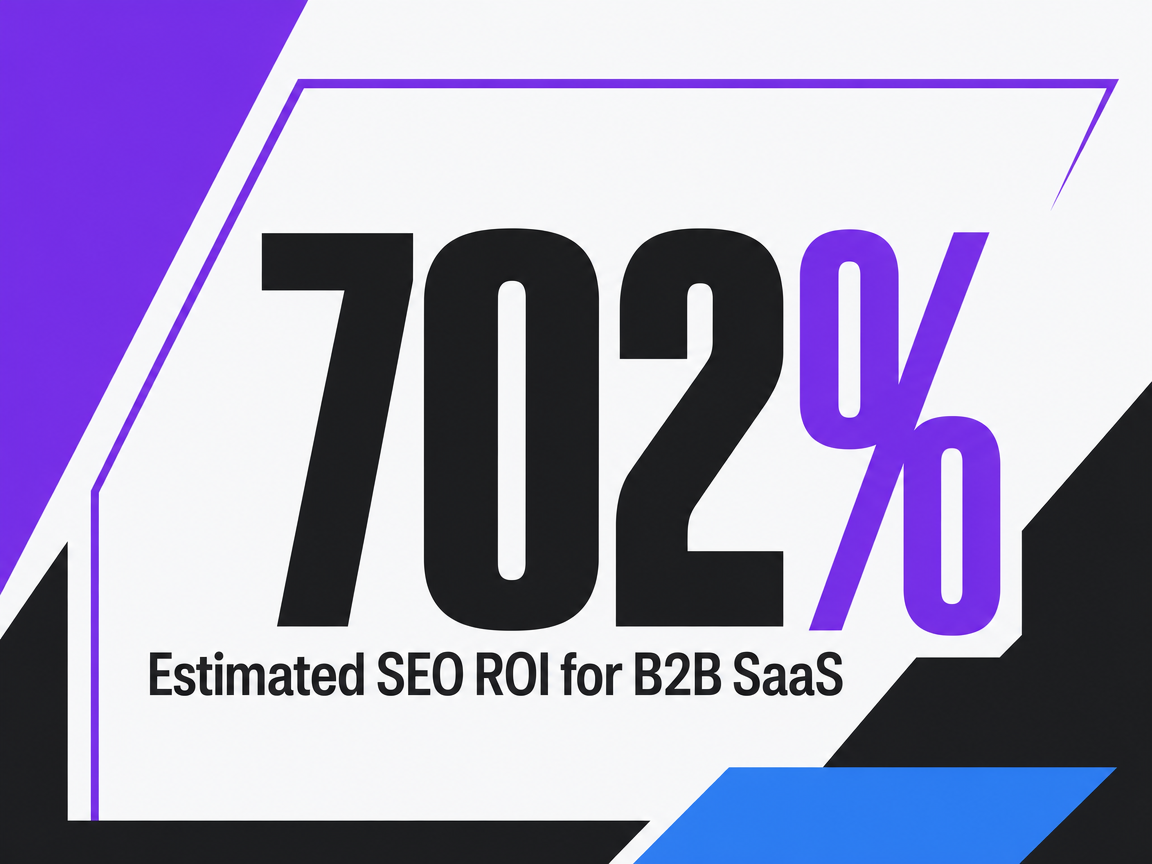 Estimated SEO ROI for B2B SaaS
Estimated SEO ROI for B2B SaaS
Frequently Asked Questions
References
- 1.How Much Does SEO Cost? Complete Pricing Guide for Business Owners.
- 2.What Are Professional Services Pricing Models – 2026 Guide.
- 3.How to Calculate a Retainer Fee - Promethean Research.
- 4.Consulting Retainers in 2026: Pricing & How They Work.
- 5.SaaS Marketing Budget Benchmarks and Best Practices (2025).
- 6.60+ SaaS Marketing Statistics & Benchmarks for 2026.
- 7.SEO Pricing: How Much Does SEO Cost In 2025 [Agency Survey].
- 8.SEO Pricing: How Much Does SEO Cost? 439 People Polled.
- 9.SEO Pricing Plans: How Much Does SEO Cost in 2025?.
- 10.Agency Retainer Pricing: Escape the Feast-or-Famine Cycle.
- 11.SaaS marketing benchmarks: 3 budgeting and strategy trends for 2024.
- 12.2025 B2B SaaS Marketing Benchmarks.