
Key Takeaways
- Enterprise rank trackers earn their place when keyword groups map to CRM revenue intent, letting agencies show visibility gains tied to bottom-funnel groups rather than portfolio averages.
- Search Console AI Performance reports surface AI Overview impressions per priority cluster, giving agencies a distinct trendline that proves content is cited in generative answers 13.
- Share-of-voice and SERP feature trackers reframe ranking as category conversation share, turning CMO reviews into budget conversations about snippet, PAA, and local pack ownership.
- GA4 data-driven attribution becomes the honesty slide when first-click, last-click, and data-driven views are shown side by side, neutralizing accusations of a self-serving model 11.
- Multi-touch attribution platforms defend CPA and ROAS by crediting organic across research touches, improving CPA efficiency 14 to 36 percent and lifting ROAS growth odds 2.3x 4.
- MMM and incrementality answer annual budget questions with plus-or-minus 15 to 20 percent accuracy over 12 to 24 months, translating organic's 6 to 12 month payback into defensible allocation 2, 8.
- Full-path attribution redistributes credit across opportunity creation stages, while self-reported fields capture dark social and AI-assisted discovery that tag-based tracking misses 9, 6.
- Looker Studio joins GA4, Search Console, an SEO platform, and CRM on shared dimensions, producing repeatable QBR pages tailored per audience rather than rebuilt each month 13.
- CRM-native ROI dashboards place organic next to paid and outbound, where the 14.6 percent organic close rate against 1.7 percent outbound reframes cost per lead as cost per closed-won 7.
- Local visibility platforms treat each storefront as the unit of measurement, scoring Maps share, GBP insights, and review health so regional GMs get per-location ROI, not domain averages 12, 14.
- AI execution platforms log every approved brief, on-page change, and GBP update against the reporting stack, producing the audit trail that keeps keyword-group revenue claims credible 10, 13.
Why single-model ranking reports lose the ROI argument
The QBR failure mode is familiar. An agency SEO lead walks the client through a rank tracker screenshot, a Search Console traffic curve, and a keyword-group visibility score. The CFO looks up and asks which deals closed because of that movement. The room goes quiet, and the renewal conversation shifts from expansion to justification.
The underlying math is what makes single-model reporting unwinnable. In B2B journeys, organic search generates roughly 64% of first touches but only 15% of final touches, with an 18% close rate and a recommended 35% budget allocation once full-path credit is applied 5. A last-touch dashboard, which is still the default in most CRMs, shows the client the 15% number and hides the 64%. A first-touch view flips the problem in the opposite direction and invites the CFO to argue that the paid retargeting click is what actually converted. Either lens, on its own, misrepresents what organic did.
That gap is why the useful question is no longer which rank tracker to buy. It is which combination of ranking, attribution, and revenue-join tools produces multiple credited views of the same organic performance, so the CFO, CMO, and regional GM each see the number that answers their objection. The 11 options that follow are grouped to support exactly that stack.
How to read this list: three buckets, one defensible stack
The 11 entries below are not ranked against each other. They are grouped by the job they do inside a QBR.
- Bucket one covers visibility and rank measurement: the keyword-group, SERP feature, and AI Overview reporting that clients still expect to see on the first slide.
- Bucket two covers attribution and revenue modeling: GA4 data-driven attribution 11, multi-touch platforms, MMM, incrementality, and self-reported fields for the touches tracking misses 6.
- Bucket three covers dashboarding, revenue joins, and execution: the Looker Studio, CRM, and platform layers where ranking data becomes a defensible ROI artifact against a four-layer reference stack of GA4, Search Console, an SEO platform, and CRM 13.
Read the list as a menu for building coverage, not a leaderboard. The renewal case gets stronger when the same organic performance shows up in three credited views rather than one.
Visibility and rank measurement: the ranking layer clients still ask for
1. Enterprise rank tracking platforms for keyword-group revenue mapping
Clients still open the deck expecting to see keywords moving. The useful move is to stop reporting on rank alone and start reporting on rank grouped by revenue intent. Enterprise rank trackers (Semrush, Ahrefs, seoClarity, Botify, and similar platforms) earn their line item when the agency defines keyword groups that map to specific product lines, service areas, or opportunity stages in the client's CRM, then tracks visibility movement per group rather than a portfolio average.
That grouping neutralizes a common CFO objection: "Rankings went up but pipeline did not." A keyword-group view lets the analyst show that visibility gains concentrated in bottom-funnel groups tied to sales-accepted leads, or conversely, that gains sat in top-of-funnel research terms that are expected to convert on a 6-12 month lag 8. The QBR artifact is a single Looker Studio page with three columns per group: average position delta, organic sessions delta, and organic revenue delta pulled from GA4 and CRM. Revenue-per-visitor by keyword group is the metric that closes the argument, not average position 10.
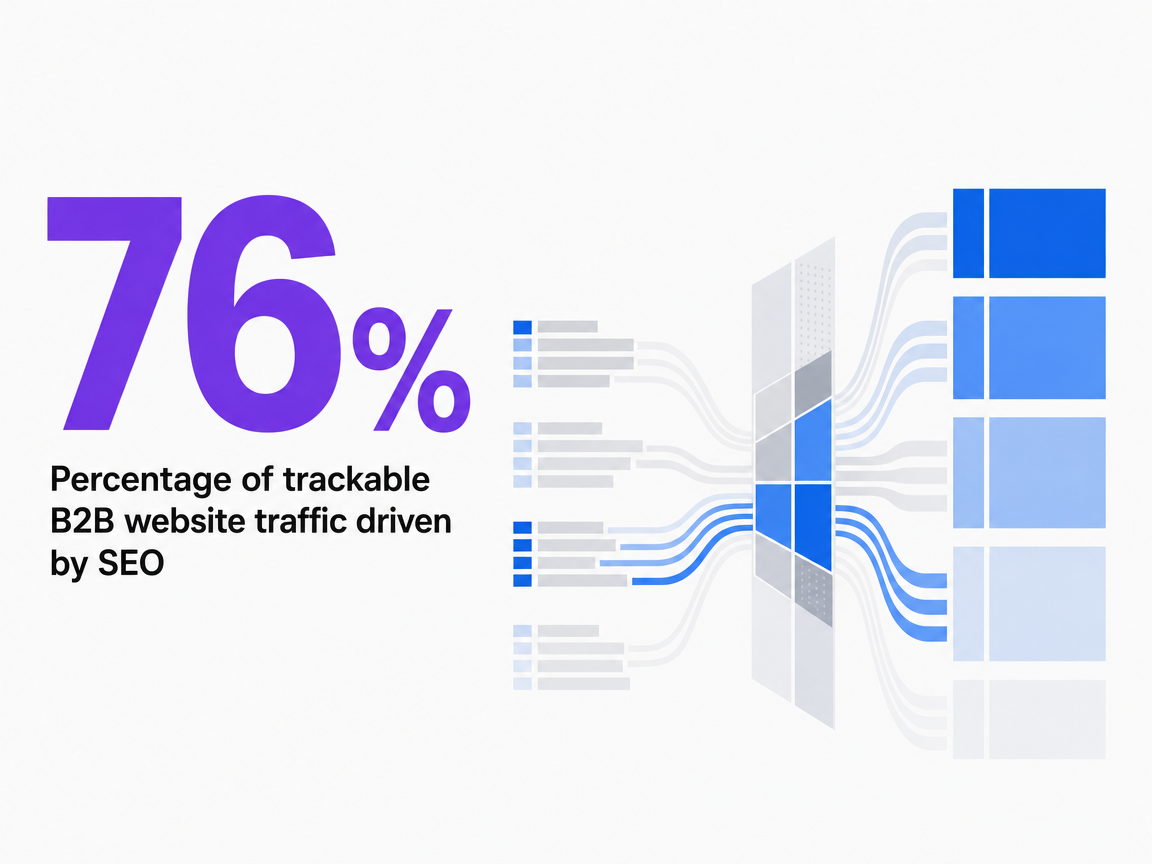 Percentage of trackable B2B website traffic driven by SEO
Percentage of trackable B2B website traffic driven by SEO
2. Search Console AI Performance reports for AI Overview visibility
AI Overview impressions have become a required line on the visibility slide. Search Console's AI Performance reports now surface impressions and clicks from AI-generated search experiences, and agencies that ignore them are handing regional GMs and CMOs a reason to question whether the SEO program is keeping up with SERP change 13.
The operational read is narrow. AI Overview impressions confirm the client's content is being cited in generative answers on brand and category queries, but click-through behavior on those surfaces is not comparable to blue-link CTR. The right QBR treatment is a two-line trend: AI Overview impressions per priority topic cluster, alongside traditional organic impressions for the same cluster. Agencies working multi-location portfolios should track AI Overview appearances as a distinct KPI per location, since generative results reshuffle visibility differently across geographies 14. The report artifact is a Search Console export filtered to AI surfaces, joined to the same keyword groups used in the enterprise rank tracker.
3. Share-of-voice and SERP feature trackers for CMO-facing narratives
CMOs do not ask about average position. They ask what percentage of the category conversation the brand is winning against the two or three competitors they benchmark against every quarter. Share-of-voice trackers (the SOV modules inside Semrush, Similarweb, and dedicated tools like AuthoritasSTAT) answer that question by weighting ranking positions against search volume across a defined keyword universe.
The CMO-facing narrative gets sharper when SOV is broken down by SERP feature:
- organic blue-link share
- featured snippet ownership
- People Also Ask presence
- image pack
- video
- local pack coverage
Each feature category maps to a different content investment, so the report becomes a budget conversation rather than a ranking conversation. Multi-location brands can extend the same logic to a Local Visibility Score composed of roughly 100 metrics spanning search, social, and reputation, where top multi-location businesses average around 48 out of 100 on the search dimension 15. That composite gives the CMO a single trendline to defend to the board while the underlying features stay accountable to individual work streams.
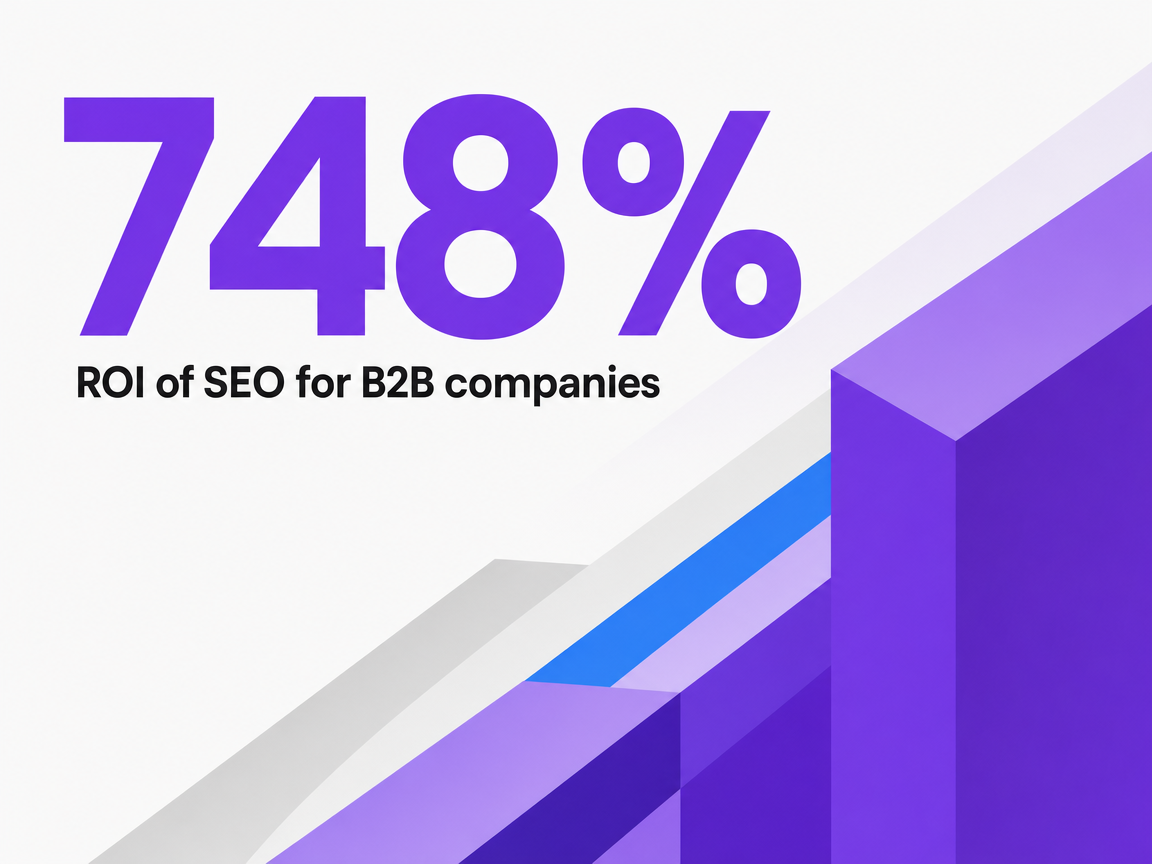
ROI of SEO for B2B companies
Test Real-Time SEO Ranking Impact Instantly
Measure the effect of published content on client rankings and ROI in a live environment from day one.
Attribution and revenue modeling: the layer that survives a CFO review
4. GA4 data-driven attribution as the baseline Google-side view
GA4's data-driven attribution is the model most client stacks already produce, which makes it the pragmatic starting point rather than the endgame. It uses machine learning to assign fractional credit across touchpoints based on observed conversion patterns, distributing weight between organic search, paid, direct, referral, and email in ways last-click never could 11.
The operational value shows up in two places. The Attribution reports let the analyst compare a single conversion event under data-driven, first-click, and last-click views side by side, which becomes the honesty slide in a QBR: the same organic performance credited three different ways. That comparison neutralizes the CFO objection that the agency picked a self-serving model.
The limit is scope. GA4 only sees what its tag can observe, so cross-device, offline conversion, and dark social touches are underrepresented. The report artifact for the QBR is a GA4 exploration exported to the Looker Studio page, filtered to the client's primary conversion event, with the three-model comparison surfaced above the fold and organic's data-driven credit called out per keyword group.
5. Multi-touch attribution platforms for CPA and ROAS defense
The CFO objection multi-touch attribution answers is direct: "Show me that we are not overpaying to acquire a customer, and that our ad spend is doing more this year than last." MTA platforms (Dreamdata, HockeyStack, Attribution, Rockerbox, and the MTA modules inside HubSpot's revenue attribution reporting) assign credit across every observed touch, then let the analyst switch between U-shaped, W-shaped, linear, time-decay, and data-driven views inside one dashboard 1.
The business case is quantified. Multi-touch attribution improves CPA efficiency by 14 to 36 percent, and marketers using dedicated attribution platforms are 2.3 times more likely to grow ROAS year over year 4. Those are the numbers to put on the QBR slide next to the client's own CPA trend, because they give finance a benchmark to compare against rather than a bare claim that the agency's attribution is better.
For SEO specifically, MTA is what surfaces the middle-of-funnel value that GA4's tag-based view underreports. When a prospect reads three organic blog posts, converts on a paid retargeting click, and closes six weeks later, the MTA platform credits organic across all three research touches. That is the view that turns the 64 percent first-touch number 5 into a defensible pipeline number the CFO will accept. The report artifact is a channel-ROI table with organic broken out by content cluster, exported monthly and appended to the QBR deck as an audit trail.
6. MMM and incrementality tools for longitudinal budget conversations
MMM and incrementality answer a different objection than MTA. When the CMO asks whether the SEO investment is driving lift the brand would not have captured anyway, tag-based attribution cannot answer. Media mix modeling (Meta's Robyn, Google's Meridian, Recast, and enterprise MMM platforms) uses statistical regression on aggregated spend and outcome data over long windows. Incrementality testing (geo holdouts, PSA tests, matched-market experiments) measures the counterfactual directly by turning organic content investment off in one region and comparing outcomes.
The honest way to describe model confidence to finance is with paired accuracy and lookback windows. MMM achieves plus-or-minus 15 to 20 percent accuracy over 12 to 24 months of history, while MTA achieves plus-or-minus 8 to 12 percent accuracy over 3 to 6 months 2. That framing gives the agency a defensible line: MTA answers this quarter's CPA question, MMM answers the annual budget question, and neither claims precision it does not have.
For SEO, MMM is the tool that translates a 6 to 12 month organic payback curve 8 into a budget allocation the CFO can defend at planning time. The QBR artifact is an MMM output slide showing organic's marginal contribution to revenue at the current investment level, refreshed twice a year.
7. Full-path and self-reported attribution for the touches tracking misses
Full-path attribution reweights the entire journey around stages the CRM already tracks. In the Bizible-style implementation, credit is distributed 22.5 percent each to first touch, lead conversion, opportunity creation, and deal close, with the remaining 10 percent spread across other interactions 9. That structure lets the agency show organic's contribution to opportunity creation, not just top-of-funnel awareness, which is the stage where CFOs actually care.
Self-reported attribution fills the gap tag-based models cannot cover. A single "How did you hear about us?" field on the demo form or intake call, structured as a dropdown with organic search, AI assistant, referral, and event options, captures dark social and AI-assisted discovery that tracking misses 6. When self-reported organic credit and GA4-attributed organic credit are trended side by side, agencies routinely find the self-reported number is materially higher, which becomes the evidence that the tag-based CPA is overstating cost.
The QBR artifact is a one-slide reconciliation: self-reported channel credit, MTA-attributed credit, and CRM-sourced credit shown as three bars per channel. Where they diverge, the agency has the operator conversation ready.
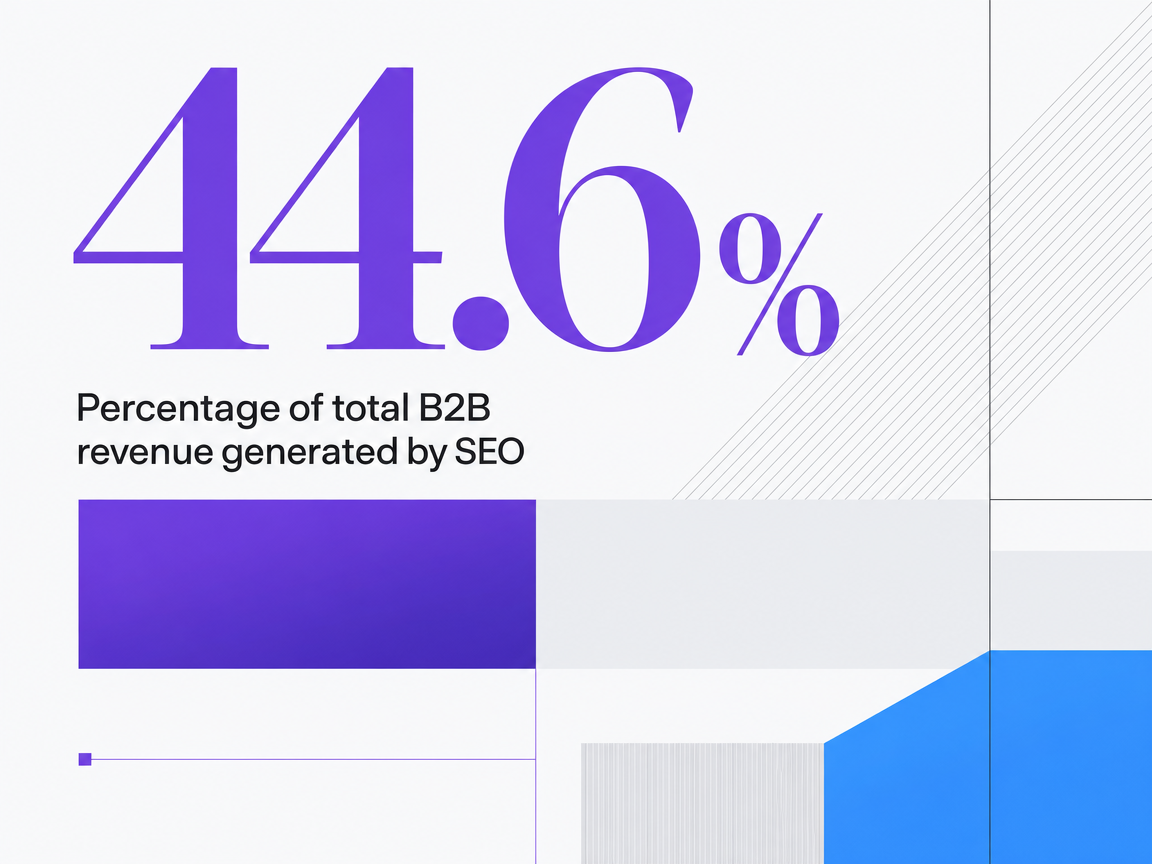 Percentage of total B2B revenue generated by SEO
Percentage of total B2B revenue generated by SEO
Dashboarding and revenue joins: where ranking becomes a report artifact
8. Looker Studio as the four-layer aggregation surface
Looker Studio is not a ranking tool. It is the surface where ranking data stops being a screenshot and starts being a report artifact the client can drill into. The reference architecture worth standardizing on is the four-layer stack: GA4 for behavior and conversions, Search Console for query and AI Overview impressions, an SEO platform for keyword-group visibility, and the CRM for pipeline and closed-won 13. Looker Studio joins those four sources on a common date and URL dimension, then exposes one page per audience: an executive summary for the CFO, a channel-ROI page for the CMO, and a keyword-group performance page for the internal marketing lead.
The operational win is repeatability. Once the joins are built, the analyst is not rebuilding the report each month, they are refreshing it. The QBR artifact is a shareable dashboard link with a static PDF export appended to the deck. The metrics that earn shelf space per the same guide are organic leads generated, cost per organic lead versus paid alternatives, target keyword movement, and AI Overview impressions per priority cluster 13.
9. CRM-native ROI dashboards for pipeline and closed-won credit
The dashboard finance actually opens lives inside the CRM. HubSpot's revenue attribution reporting, Salesforce's Campaign Influence, and B2B templates built on top of them foreground the three numbers leadership tracks between QBRs: pipeline generated, revenue attributed, and ROI by channel 16. When organic search appears next to paid, events, and outbound in that same view, the SEO program stops being reviewed on its own terms and starts being reviewed against every other line in the budget.
That comparison is where the SEO close-rate advantage lands. Organic leads close at 14.6 percent against 1.7 percent for outbound in the benchmark data, a ratio that reframes any conversation about cost per lead into a conversation about cost per closed-won 7. The revenue-oriented KPI set that carries the argument, organic revenue per visitor, conversion rate by keyword group, CAC via organic, and organic customer lifetime value, is the same set that produced a 347 percent average ROI across a Q4 2024 service portfolio 10. The QBR artifact is a CRM dashboard export showing organic's sourced pipeline, influenced pipeline, and closed-won revenue trended against the prior four quarters, with keyword-group tags carried through as opportunity properties so the analyst can drill from a revenue number back to the specific content that earned it.
If you manage multi-location portfolios: ranking as a location-level metric
10. Local visibility platforms for Maps share, GBP insights, and review health
The audience shifts here. Agencies running portfolios of law offices, dental groups, home services brands, and senior living operators are not defending a single organic curve. They are defending 40 or 400 location-level curves against regional GMs and franchisees who each want to know why their pin is not winning the map pack against the competitor two blocks over.
Local visibility platforms (BrightLocal, Local Falcon, Rio SEO, Yext, Uberall, and the local modules inside Semrush and Ahrefs) treat the location, not the domain, as the unit of measurement. The metrics that carry weight in a franchisee review are:
- Maps visibility share on a geo-grid around the storefront
- Google Business Profile insights for calls and direction requests
- profile accuracy and freshness
- review volume and response SLA
- completed priority actions per location 12
Layered on top, a per-location taxonomy adds local pack rankings, AI Overview appearances, GBP conversion actions, and revenue attributed to organic local search, which is what turns a visibility slide into a ROI calculation the regional GM will sign off on 14.
The QBR artifact is a per-location scorecard that rolls up into a portfolio index, with an outlier list flagging the bottom decile on review health or Maps share so field teams have a triage queue instead of a spreadsheet.
Ranking and attribution coverage per location: consolidated stack vs point tools
The table below maps the same four-layer reference architecture 13 to a location-level portfolio, contrasting a stitched point-tool stack against a consolidated approach. Dollar figures and headcount ratios are left as agency-reported variables because the supplied research does not benchmark them directly.
| Layer | Point-tool count (typical) | QBR artifact produced | Analyst hours per client per month | Objection it answers |
|---|---|---|---|---|
| Rank tracking (keyword-group) | 1–2 | Keyword-group visibility deltas | Medium | "Rankings up, pipeline flat" (CMO) |
| Local visibility | 1–2 | Maps share and GBP scorecard per location 12 | Medium–high | "My pin is losing" (franchisee) |
| Attribution modeling | 1–2 | MTA channel-ROI table + self-reported reconciliation | High | "Why credit organic?" (CFO) |
| CRM / revenue join | 1 | Per-location ROI calculation 14 | Medium | "Which locations pay back?" (regional GM) |
| Dashboarding | 1 | Looker Studio portfolio index | Low (after build) | "One view for the board" (CMO) |
| Execution logging | 0–1 | Approved-work audit trail per location | Variable | "What did we actually ship?" (client PM) |
Consolidation earns its keep in the analyst-hours column, not the license column.
See How Unified SEO Tool Reporting Drives Transparent, Measurable ROI
Get a walkthrough of multi-client SEO ranking dashboards designed for agency-scale reporting, with live KPI tracking and approval workflows built for enterprise requirements.
Execution-plus-reporting: closing the loop from recommendation to published work
11. AI execution platforms that log the work behind the ranking movement
A ranking dashboard and an attribution model both assume the work behind the movement actually shipped. In practice, the audit trail is where most agency ROI stories break. The client asks which briefs closed the visibility gap on a priority cluster, and the analyst reconstructs the answer from Slack threads, shared drives, and CMS timestamps. The keyword-group revenue view 10 loses credibility when the work log cannot be produced alongside it.
AI execution platforms address that gap by governing the recommendation-to-publish loop and logging every approved action against the same keyword groups, locations, and CRM properties the reporting stack already tracks. Recommendations arrive ranked by projected impact, a human approves or rejects each one, and the executed work carries metadata that joins back to Search Console impressions, GA4 conversions, and CRM pipeline in the four-layer stack 13. When the CFO asks what earned the organic revenue delta this quarter, the answer is a filterable list of approved briefs, on-page changes, GBP updates, and outreach placements timestamped against the visibility and pipeline curves.
Vectoron operates in this slot: an approval-first execution layer whose specialist strategists surface ranked recommendations and log every published artifact against the reporting metrics agencies already defend in QBRs.
Building the stack: which objection each layer answers
The renewal argument gets easier when each layer of the stack has a named audience and a named objection.
- Rank and visibility platforms answer the CMO question about category share.
- GA4 data-driven attribution 11 answers the honesty question by comparing three models side by side.
- MTA answers the CFO question about CPA discipline 1.
- MMM and incrementality answer the annual budget question.
- Full-path and self-reported reconciliation answer the touches-tracking-misses question 6.
- Looker Studio and CRM-native dashboards answer the board-view question.
- Local visibility platforms answer the franchisee question.
- Execution logging answers the question of what actually shipped against the recommendations.
No single layer wins the QBR alone. The stack wins because the same organic performance appears in three credited views instead of one, and each view is aimed at the person in the room whose objection would otherwise stall the renewal.
Methodology note: model accuracy, tracking gaps, and how to describe them to clients
Every model in the stack carries a confidence range worth naming out loud. MMM produces plus-or-minus 15 to 20 percent accuracy over 12 to 24 months, MTA lands in the 8 to 12 percent range over 3 to 6 months 2, and GA4's data-driven attribution only sees what its tag can observe, which underrepresents cross-device, offline, and AI-assisted touches 11. Self-reported fields close part of that gap but introduce recall bias 6. The operator move is to state the window and margin next to each number in the QBR, note the touches the model cannot see, and reconcile divergent views on one slide rather than defending a single figure. That framing preempts the CFO challenge and keeps the ranking-to-revenue argument credible across renewals.
Frequently Asked Questions
References
- 1.Marketing Attribution: Models, Methods, and Metrics for RevOps Teams.
- 2.Marketing Attribution in 2026.
- 3.Marketing Attribution That Actually Works.
- 4.Marketing Attribution Statistics (2026): 54+ Data Points on ....
- 5.B2B Marketing Attribution: Statistics & Models (2026).
- 6.B2B SaaS Attribution Model Accuracy Benchmarks 2026: First ....
- 7.SEO ROI Statistics.
- 8.65+ B2B SEO Statistics & Benchmarks for 2026 - Oliver Munro.
- 9.Marketing Attribution for B2B: The Models That Work and the ....
- 10.7 Revenue-Driving SEO Services That Delivered 347% ROI in 2024.
- 11.Measure Marketing ROI with Attribution.
- 12.Local SEO Benchmarks 2026 for Multi-Location Brands.
- 13.How to Prove SEO ROI to Clients: Complete Agency Guide.
- 14.White Label Local SEO for Multi-Location Franchises.
- 15.The 2022 Localized Marketing Benchmark Report: A Look Into the Data.
- 16.B2B Marketing ROI Dashboard: Track What Actually Matters.
- 17.The Consumer Decision Journey.