
Key Takeaways
- Ahrefs connects rank data with Search Console, GA4, and SERP feature history, but revenue tracking still depends on the client's GA4 event model and an external CRM connection.
- Semrush offers portfolio-scale keyword coverage and white-label reporting, yet loses query-page granularity and requires manual tagging to recreate branded versus non-branded segmentation.
- STAT by Similarweb captures daily pixel-level SERP data and full feature logs, making it valuable for enterprises willing to pipe its feed into a warehouse for revenue joins.
- Sistrix anchors European visibility benchmarking through its Visibility Index, giving agencies with UK and German clients a market-native reference that US trackers cannot match.
- AgencyAnalytics automates client-ready dashboards across many data sources, but inherits the measurement gaps of whichever rank tracker, GA4 setup, or CRM feeds it.
- Looker Studio with BigQuery lets agencies build custom rank-to-revenue joins that satisfy every scorecard criterion, provided they have the SQL talent to maintain the schema.
- Vectoron embeds measurement into an approval workflow where AI strategists use Search Console, GA4, calls, and pipeline signals to drive the next week's production queue.
Why rank tracking became a commodity and revenue instrumentation didn't
Rank tracking has been a solved problem for years. Any vendor can pull position data, compare it to previous weeks, and generate a report. This commoditization has eroded profit margins and diminished its strategic value in quarterly business reviews (QBRs). A CFO is less concerned with a keyword moving from position 6 to 4 and more interested in whether that movement translated into pipeline growth.
The real challenge lies in instrumentation: connecting Search Console impressions and queries to on-site behavior, and then to CRM revenue. This requires a robust system that agencies can confidently present to a client's finance team. Google itself highlights Search Console and Analytics as essential for this measurement stack, with Search Console covering pre-click activity and Analytics tracking post-click behavior 1. Most rank trackers only address the pre-click phase.
Effective tools bridge this gap. They integrate position data into a comprehensive revenue model, considering SERP feature exposure and distinguishing between branded and non-branded intent. These tools provide the necessary connections for analysts to correlate ranking changes with actual business outcomes. This article evaluates tools based on this standard, rather than just feature lists.
The operator scorecard: five criteria that separate reporting from revenue proof
Search Console depth as the baseline data spine
Search Console is the primary, free source for impressions, clicks, average position, and query-level data directly from Google, forming the foundation of any credible revenue model 1. The key question for a tool isn't merely its connection to the Search Console API, but rather the extent of data it retains, its granularity, and how it facilitates analysis.
A robust tracker should store Search Console history beyond Google's 16-month limit, preserve query-page pairs, and allow analysts to segment data by country, device, and search appearance. Google's own recent data view now offers performance breakdowns by query, page, and country with improved reporting frequency 2. Any paid tool should at least match this operational capability.
SERP feature and AI Overview accounting
While position remains a strong predictor of organic CTR 7, it's no longer the sole factor. The surrounding SERP layout significantly influences click behavior. A tracker that reports a position 3 ranking without noting an AI Overview above it provides an incomplete picture of the user's experience.
The impact of SERP features is substantial. Seer Interactive's study on informational queries showed organic CTR dropping from 1.76% to 0.61% when AI Overviews appeared, a 61% reduction for the same underlying rankings 8. Revenue models based on historical CTR curves will overestimate traffic if they don't account for new AI Overviews on SERPs.
Therefore, a tool must:
- log SERP feature presence per query per crawl,
- link feature exposure to actual CTR observed in Search Console, and
- enable analysts to adjust traffic forecasts as feature coverage changes.
Trackers that only report blue-link positions are measuring an outdated version of Google's search results.
Conversion and CRM stitching for branded versus non-branded intent
Pooling branded and non-branded queries distorts revenue attribution. Inflated organic conversion rates for branded terms can mislead, as these often reflect existing demand. Search Console's branded-query filter, introduced in 2025, directly segments impressions, clicks, average position, and CTR by branded and non-branded views in the Performance report 4, setting a standard for paid tools.
The critical test is whether the tracker maintains this segmentation downstream. Branded flags at the query level should follow clicks into Analytics sessions and, subsequently, into CRM records for booked revenue, qualified calls, or pipeline stages. A tool reporting 800 organic conversions without distinguishing the 620 from branded terms isn't measuring SEO's contribution; it's measuring pre-existing brand demand.
Multi-client governance and reporting automation
Agencies managing numerous client accounts require tools that offer efficient governance. Essential features include:
- role-based access per client,
- keyword tagging that remains consistent,
- portfolio-level alerting thresholds, and
- automated report delivery.
These features reduce the need for manual intervention by analysts.
Google's Search Console Insights report demonstrates the current reporting standard, providing trend views of clicks and impressions for non-technical users 3. A paid tracker should at least match this clarity in client-branded exports to avoid agencies incurring additional analyst hours for polishing reports. Tools that automate routine tasks allow senior analysts to focus on strategic QBR narratives.
Attribution-grade versus incrementality-grade measurement
Many trackers fall short on the final criterion: incrementality. Attribution-based reporting links revenue to observed touchpoints, while incrementality assesses what would have happened without that touchpoint 10. Google's research on organic-and-paid interaction found that only about 50% of ad clicks alongside a top-ranked organic result are incremental 5. The same logic applies to organic SEO: some clicks attributed to a top ranking might have occurred through other channels.
Attribution-grade tools connect rank, click, and conversion. Incrementality-grade tools support methods like geo holdouts, controlled content pauses, or marketing mix modeling, which uses historical data to isolate the sales impact of each marketing component 9. While not every agency needs to run marketing mix modeling, the tool should provide data clean enough for an analyst to perform such analysis when a client CFO asks causal questions.
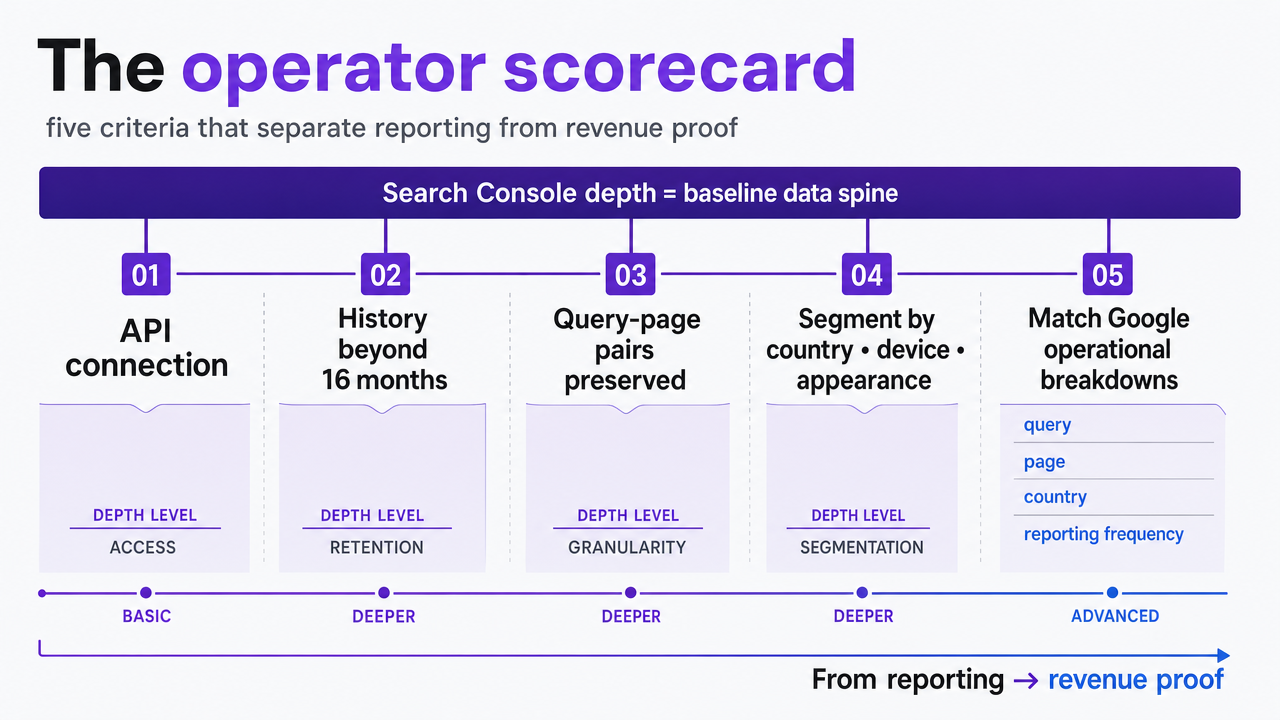 Visualize the five evaluation criteria as a scorecard framework so readers can internalize the rubric used to rank tools in the next section
Track SEO impact from rankings to revenue
Experience live data on rank and revenue alignment with real campaigns before making a commitment.
Why position still moves the number, and where the model breaks
Position data remains crucial in revenue discussions. Research on real search sessions shows that over 50% of users click the first organic result, and more than 97% of all clicks occur on the first page 6. This distribution explains why a single position improvement for a commercial keyword can significantly impact booked revenue, unlike a similar move on page three. Rank is not a vanity metric when the click curve is so steep.
The model encounters two primary challenges. First, the SERP itself: position is the strongest predictor of organic CTR 7, but this CTR is unstable when AI Overviews, featured snippets, or product panels alter the page layout. Historical CTR curves become inaccurate as SERP feature coverage evolves.
Second, causality: Google's research on paid-organic interaction indicates that only about half of top-rank ad clicks are truly incremental when a matching organic result is present 5. The organic side faces a similar issue. A tracker that simply reports position, click, and conversion shows correlation; a tracker that enables analysts to test lift demonstrates true contribution. The following ranking prioritizes tools based on their ability to address these challenges.
The tools, ranked by how well they close the position-to-pipeline gap
Ahrefs: rank tracking with defensible Search Console and analytics joins
Ahrefs is a top choice because its rank tracker integrates with a broader data ecosystem, including Search Console, GA4, and its own crawl index. The workflow from Site Explorer to Rank Tracker to Portfolios allows analysts to connect keyword movement to landing pages, Search Console query sets, and GA4 conversion data within a single interface. This aligns with Google's recommended baseline for SEO measurement 1.
Ahrefs excels at bridging the gap by logging SERP feature history per keyword per check. This enables analysts to identify when an AI Overview appeared and correlate the CTR drop with Search Console clicks from the same week. Branded and non-branded segmentation can be replicated using tagging rules that mirror Search Console's native filter 4.
However, its revenue integration depends on the client's existing GA4 event model. Ahrefs does not build the CRM connection for booked pipeline. Agencies using it as their primary rank-to-revenue layer still need a data warehouse or a separate reporting tool to track organic sessions through to closed revenue.
Semrush: portfolio-scale tracking with weaker revenue stitching
Semrush offers extensive breadth, supporting thousands of keywords across many client workspaces. Its Agency Growth Kit provides white-label reports and client portals, streamlining monthly deliverables. For agencies managing numerous accounts primarily focused on keyword coverage, Semrush is highly effective.
The main limitation lies in its data joins. While Semrush integrates Search Console data, the query-page granularity is often lost in its built-in dashboards. Branded versus non-branded segmentation must be manually recreated with keyword tags, rather than inheriting from Search Console's native filter 4. Conversion data from GA4 connectors typically stops at session-level goals, meaning booked revenue or qualified calls require integration with other systems.
In practice, Semrush is strong for portfolio management and client-facing reports but less effective as a direct source of truth for revenue attribution. Most agencies combine it with a data warehouse rather than relying solely on Semrush for revenue claims.
STAT by Similarweb: SERP feature granularity for enterprise books
STAT is designed for detailed daily SERP scraping, capturing the full result page for every tracked keyword, including AI Overviews, featured snippets, product panels, and local packs. It provides pixel-level position data that analysts can segment by device and location. This granularity is particularly valuable for agencies serving enterprise clients with extensive keyword tracking needs.
STAT directly addresses the SERP feature accounting criterion. Given that organic CTR significantly drops when AI Overviews appear 8, and position is only the strongest predictor of CTR when feature presence is constant 7, STAT's per-crawl feature logs enable analysts to develop client-specific CTR curves instead of relying on generic industry benchmarks.
However, STAT does not independently close the revenue loop; it functions as a data source, not a complete reporting suite. Agencies typically pipe its daily feed into platforms like BigQuery or Snowflake, where it's combined with Search Console and CRM data. This significant investment explains why STAT is more common in enterprise environments than in mid-market settings.
Sistrix: visibility indices tuned for European client portfolios
Sistrix's Visibility Index is a benchmark in German, UK, and other European SEO markets, a distinction unmatched by US-based trackers. For agencies with European clients, this alone is a compelling feature, as in-market CMOs and analysts already use this index for benchmarking, facilitating QBR discussions.
The tracker also offers SERP feature logging and Search Console integration that meets the baseline data spine requirements 1. Its modular structure allows agencies to license only the countries relevant to a client. Revenue stitching is less robust than other tools on this list, as Sistrix expects conversion joins to occur downstream in an analytics or data warehouse layer. Its native reporting focuses more on visibility metrics than pipeline attribution.
Agencies primarily use Sistrix as the authoritative source for market visibility in Europe, then integrate revenue calculations using other platforms.
AgencyAnalytics: reporting automation without native measurement rigor
AgencyAnalytics specializes in transforming data from various tools into client-ready reports at scale, eliminating the need for manual slide assembly. It connects rank data, Search Console, GA4, Google Ads, call tracking, and CRM into a unified client dashboard with white-labeled branding and scheduled delivery. This comfortably surpasses the reporting standards set by Google's Search Console Insights report for non-technical stakeholders 3.
However, it is not a measurement engine itself. Rank data is sourced from third-party tools, SERP feature accounting depends on the feeding tracker, and conversion joins only reflect what GA4 or the CRM already know. Branded and non-branded segmentation must be established upstream and passed through as tagged data.
AgencyAnalytics functions as a reporting automation layer atop an existing stack, rather than being the stack itself. Agencies attempting to use it as the sole source of truth may find their polished dashboards inherit measurement gaps from the underlying tools.
Looker Studio with BigQuery: custom rank-to-revenue models when off-the-shelf falls short
For agencies with a data engineer or a senior analyst proficient in SQL, the most advanced option isn't a product, but a custom solution. This involves exporting Search Console data to BigQuery, integrating it with GA4's native BigQuery export, a rank data feed from STAT or Ahrefs, and CRM revenue via a reverse ETL tool. Looker Studio then serves as the client-facing interface.
This custom stack meets every scorecard criterion because the agency builds its own joins. Query-page pairs are preserved at full granularity, SERP feature logs are co-located with Search Console clicks, and branded/non-branded flags propagate from source to CRM. The warehouse structure supports incrementality tests or marketing mix models when a client CFO asks causal questions 9, 10.
The main cost is the analyst hours required for building and maintaining the system. While BigQuery storage and query fees are modest for agency portfolios, the significant expense is the personnel responsible for the schema. Agencies with such expertise can achieve the highest measurement ceiling; those without should approach this path cautiously.
Vectoron: execution platform with measurement built into the approval workflow
Vectoron is an execution platform, not a traditional rank tracker focused on keyword volume or crawl frequency. It employs specialist AI strategists for content, SEO, PPC, backlinks, social, and call intelligence. These AI strategists analyze live client signals, including Search Console impressions, GA4 conversions, qualified calls, and pipeline stage. They then generate ranked recommendations that are routed through a Command Center for human approval before implementation.
For an agency Head of SEO, the key difference is where measurement resides. In other tools, rank data, Search Console, and CRM revenue are stitched together after the fact. In Vectoron, the same signals that inform a QBR also drive the next week's production queue. Every approved action is tracked for KPI impact across channels. The workflow assumes attribution is the descriptive layer and treats causal validation, such as geo holdouts or MMM-style analysis, as a capability that a mature client account develops over time 9, 10.
The value proposition is clear: an agency using Vectoron invests in an operating layer, not just a standalone rank tracker. Portfolio strategists seeking fewer tools and tighter integration between measurement and execution will find this approach compelling.
See How Leading Agencies Link SEO Rankings Directly to Revenue Impact
Request a walkthrough of advanced SEO tracker workflows that tie ranking data to client revenue, with real-time reporting and actionable insights designed for multi-account agency teams.
If you manage a book of 15 to 25 clients: the consolidation math
For a portfolio strategist managing 15 to 25 client relationships, the tool selection shifts from feature comparison to workflow compression. At this scale, the goal is to minimize the time spent on data janitorial work.
The calculation is straightforward: let C be the client count, K be the tracked keywords per client, and H be the analyst hours per client per reporting cycle. A fragmented stack—typically a rank tracker, Search Console export, and a separate reporting layer—increases H due to manual reconciliation across tools. A unified workflow, which integrates query-page pairs, SERP feature flags, and conversion joins within a single schema, reduces H towards the automation level exemplified by Google's Search Console Insights report for trend delivery to non-technical stakeholders 3.
| Dimension | Stitched three-tool stack | Unified rank-to-revenue workflow |
|---|---|---|
| Tracked keyword volume per client | K, capped by license tier splits across tools | K, in one license envelope |
| Reporting cadence | Monthly, gated by manual reconciliation | Weekly or on-demand, matching Search Console's operational tempo 3 |
| Analyst hours per client per cycle | H plus reconciliation overhead | H minus automated joins |
| Portfolio load per strategist | Total hours = C × (H + overhead) | Total hours = C × H |
Before renewing licenses, a portfolio lead should determine which of these scenarios their current stack aligns with. If reconciliation overhead dominates the total-hours equation, the client capacity is limited by tooling, not by talent.
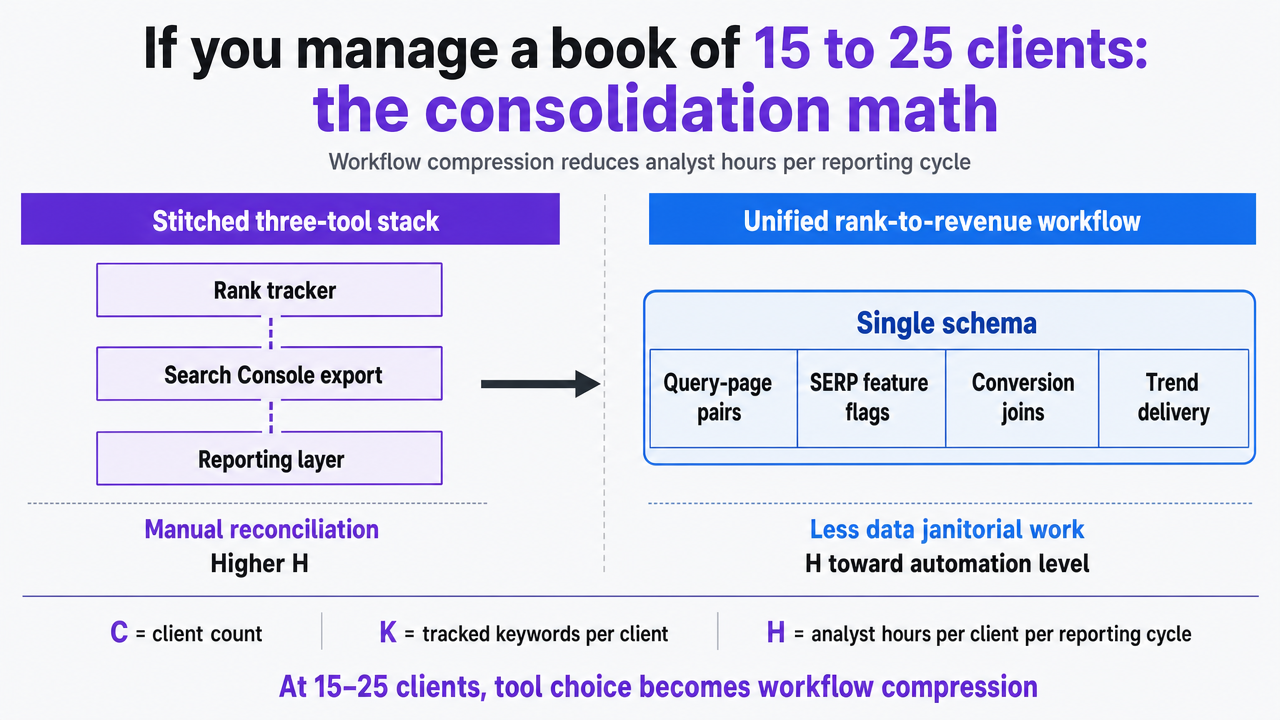 Turn the comparison table in this section into a side-by-side visual contrast between a stitched three-tool stack and a unified rank-to-revenue workflow, reinforcing the analyst-hours argument
How to run a 30-day evaluation before signing a contract
Vendor demos often obscure critical integration points. A 30-day evaluation, guided by the scorecard rather than sales pitches, reveals a tool's true capabilities when applied to real client data.
- Week one: Select two live client accounts with distinct profiles—one heavily branded and one focused on acquisition. Connect Search Console, GA4, and the CRM. Verify that the tool preserves query-page pairs at full granularity and propagates the branded-query segmentation now native to Search Console 4. If branded flags are lost at the dashboard level, the revenue calculations will be flawed.
- Week two: Audit SERP feature logging. Choose ten commercial queries where an AI Overview appeared in the last quarter and check if the tool links feature presence to the CTR observed in Search Console 1. A tracker unable to reconcile these two aspects is not accurately modeling the SERP users actually experience.
- Weeks three and four: Conduct a full reporting cycle from beginning to end. Track analyst hours, count manual joins, and assess whether a client CFO could easily follow the path from ranking changes to booked revenue without needing additional interpretation. If the process requires a spreadsheet, the contract is for reporting, not for comprehensive measurement.
Frequently Asked Questions
References
- 1.Using Search Console and Google Analytics Data for SEO.
- 2.An improved way to view your recent performance data in Search Console.
- 3.The new Search Console Insights report is here.
- 4.Introducing the branded queries filter in Search Console.
- 5.Impact Of Ranking Of Organic Search Results On The Incrementality Of Search Ads.
- 6.You are how (and where) you search? Comparative analysis of web search behavior using web tracking data.
- 7.Exploring the Impact of SERP Features on Organic Click-through Rates.
- 8.AIO Impact on Google CTR: September 2025 Update.
- 9.Marketing Mix Modeling and Attribution.
- 10.Attribution, Marketing-Mix Models, and Individual-Level Incrementality.