
Key Takeaways
- Google Search Console anchors the visibility layer as the authoritative source for impressions, clicks, and query-URL data, though its 16-month retention and export limits require BigQuery piping for portfolio use 7.
- Search Console's AI features reporting introduces a second visibility stream for AI Overviews, forcing agencies to standardize whether AI-feature impressions count toward KPIs or sit alongside classic organic 9.
- GA4 with data-driven attribution governs the behavior layer, but model shifts can change reported credit without campaign changes, making BigQuery exports and per-client attribution documentation essential 6.
- Semrush covers rank tracking, share-of-voice, and backlink audits as leading indicators, but its native dashboards should feed the reporting layer rather than be shown directly to clients 1.
- Ahrefs occupies the same layer as Semrush, with strengths in deep link indexing and content gap analysis; standardizing on one tool matters more than the vendor choice for scaled agencies 1.
- Looker Studio unifies Search Console, GA4, CRM, and rank data into one client view, but template maintenance across dozens of accounts pushes agencies to pair it with BigQuery 1.
- AgencyAnalytics and Whatagraph-class platforms cut analyst hours through pre-built connectors and templated widgets, though custom attribution modeling still requires BigQuery and Looker Studio 3.
- CRM and call tracking integrations close the ROI chain by tying organic sessions to pipeline and revenue, which depends on persistent GA4 client IDs and GCLIDs rather than the specific platform 4.
- Vectoron operates as an orchestration layer above the reporting stack, consuming tool data to generate ranked, approval-gated recommendations that shorten decision-making after reports are produced.
Why the ROI Chain Beats the Feature Checklist
Most SEO tracking tool comparisons focus on feature density, such as keyword database size or backlink index freshness. However, agency leads managing multiple client accounts face a different challenge: justifying organic budgets against paid channels that already have a clear spend-to-revenue ratio. Feature counts don't address this. The ROI chain does.
This chain spans from impression to click, session, event, lead, opportunity, and finally, closed revenue. No single platform covers all these stages. Current reporting typically involves a suite of tools: Search Console for visibility, GA4 for user behavior, Looker Studio for presentation, a CRM or call tracking system for revenue, and a rank and backlink tool like Semrush or Ahrefs1. The key is whether this stack can track a click through to a booked opportunity without manual spreadsheet intervention.
The core issue is attribution policy, not just tooling. A recent NBER study on causal ad measurement found that predicted incrementality had an R-squared of 0.88, significantly outperforming the industry-standard 7-day last-click model's 0.19 in explaining incremental conversions per advertising dollar10. While this study focused on paid advertising, it highlights that last-click attribution often explains only a small fraction of the variance that truly matters. Agencies that rely on default attribution without understanding its limitations risk producing reports their own analysts wouldn't trust. This article evaluates nine tools based on their contribution to the ROI chain and where attribution policies must be established before tool selection.
The Six Metric Categories Every Agency Stack Must Cover
Before evaluating specific platforms, agencies need a common framework for client-facing reports. Reporting guidelines for agencies typically identify six essential categories for any robust SEO tracking tool stack:
- Traffic
- Engagement
- Conversion
- Keyword performance
- Backlinks
- Local metrics
These categories are not equally weighted2. Traffic and keyword performance represent the initial stages of the ROI chain, while engagement and conversion describe user actions. Backlinks and local metrics serve as leading indicators for future visibility.
For a portfolio manager, this means mapping coverage. No single platform in a typical stack reports on all six categories with equal accuracy. Search Console is the authoritative source for keyword performance and impression-to-click data. GA4 handles engagement and conversion events. Rank and backlink tools provide competitive keyword tracking and link acquisition data. Local metrics, including Google Business Profile insights and map-pack rankings, usually require a dedicated integration.
Standardizing these six categories across all client reports offers two main benefits. First, it forces the agency to designate a single system of record for each category. Second, it prevents situations where account managers and analysts present conflicting data from different platforms during QBRs. The following section maps how nine tools contribute to these categories and identifies any gaps.
Nine Tools, Mapped to the ROI Chain
Visibility Layer: Google Search Console
Search Console is fundamental because it's the only tool that accurately reports what Google displayed and what users actually clicked. Google's own guidance emphasizes Search Console for monitoring and optimizing a property's performance on Google Search7. For agencies, it serves as the system of record for impressions, clicks, average position, and query-URL pairs at the property level.
However, its limitations are clear: sampled queries, a 1,000-row export limit in the UI, and 16-month data retention make it insufficient as a standalone reporting solution for a large client portfolio. The practical approach is to pipe Search Console data into BigQuery via bulk export, then integrate it with GA4 and CRM data in the reporting layer. This transforms Search Console from a manual, per-client login task into a queryable dataset that supports quarter-over-quarter trend analysis without repetitive report pulling.
Search Console is crucial for keyword performance and the impression-to-click handoff but does not track anything beyond the click.
Visibility Layer: Search Console AI Features Reporting
Google's 2026 Search Central announcement introduced performance reporting for AI features, allowing users to see which URLs appeared within AI-driven surfaces9. For agencies, this provides the first measurable data point for visibility within AI Overviews and similar experiences, positioning it as a critical component of the visibility layer.
This reporting is distinct from the traditional performance report, meaning QBRs now involve two visibility streams: classic organic and AI-feature appearances. A property might experience a decline in blue-link clicks while gaining AI-feature impressions for the same query, making a single-number visibility summary misleading.
Operationally, agencies must decide how to treat AI-feature impressions: whether they contribute to the overall visibility KPI, are reported separately, or are used for context until click behavior is better understood. Standardizing this decision across clients prevents inconsistent narratives.
Behavior Layer: GA4 with Data-Driven Attribution
GA4 manages the middle of the ROI chain: session behavior, event completion, and cross-channel conversion credit. It's where organic click data becomes an event that a CRM can track. Since 2023, GA4 has defaulted to data-driven attribution, removing several rule-based models from standard reports and pushing custom modeling to BigQuery6. This default significantly impacts how organic search is credited in client reports.
Data-driven attribution reallocates conversion credit based on observed path contributions, rather than a fixed last-click rule. For industries with long consideration cycles, such as legal or healthcare, this typically shifts more credit to organic assist paths and less to direct or branded last touches. The reported numbers can change substantially due to model shifts alone, even without changes in campaign execution.
Two operational steps are crucial:
- Enable the GA4 BigQuery export for every client property to ensure historical event-level data is retained and can be re-modeled.
- Document the active attribution model, lookback window, and conversion event definitions in a per-client attribution sheet that account managers can reference in every QBR.
Without this documentation, model changes can be misinterpreted as performance changes, undermining the agency's credibility.
Rank and Backlink Layer: Semrush
Semrush functions as a competitive intelligence and rank tracking tool. The 2026 reference stack for ROI-focused SEO reporting includes enterprise SEO tools like Semrush or Ahrefs as one of five components, alongside Search Console, GA4, Looker Studio, and CRM/call tracking1. This emphasizes that rank tracking is a leading indicator input to the reporting layer, not a standalone client-facing dashboard.
For agencies managing portfolios, its useful features include:
- Project-level position tracking for defined keyword sets
- Share-of-voice trending against competitors
- Backlink audit streams that inform link acquisition KPIs
- The Site Audit crawler to track technical debt, complementing Search Console's coverage data
A common mistake is presenting Semrush's native dashboards directly to clients. Rank data should be integrated upstream into Looker Studio or an agency reporting platform, combined with Search Console and GA4 data, to provide clients with a single, consistent view of keyword performance.
Rank and Backlink Layer: Ahrefs
Ahrefs occupies the same functional layer as Semrush in the standard reference stack1, and most agencies choose one over the other. The distinctions are practical: Ahrefs' deep link index for backlink-intensive verticals, its content gap analysis workflows, and Site Explorer for competitor analysis during pitches and renewals.
For agencies scaling across many accounts, standardizing on one rank and backlink tool is more beneficial than the specific vendor choice. This consolidates keyword lists, tag conventions, and competitor definitions into a single schema that seamlessly integrates into the reporting layer.
Backlink data plays a specific role in QBRs: it's a leading indicator for future visibility. Reporting new referring domains, lost links, and anchor distribution monthly keeps the link acquisition program visible to the client, especially during periods of fluctuating visibility.
Reporting Layer: Looker Studio
Looker Studio serves as the presentation layer in the standard reference stack, integrating data from Search Console, GA4, CRM, and rank/backlink tools1. Its primary value isn't just visual appeal, but its ability to combine data sources at the report level, presenting a single KPI number to the client and replacing multiple vendor dashboards with a unified, governed view.
The effort lies in the build phase. Creating a Looker Studio template that unifies Search Console, GA4, and rank data for one client might take a few hours. However, replicating this across 40 accounts, maintaining data source authentication, and updating the template as GA4 or Search Console fields change becomes a significant ongoing task for analysts.
Agencies that standardize on Looker Studio often pair it with BigQuery as the data joining layer, rather than connecting sources directly. This is because direct connectors can hit sampling limits and API quotas when managing a large portfolio.
Reporting Layer: AgencyAnalytics or Whatagraph-Class Platforms
Purpose-built agency reporting platforms aim to reduce the maintenance burden associated with Looker Studio. Current 2026 tool guidance highlights their value in helping agencies track campaign performance across multiple clients without manually copying data from various platforms into spreadsheets3. They are designed to address this specific inefficiency.
The trade-off is between depth and scale. Platforms like AgencyAnalytics and Whatagraph offer pre-built connectors for Search Console, GA4, Semrush, Ahrefs, Google Business Profile, and common CRMs/call tracking systems. Analysts build reports using templated widgets instead of SQL. The limitation is custom modeling: complex joins, model comparisons, and BigQuery-driven attribution work typically don't fit within their widget libraries.
For portfolios where 80% of client reports share a similar structure, these reporting platforms save significant analyst hours compared to Looker Studio. The remaining 20% of accounts with unique attribution needs usually continue with a BigQuery plus Looker Studio setup, managed by a senior analyst.
Revenue Tie-Back Layer: CRM and Call Tracking Integrations
This layer is where the ROI argument is ultimately validated. Recent guidance on SEO reporting tools emphasizes revenue attribution—specifically connecting SEO activity to CRM pipeline and closed deals—as the most impactful capability in the stack. The infrastructure for this connection is considered more important than the specific tool choice4. For agencies serving sectors like law firms, DSOs, senior living, and home services, call tracking is also essential here, as a significant portion of organic conversions occur via phone.
The technical work involves ensuring GA4 client IDs and GCLIDs persist from the landing page into hidden form fields and call tracking session data, and then into the CRM as first-party fields on the lead record. Subsequently, the CRM's opportunity and closed-won stages are exported back to the reporting layer, linked by the same identifiers, allowing organic sessions to be tied to pipeline value and revenue.
Common CRMs in these verticals include Salesforce, HubSpot, and specialized systems like Clio Grow or PatientPop. Popular call tracking platforms include CallRail and CallTrackingMetrics. The choice of platform is less critical than maintaining consistent identifier discipline. Without persistent identifiers, revenue tie-back becomes a monthly reconciliation task rather than a queryable data point.
Orchestration Layer: Vectoron
The nine-tool stack described so far reports on outcomes but doesn't dictate actions. That decision-making process typically falls to an analyst who compiles Search Console, GA4, and CRM data into a recommendation deck for team discussions. At a portfolio scale, this becomes a significant labor bottleneck.
An orchestration layer operates above the reporting stack, complementing rather than replacing its components. Its function is to interpret the combined data signals, prioritize actions based on client goals, and route recommended tasks to a human for approval before execution. Vectoron operates in this layer, coordinating specialist strategists for content, SEO, PPC, backlinks, social, and call intelligence through an approval-first workflow. It doesn't replace Search Console, GA4, Semrush, or Ahrefs. Instead, it consumes their data, along with CRM signals, to generate ranked, reasoned recommendations that account managers can approve or reject.
The economic benefit lies in optimizing portfolio labor. While reporting tools reduce the time spent building reports, an orchestration layer like Vectoron significantly shortens the decision-making process after a report is generated.
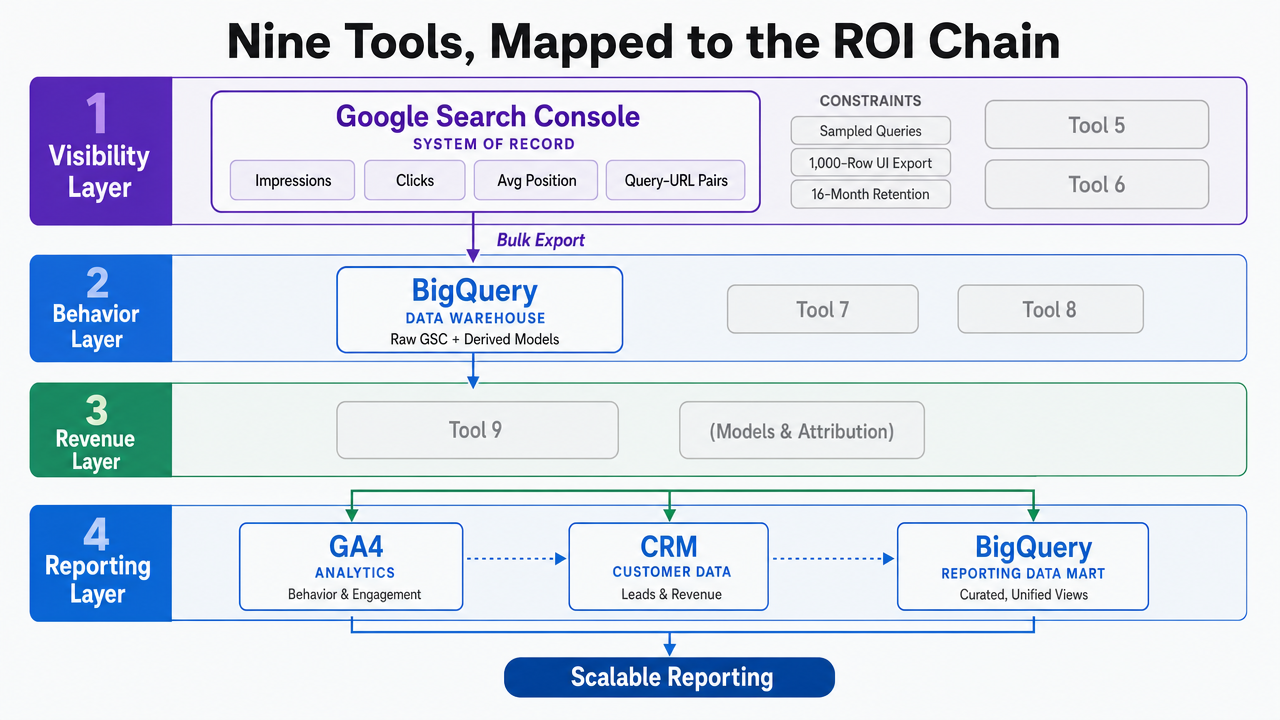 Visualize the four-layer ROI chain and how the nine tools map to each layer, directly supporting the section's stack framework
Test Full-Funnel SEO Tracking in Real Time
Validate your agency’s ROI reporting workflows using live data across actual client campaigns—no sandbox restrictions.
The Three-Model Comparison Standard as an Evaluation Rubric
The key evaluation question for any SEO tracking tool isn't whether it reports conversions, but whether it can report the same conversions in three different ways without requiring an analyst to rebuild the export. Current attribution framework guidance recommends a three-model comparison standard, presenting last-click, data-driven, and assisted conversions in every report, rather than relying on a single view6. This standard quickly differentiates tools.
Search Console and rank/backlink tools are outside this comparison because they measure visibility, not conversion credit. GA4 directly supports this comparison, provided the BigQuery export is enabled and lookback windows are documented per client5. Looker Studio and agency reporting platforms succeed or fail based on whether the analyst has configured all three model outputs into the template, not on inherent platform capabilities. CRM and call tracking integrations can support the comparison only if persistent identifiers are consistently in place.
This rubric acts as a clear filter. A tool that forces a single attribution view into client reports risks being blamed when model defaults change. One that exposes all three models side-by-side empowers the account team with a defensible narrative in every QBR.
Portfolio Economics: Consolidating the Reporting Layer
The argument for consolidation isn't about tool cost, but about analyst hours per client per month, multiplied across the entire client base. Current 2026 guidance directly addresses this inefficiency: agencies waste time when analysts manually transfer data from multiple platforms into spreadsheets for client reports3. This labor scales linearly with the number of accounts and determines the efficiency of the reporting layer.
The financial modeling for an agency lead is straightforward, even without specific vendor pricing.
H : analyst hours per client per month for report assembly
N : the number of client accounts
R : the loaded hourly cost of a mid-level analyst
Manual assembly across the four functional layers of the ROI chain results in monthly reporting labor calculated as H × N × R. For an agency with 40 accounts, even a conservative H can result in an annual cost equivalent to a senior hire that the agency might otherwise deem unaffordable.
| Layer | Representative tools | Manual H per client |
|---|---|---|
| Visibility | Search Console, AI features report | ~0.5–1.0 |
| Behavior and attribution | GA4, BigQuery exports | ~1.0–2.0 |
| Rank and backlink | Semrush or Ahrefs | ~0.5–1.0 |
| Reporting and orchestration | Looker Studio, agency reporting platforms | ~1.5–3.0 |
Consolidating the reporting and orchestration layer eliminates the last row and reduces the first three by centralizing data joins in BigQuery, performed once rather than for each report. The hours saved can then be reinvested in senior analyst work that directly impacts client retention and growth, such as attribution audits, model comparisons, and crafting client-specific narratives for QBRs.
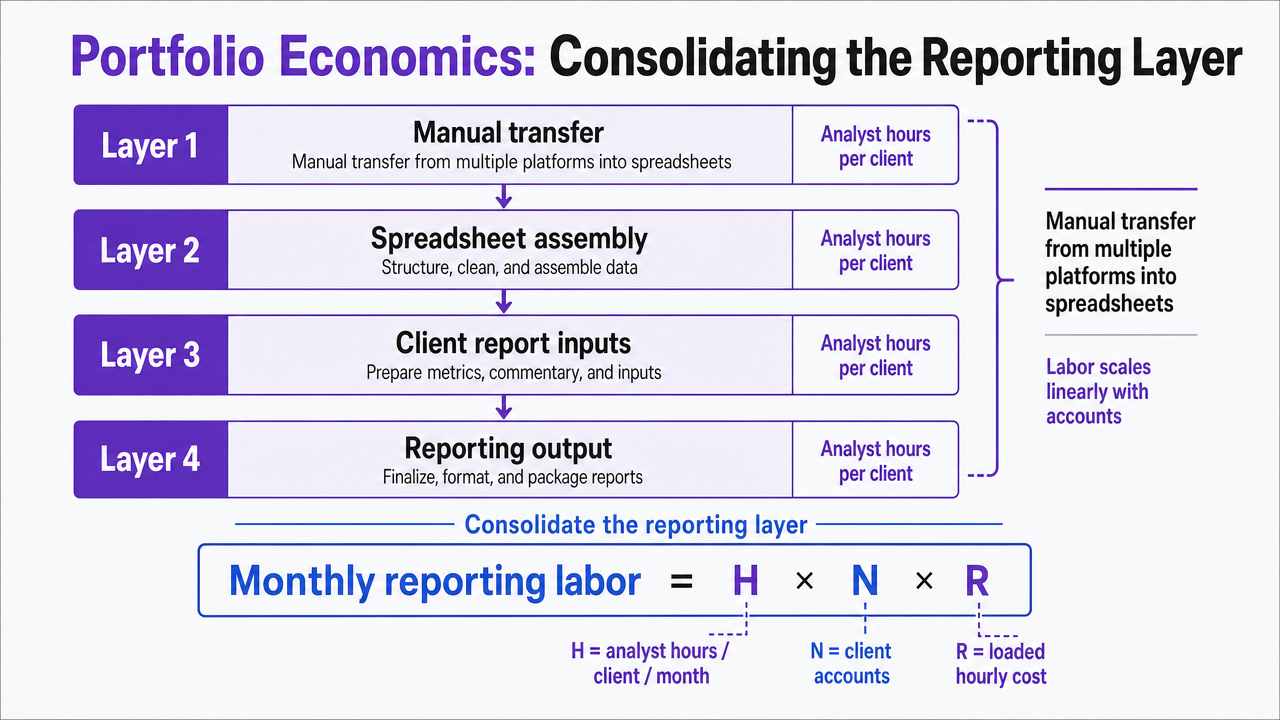 Visualize the manual analyst-hours-per-client breakdown across the four stack layers from the table in this section
See How Leading Agencies Quantify SEO Impact Across Every Client
Connect with our team to learn how agency leaders use unified tracking and reporting frameworks to demonstrate ROI, automate data consolidation, and scale results—without expanding analyst headcount.
Advanced Attribution: When Bayesian and Shapley Methods Earn Their Keep
Most agency portfolios don't require Bayesian or Shapley-based attribution. They primarily need GA4's data-driven model properly documented and a three-model comparison in client reports. Advanced methods are justified for a narrower set of accounts: those with long sales cycles where ad decay and half-life estimates significantly alter credit assignment, and multi-touch journeys where rule-based credit might appear defensible but lacks theoretical rigor.
A Bayesian attribution approach can account for ad decay, interactions, and customer heterogeneity, providing usable error bounds on ad effects and half-life estimates instead of just point values11. This is crucial when clients question the confidence level of organic contribution figures. A counterfactual adjusted Shapley value, proposed as an axiomatic attribution metric, addresses how credit should be distributed across touchpoints when direct causal effects are difficult to observe12. Both methods are typically implemented in BigQuery or a dedicated modeling environment, not within GA4 or standard reporting platform widgets.
The decision to use advanced attribution is triggered by account size and sales cycle length. For top-revenue accounts with consideration windows exceeding 60 days, a senior analyst might run custom models quarterly and reconcile them against the three-model standard. For the rest of the portfolio, the standard rubric remains sufficient.
Building the Attribution Policy Before Buying the Tool
Tool selection is a secondary concern. The primary decision is establishing the attribution policy that the agency will uphold for every client, and this policy should be defined before any purchase. Google's own attribution playbook outlines the sequence: define marketing goals, map path length and time to conversion, and compare models to understand how value shifts across channels8. None of these steps require a specific vendor.
A practical policy document, ideally one page per client, should answer four key questions:
- Which conversion events qualify as a lead, an opportunity, and closed revenue?
- Which lookback window aligns with the sales cycle?
- Which models will be presented side-by-side in the QBR?
- Who authorizes changes to the default model?
This last point is critical, as many agencies have been caught off guard by GA4's data-driven default shifting credit without re-approval5.
By defining the policy first, the buying committee can identify the tools truly needed, rather than purchasing based on habit. If tools are bought first, they often dictate the policy, forcing the agency to adopt whatever view the vendor's default produces.
Frequently Asked Questions
References
- 1.Best SEO Reporting Tools for Businesses in 2026: Which Ones Actually Prove ROI.
- 2.Top 8 SEO Reporting Tools: Compare, Automate, & Impress Your Clients.
- 3.15 Best SEO Reporting Tools We Trust After Hands-On Testing (2026).
- 4.15 Best SEO Reporting Tools for Revenue Attribution.
- 5.Attribution Modeling for SEO: A 2026 Technical Guide.
- 6.Marketing Attribution for SEO | Models, Tracking, Reporting.
- 7.Search Engine Optimization (SEO) Starter Guide.
- 8.Attribution Playbook - Google.
- 9.Introducing Search Generative AI performance reports in Search Console.
- 10.Predicted Incrementality by Experimentation (PIE) for Ad Measurement.
- 11.Bayesian Modeling of Marketing Attribution.
- 12.An Axiomatic Framework for Attribution in Online Advertising.
- 13.Attitudes to Digital Advertising Report.