
Key Takeaways
- Rank comparisons only mean something when engine, device, country, and locale are locked per project; drifting configurations produce deltas that describe settings rather than competition, so mobile-desktop parity must also be audited before treating any gap as a competitive signal.
- Average position hides which queries moved and whether clicks followed, so rank charts should sit beside CTR and click series on the same visual, following the bubble-chart pattern Google demonstrates in Search Central 1.
- Organic rank, feature eligibility, and feature display are three separate events per query, and collapsing them into one share-of-voice score hides which one actually moved, especially across AI Overviews, local packs, and rich results.
- Search Console exports are filtered samples, not query censuses: anonymized queries are excluded, the interface caps at 1,000 rows, and the API tops out around 50,000 rows per day per site and search type 3, so benchmarks must declare their sampling rules.
- Copying visible attributes of ranking pages imports correlation as causation and, during core updates, risks crossing Google's scaled content abuse policy 11; gap analyses should end in a tested hypothesis, not a templated production spec.
Why Rank Observations Are Samples, Not Verdicts
Every number a SERP competitor ranking tool produces is a sampled observation. It reflects one crawler, one location, one device profile, one moment, and one interpretation of a query that Google itself may render differently for the next user. Agency SEO leaders who forget that distinction end up defending client strategies built on artifacts of measurement rather than evidence of demand.
The failure mode is rarely the tool. It is the workflow around it. Google's own guidance on ranking systems emphasizes that multiple systems evaluate content and relevance, which means no single scraped position can be reverse-engineered into a causal story 12. The same guidance on debugging traffic drops recommends comparing date ranges, checking regional query patterns, and separating the search surface before drawing conclusions 2.
This piece walks through the five interpretation mistakes that most often erode agency credibility across a book of 15 to 80 accounts:
- fixing the wrong search context,
- treating average position as business performance,
- ignoring SERP features and AI surfaces,
- benchmarking on incomplete keyword sets, and
- converting correlation into strategy without validation.
Each is a discipline problem, not a licensing one.
Mistake 1: Comparing Competitors Without Fixing the Search Context
Engine, Device, and Geography Must Be Declared Before the Number Means Anything
A ranking of 4 is not a fact. It is a fact conditional on an engine, a device profile, a geographic point, a language, and a moment in time. When those conditions drift silently between the tracked client and the tracked competitor, the comparison stops measuring competition and starts measuring configuration.
Search behavior itself confirms why the conditions matter. A peer-reviewed comparative study of Google and Bing users found that engine choice produces meaningfully different click patterns and first-page dominance, which means a competitor benchmark that pools engines or ignores engine share in the client's market will overstate or understate exposure 6. The same logic applies to country and device: aggregate averages hide the segments where the client actually competes.
The operational discipline is straightforward. Every tracked keyword in a competitor set should carry an explicit declaration of engine, device, country, and, where relevant, city or postal code. When a junior analyst pulls a share-of-voice chart into a client QBR, that chart should name the surface it describes rather than presenting an abstract score. Google's own troubleshooting guidance reinforces the point by recommending regional query review rather than aggregate traffic when investigating movement 2.
For agencies running 15 to 80 accounts, the internal control is a locked configuration per client project. Any change to device, locale, or engine mid-quarter invalidates trended comparisons and needs to be treated as a schema change, not a filter adjustment. Otherwise, competitive movement charts describe the tool's settings history more than the client's market.
The Parity Check Between Mobile and Desktop Crawls
Google uses the mobile version of site content, crawled with a smartphone agent, for indexing and ranking 7. That fact makes the mobile rank the primary observation and the desktop rank a secondary one, yet many agency dashboards still lead with desktop because the visual layout is easier to screenshot.
The consequence is a quiet parity problem. When a competitor's mobile template renders different content, metadata, structured data, or internal links than its desktop template, its mobile rank diverges from its desktop rank for reasons that have nothing to do with the client's own work. Comparing the client's desktop position against a competitor's mobile position, or vice versa, produces a delta that no strategic action can move.
A defensible workflow tracks both surfaces for every priority query and flags any gap wider than a set threshold, for example a difference of five positions or more, for a parity audit. The audit checks whether the competitor's mobile page contains the same primary content, canonical, schema, and links as its desktop version. Only after that check does a rank delta become interpretable as a competitive signal rather than a rendering artifact.
Mistake 2: Treating Average Position as Business Performance
Why Rank, CTR, and Clicks Have to Be Read on the Same Chart
Average position is the metric most likely to survive a client QBR unchallenged and least likely to describe what actually happened. A domain that moves from position 8.4 to 6.2 across a tracked keyword set looks like progress on a dashboard. It may also describe a portfolio where the queries that convert drifted downward while low-intent long-tail queries improved, producing a better average and worse revenue.
The click distribution behind that arithmetic is not linear. A peer-reviewed comparative study of Google and Bing users found that 97.11% of Google clicks and 99.49% of Bing clicks landed on first-page results, with the top five Google positions capturing more than 86% of clicks in the observed sample 15. The sample reflects a specific user population and query mix rather than every market, but the direction is consistent enough to make one point unavoidable: a movement from position 3 to position 5 is not equivalent to a movement from position 23 to position 25, and averaging them into a single client-facing number hides the difference.
Google's own analytics guidance points to the fix. The bubble-chart example in Search Central pairs average position with CTR and clicks on the same visual, using bubble size for total clicks and color for device category, so an analyst can see whether a rank change actually moved traffic or only shifted an average 1. Read this way, a competitor gaining two positions on a query that already sits at position 18 is a curiosity. The same competitor moving from position 6 to position 3 on a query worth 40% of the client's category clicks is a strategic event.
The reporting discipline is to retire standalone average-position charts from client decks and require every rank chart to sit next to the CTR and click series for the same queries. Ranking changes without a corresponding click change describe the SERP, not the business.
Using the 24-Hour Search Console View Without Overreacting
In December 2024, Google introduced a 24-hour Search Console view that reports clicks, impressions, average CTR, and average position with hourly granularity and a delay of only a few hours, broken down by query, page, and country 4. For agencies triaging volatility across 15 to 80 accounts, the new latency is genuinely useful. It also creates a new failure mode.
Hourly data invites hourly interpretation. A competitor tool showing a two-position drop at 11 a.m. paired with a Search Console click dip in the same window looks like a causal chain and often is not. Single-day movement can reflect an ongoing crawl, a personalization change, or a demand pattern that reverses by evening.
Google's traffic-drop guidance sets the countervailing rule: compare recent periods against prior periods or year-over-year windows across the available 16 months of data before drawing conclusions 2. The workable pattern is to use the 24-hour view for early detection and route anything that looks material into a seven-day or 28-day comparison before it enters a client report. Anything shorter is monitoring, not measurement.
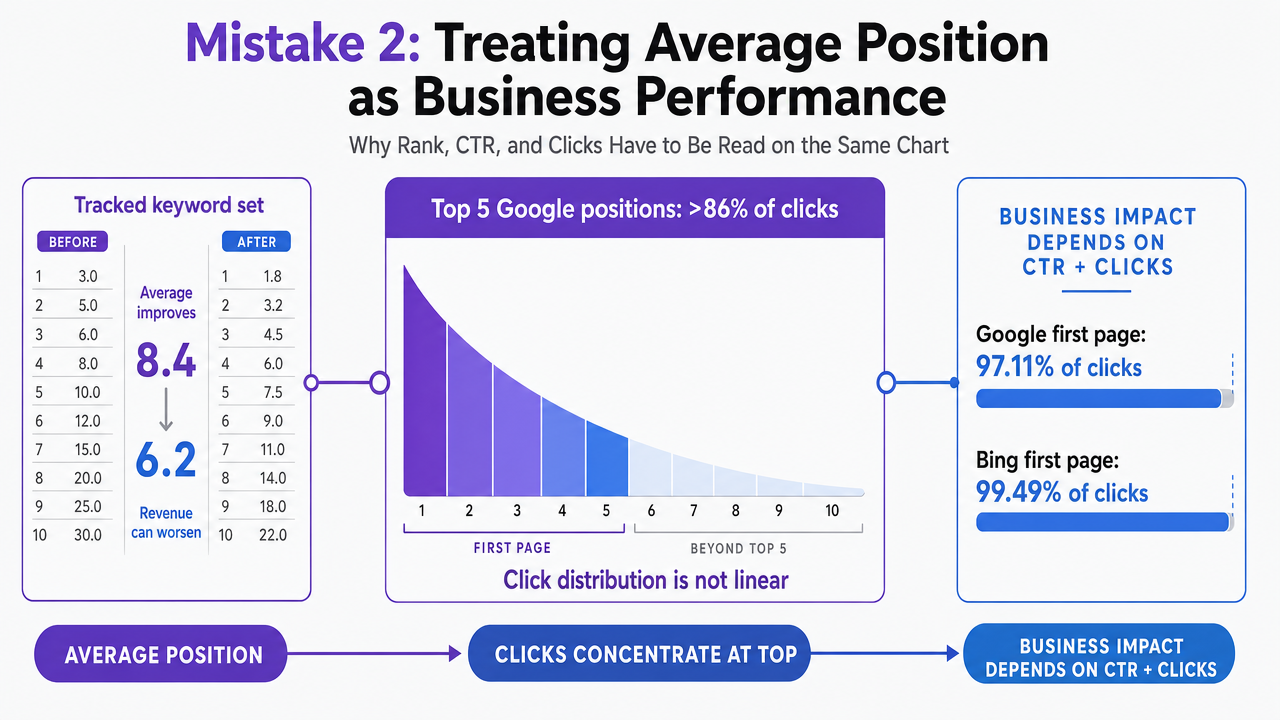 Visualize the click concentration research that justifies why average position is misleading, using the peer-reviewed Google vs Bing first-page click share cited in the section
Test real-time SERP competitor insights risk-free
See how live competitor data sharpens your ranking strategy before committing to a new workflow.
Mistake 3: Ignoring SERP Features and AI Surfaces as Separate Observations
Rank Eligibility, Feature Eligibility, and Feature Display Are Three Different Events
A single query no longer produces a single result surface. It produces a stack: an organic list, a local pack, an AI Overview with supporting links, a video carousel, a review-rich product block, an event panel, and whatever else Google decides the query intent justifies at that moment. A SERP competitor ranking tool that reports one number per query per competitor has already collapsed at least three independent events into one score.
The three events are worth naming precisely:
Rank eligibility : Whether the competitor's page is indexed and can appear in ordinary organic results.
Feature eligibility : Whether the page qualifies for a rich result, a supporting link, or a pack slot. Google's structured data gallery catalogs the features a page can qualify for, including LocalBusiness, Product, Review, Event, Video, and other rich-result types, and Google notes that eligibility does not guarantee display 9.
Feature display : Whether the feature actually renders for a given query, device, and location on a given day.
AI surfaces sit inside this same distinction. Google states that AI Overviews and AI Mode surface links to help users explore information and that a page needs to be indexed and eligible for ordinary Search snippets to qualify as a supporting link, with no additional technical requirement beyond that 5. In practice, a competitor can hold organic position 4, remain eligible for an AI Overview supporting slot, and still not appear in the Overview on a given rendering. Three different observations, one query.
The reporting discipline is to track eligibility and display as separate columns from organic rank and to stop letting a share-of-voice score average them into a single trendline. When a client asks why a competitor's visibility grew, the analyst should be able to point to which of the three events moved.
If You Manage Multi-Location Clients: Pack, Reviews, and Organic as Three Cells Per Query
For agencies managing multi-location clients, the same mistake compounds because every location renders its own SERP. A dental group with 42 offices, a home services brand with 18 branches, or a senior living operator with 25 communities does not have one competitive picture per query. It has one per location per query per observation type.
The measurement math is the constraint. For a portfolio with N locations tracked against Q priority queries and three separate observation types per query (local pack presence, review-rich result presence, organic blue-link position), the reporting matrix contains N x Q x 3 tracked cells per reporting cycle. A 25-location client with 40 priority queries produces 3,000 observation cells per cycle before any competitor set is added. Collapsing that matrix into an average position or a single share-of-voice number is not simplification. It is data loss.
Two operational rules keep the matrix defensible:
- Track pack presence per location as a distinct field from organic rank, because a competitor can hold the pack while sitting at organic position 12 or hold organic position 3 while missing the pack entirely.
- Validate local entity signals and rich-result eligibility with the Rich Results Test and URL Inspection rather than inferring them from rank position, which is the workflow Google recommends for LocalBusiness structured data 8.
Only after those two steps does a location-level competitive delta describe something a strategist can act on.
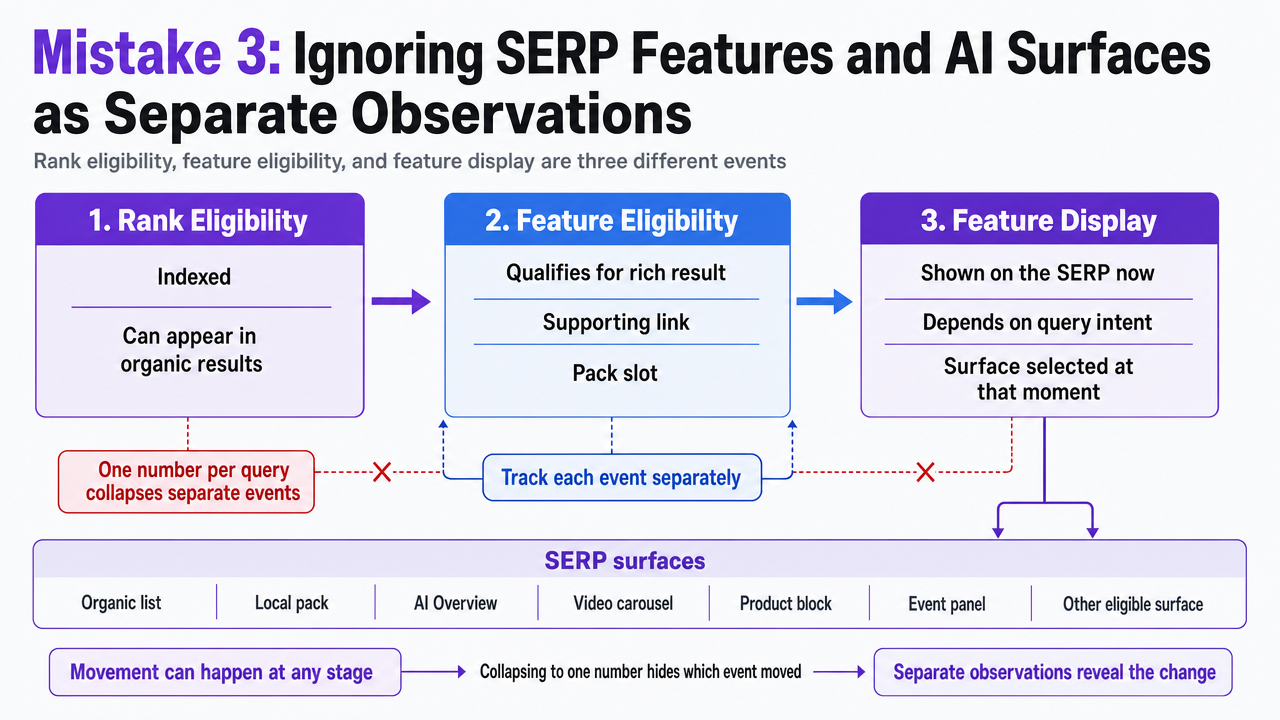 Visualize the three distinct observation events (rank eligibility, feature eligibility, feature display) that the section argues must be tracked separately, since collapsing them hides which event moved
Mistake 4: Building Benchmarks on Incomplete or Unstable Keyword Sets
Search Console Exports Are Filtered Samples, Not Query Censuses
A competitor benchmark is only as honest as the keyword set that defines it. When that set comes from a Search Console export, an analyst is working with a filtered, capped, and privacy-adjusted view of the client's query universe rather than a full record of every search that produced an impression.
Google's own documentation is explicit about the filtering. Anonymized queries are excluded when they are issued by only a small number of users over a two-to-three-month period, which removes the long tail from the export before the analyst ever sees it 3. The Search Console interface caps exports at 1,000 rows, and the API limit is described as up to 50,000 rows per day per site and search type, subject to availability 3. For a client with tens of thousands of impression-generating queries per quarter, both ceilings clip the distribution somewhere well short of the actual tail.
The consequence for competitor work is that a benchmark built by intersecting a client's Search Console export with a competitor's tracked keyword list is comparing two different samples pulled under two different sampling rules. Share-of-voice numbers derived from that intersection describe the overlap of two filtered views, not a shared market. An analyst who reports the resulting delta as a competitive gap is reporting a sampling artifact with a business label.
The workable discipline is to treat every keyword set as a stated sample with declared inclusion rules: source, extraction date, row cap applied, privacy filter acknowledged, and any manual additions logged. When a client asks whether a benchmark covers their full market, the honest answer names the sample rather than implying a census.
Date-Range Discipline When Investigating Competitor Movement
Unstable keyword sets have a temporal dimension as well. A competitor's tracked list on Monday and the same list on Friday can differ because queries were added, retired, or reclassified, and any trended comparison across those two dates measures list churn alongside actual rank movement.
Google's troubleshooting guidance sets the reference standard. The recommendation is to examine up to the last 16 months of data and compare recent periods against prior periods or the same period year over year rather than reading movement off a single window 2. The same guidance instructs analysts to review queries and pages in the relevant region and to check whether changes coincide with ranking updates or technical issues before assigning cause 2.
For an agency investigating why a competitor appears to have gained share, the operational rule is to freeze the keyword set for the comparison window, restate any additions or removals in a change log, and run the same window on both sides of the delta. A share-of-voice movement calculated against a keyword list that grew by 12% mid-quarter is not evidence of competitive gain. It is evidence that the list changed.
Pinpoint Competitor Ranking Gaps with Data-Driven SERP Insights
Connect with our team to see how advanced SERP competitor analysis can reveal actionable opportunities and prevent common ranking tool missteps for complex, multi-site portfolios.
Mistake 5: Turning Ranking Correlations Into Strategy Without Validation
Copying the Ranking Page Is Not a Content Plan
The reverse-engineering workflow is familiar: pull the top ten ranking URLs for a target query, extract shared attributes (word count, heading structure, entity coverage, backlink profile), and hand a junior analyst a brief that instructs the client's next page to match or exceed those attributes. The workflow feels rigorous. It is also a category error.
Google's ranking systems guide states that multiple systems evaluate content and relevance, and it deliberately avoids publishing a scoring formula that could be reproduced from visible page characteristics 12. What a competitor page displays on the surface is not what earned it the position. The page ranks inside a context that includes site-level signals, historical performance, user interaction patterns, and content quality assessments no scraper can see. A brief that copies the visible features imports the observable half of a correlation and treats it as the causal whole.
The helpful-content guidance sharpens the problem. Google says its automated ranking systems are designed to prioritize helpful, reliable information created to benefit people rather than content produced primarily to rank 10. A gap-analysis workflow that instructs the analyst to cover the same subtopics the top pages cover, in the same order, at a similar length, is optimizing for the shape of ranking pages rather than for the reader the client actually serves. When the resulting page underperforms, the tool did not fail. The interpretation did.
The operational rule is that a competitor-gap report should end in a hypothesis, not a specification. The senior editor's job is to test whether the identified gap reflects a real reader need in the client's audience and, if so, whether the client is qualified to answer it better than the incumbent. Any brief that skips that judgment step is manufacturing pages against a scraped template.
Core Updates, Scaled Content Abuse, and the AI-Assisted Production Boundary
A competitor's ranking movement observed during or immediately after a core update is not a strategic signal. Google's guidance recommends waiting at least a full week after a core update completes before analyzing Search Console data and distinguishes a small position change, such as 2 to 4, from a large change, such as 4 to 29 13. Acting on mid-update rank deltas commits a client to a plan built on a moving target.
The March 2024 update raised the interpretive stakes further. Google described the update as more complex than usual because it involved changes to multiple core systems and said there is no longer one signal or system used to identify helpful results 14. A share-of-voice shift during a window like that reflects several overlapping system changes, and attributing it to a single competitor tactic is guesswork wearing a chart.
The same update introduced spam policy changes that matter directly to any agency scaling AI-assisted production. Google's current policy defines scaled content abuse as generating many pages primarily to manipulate rankings rather than help users, and it explicitly lists generating many pages with generative AI tools without adding value as an example 11. The boundary is not the production method. It is whether each page adds original value for the reader. An agency that responds to a competitor gap analysis by scaling templated pages against a scraped keyword matrix is walking toward the policy line, not away from it.
A Measurement System a Senior Analyst Can Run Monday Morning
The fix for all five mistakes is the same: stop reading rank as a business metric and start reading it as one layer in a four-layer stack. Each layer answers a different question, and none of them substitutes for another.
- The first layer is the rank observation itself, declared with engine, device, country, and locale locked per client project. This layer answers only where the competitor's page appears under a specified configuration.
- The second layer is Search Console data, read with the sampling caveats intact: anonymized queries are filtered from exports, the interface caps at 1,000 rows, and the API tops out around 50,000 rows per day per site and search type 3. Any keyword set built from an export should carry the extraction date, row cap, and privacy filter in the file header so the next analyst can reproduce the sample.
- The third layer is SERP feature observation, tracked as three separate columns per query: rank eligibility, feature eligibility, and feature display. Collapsing these into a share-of-voice score is the error the earlier sections named.
- The fourth layer is the client's own conversion data, joined to query and landing page so that ranking movement can be tested against booked revenue, qualified calls, or pipeline rather than assumed to correlate.
The reporting artifact that ties the stack together is the one Google itself demonstrates. The Search Central bubble-chart example plots average position, CTR, and clicks on a single visual, using bubble size for total clicks and color for device category, so an analyst can see whether a rank change actually moved traffic or only shifted an average 1. A senior analyst can rebuild that view in any BI tool by Monday. What matters is the discipline behind it: every chart in a client deck should carry its scope, its sample, and its date range on the face of the chart, and no single number should ever stand alone as evidence of competitive gain.
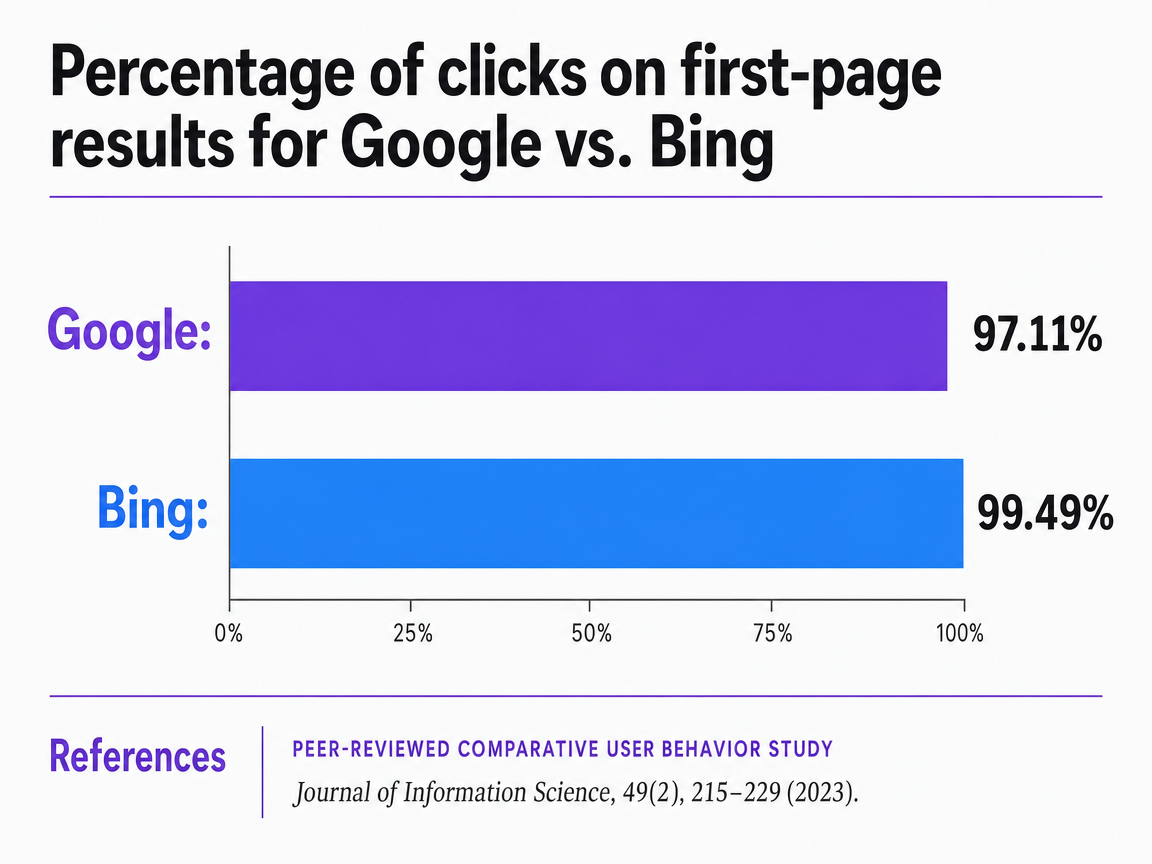 Percentage of clicks on first-page results for Google vs. Bing
A peer-reviewed study comparing user behavior found that clicks are heavily concentrated on the first page of search results for both Google and Bing.
Frequently Asked Questions
References
- 1.Improve SEO With a Bubble Chart.
- 2.Debugging drops in Google Search traffic.
- 3.A deep dive into Search Console performance data filtering and limits.
- 4.An improved way to view your recent performance data in Search Console.
- 5.AI Features and Your Website.
- 6.You are how (and where) you search? Comparative analysis of users’ search behavior on Google and Bing.
- 7.Mobile-first Indexing Best Practices.
- 8.Local Business (LocalBusiness) Structured Data | Documentation.
- 9.Structured Data Markup that Google Search Supports.
- 10.Creating Helpful, Reliable, People-First Content.
- 11.Spam Policies for Google Web Search | Documentation.
- 12.A Guide to Google Search Ranking Systems.
- 13.Google Search's Core Updates | Google Search Central | Documentation.
- 14.What web creators should know about our March 2024 core update and new spam policies.
- 15.You are how (and where) you search? Comparative analysis of users’ search behavior on Google and Bing.