
Key Takeaways
- Position still predicts clicks best, but SERP features, AI Overviews, and layout shifts now explain enough of the residual variance to change client outcomes on their own 2.
- Portfolio monitoring separates three distinct signals: rank volatility for detection, SERP composition for causal explanation, and AI feature exposure as its own surface requiring different content strategy 13.
- Match the observation window to the event class: hourly views for same-day anomalies, weekly views for trend confirmation, and a one-week hold after core updates complete before diagnosing 11, 14.
- Tier accounts by commercial risk and feature exposure rather than billing size, since alert quality and cadence math determine whether monitoring load stays defensible across 40 to 80 clients 16.
Rank tracking has quietly stopped explaining client traffic
The dashboards agencies built their reporting rhythm around were designed for a page that no longer exists. A Google results page in the mid-2010s was mostly a ranked list. A results page in 2025 is a composed layout: an AI Overview panel, a local pack, a featured snippet, product carousels, video thumbnails, sitelinks, and ads that shift position from query to query and day to day. Longitudinal analysis of archived SERPs shows they have become "more diverse in terms of elements, aggregating content from different verticals and including more features that provide direct answers" 3. The ranking column is still there. It just explains less of what happens after impression.
Heads of SEO see the consequence in their weekly client calls. Rankings hold. Impressions climb. Clicks flatten or drop. Search Console will confirm all three at once, and its own documentation warns that impressions count every time a page appears in the SERP regardless of whether a user clicks 6. That gap between visibility and engagement is not a reporting bug. It is the actual signal. Something on the page changed around the ranking, and the client's traffic responded to the composition rather than to the rank.
The peer-reviewed CTR literature now backs what practitioners have been observing. Position remains the strongest single predictor of clicks, but keyword characteristics, result characteristics, and SERP feature presence all show statistically significant effects 2. Treating rank as a proxy for performance was defensible when the page was ten blue links. It is not defensible on a page where a single AI Overview can absorb the query intent before a user reaches the organic listings. The operating question for an agency is no longer whether to monitor beyond rank. It is which additional signals justify the strategist time to interpret them across a client portfolio.
The three signals a portfolio-level monitor has to separate
Rank volatility as a first-principles detection problem
Search volatility is the baseline condition, not the exception. Academic work grounds this plainly: a query at two different points in time returns different documents, and that instability is a property of the system rather than a symptom of any single site's decline 16. Google's own ranking documentation reinforces the point by describing multiple ranking systems operating in parallel rather than a static algorithm producing stable outputs 10. A Head of SEO monitoring a portfolio is therefore running a detection problem: separating noise from signal across hundreds or thousands of tracked queries.
The operating consequence is that rank movement, in isolation, is close to useless as a client-facing metric. A three-position drop for one head term on one day is often reversion to a running mean. The same drop across a cluster of commercial-intent queries on the same domain over five days is a pattern worth escalating. Portfolio-level monitors have to hold two thresholds at once: a per-keyword tolerance band that filters out routine flutter, and a domain-level aggregation that flags when small individual moves correlate into something larger.
Rank volatility is still the cheapest signal to collect and the fastest to compute. It remains the starting layer of any monitoring stack. What it cannot answer is why a ranking moved, or whether the movement will translate into a traffic change at all. That question belongs to the next signal.
SERP composition change: what shifted around the ranking
The second signal is what appeared, moved, or disappeared around the client's listing. A large cross-website analysis of 24 different SERP features found that features exert an overall negative influence on organic CTR, and that top-ranked results are particularly susceptible to decreased CTR when features enter the page 1. The financial stakes of that finding become concrete when paired with current empirical CTR values. A 2024 Aslib study of Google organic results reports average CTRs of 9.28% for position one, 5.82% for position two, and 3.11% for position three 5. The sample covered organic listings on Google and is a snapshot rather than a per-vertical benchmark, but the shape of the curve is what matters for the argument.
Read those two findings together and the "we still rank #1" conversation changes. If a client's head term still holds position one but an AI Overview, a product carousel, and four ads now sit above the organic block, the effective click yield of that #1 has degraded even though the ranking metric has not moved. The CTR curve shows why a one-position drift matters, and the feature research shows why a stationary ranking can still lose clicks. Both effects are composition effects, not ranking effects.
Monitoring composition means tracking, per query, which feature blocks are present, in what order, and at what pixel depth. It also means storing that layout over time so a change can be attributed to a date, not just observed after the traffic has already dropped. This is the signal that lets a strategist walk into a client review with an answer to the question rank tracking cannot address: the position held, but the page around it changed on the fifteenth, and impressions since then have converted at a lower rate. That is a defensible causal story built entirely from monitored SERP data.
AI and generative feature exposure as a distinct surface
The third signal is exposure inside AI features, and it has to be tracked separately from the traditional web result. Google's guidance for site owners is explicit: appearances in AI features such as AI Overviews and AI Mode are counted within overall search traffic in the Search Console Performance report under the Web search type 12. That means an AI Overview citation registers as an impression alongside a standard organic result, and the two are aggregated in the same headline numbers unless a strategist deliberately segments them.
The tooling to do that segmentation now exists at the source. Google introduced dedicated generative AI performance reports in Search Console, reporting impressions, pages, countries, devices, and dates for generative AI features on Search and Discover 13. For an agency, this is the difference between guessing whether a client's traffic softness is AI-driven and reporting the specific query set where AI feature impressions are rising while click yield is falling.
Treating AI exposure as its own signal matters because it feeds a different strategist decision than rank volatility or composition change. Rank volatility tells the team whether to investigate. Composition change tells the team what shifted on the page. AI exposure tells the team whether the query is drifting into a summarization surface where the content strategy needed to earn a citation is not the same as the strategy needed to earn a ten-blue-link click. Three signals, three review paths, three decisions. Collapsing them into a single "rankings dashboard" is how agencies end up recommending content refreshes when the actual issue is a layout change, or investing in schema when the actual issue is an AI Overview absorbing the intent.
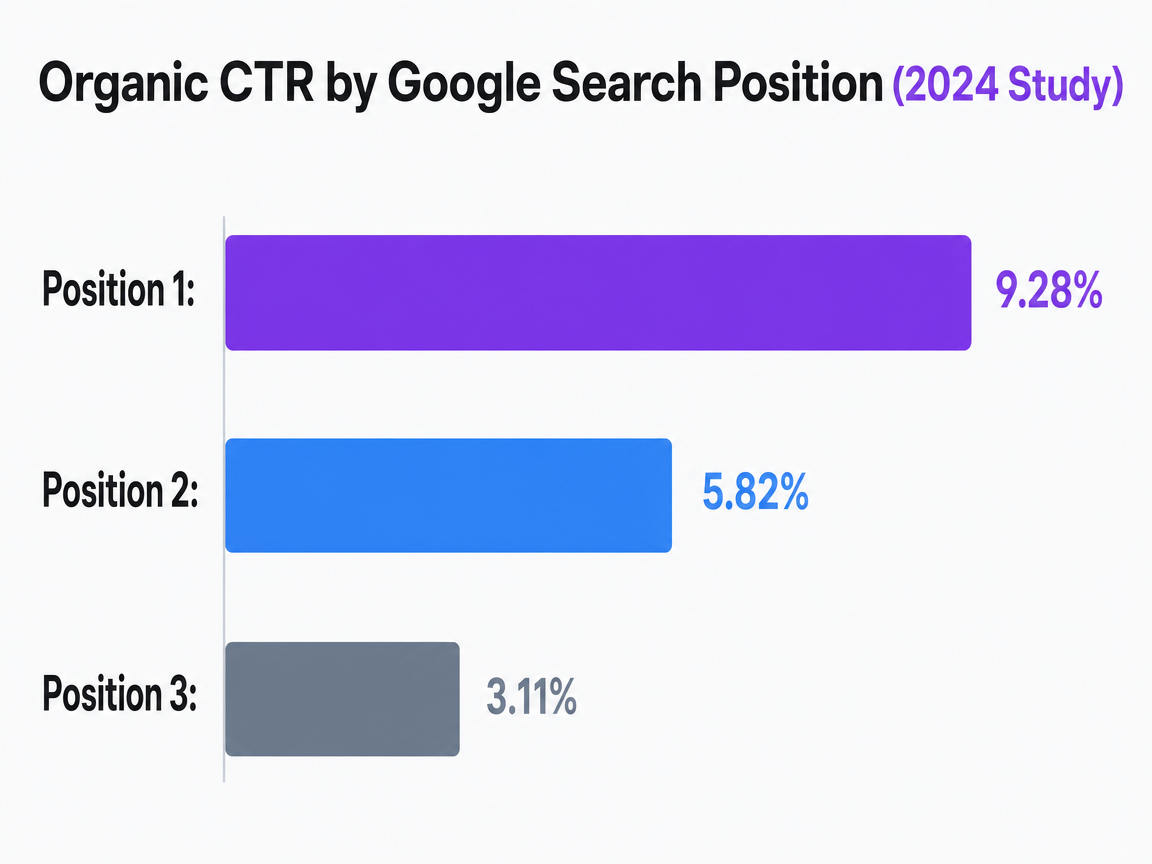 Organic CTR by Google Search Position (2024 Study)
Average click-through rates for the top three organic positions on Google, according to a 2024 study. This data shows the steep drop-off in clicks after the first position.
What the evidence actually says about position, features, and clicks
The empirical literature converges on a claim that is more useful to agencies than the usual "rank still matters" or "rank is dead" polarity. Position is still the strongest single predictor of CTR. Two separate academic analyses of Google click behavior confirm that finding directly, while also showing that keyword characteristics, result characteristics, and SERP feature presence exert statistically significant additional effects 2, 7. The correct read is not that rank matters less. It is that rank explains a shrinking share of the variance, and the residual is now large enough to change client outcomes on its own.
The feature-level evidence is what makes that residual actionable. The cross-website analysis of 24 SERP features found that features exert an overall negative influence on organic CTR, with top-ranked results particularly susceptible to CTR decreases when features enter the page 1. That is a specific, testable finding: the same position one that used to yield a given click rate now yields less when an AI Overview, a featured snippet, or a product carousel loads above or beside it. Design research adds a mechanism to the correlation, reporting that user gaze and clicks concentrate on visually emphasized elements such as rich results and top ads, even when other links may be more relevant 9.
For a Head of SEO, that combination has a clean operating consequence. Reporting a client's position without reporting the composition of the page they rank on is reporting half a metric. The same #3 ranking in a ten-blue-link SERP and a #3 ranking under an AI Overview with a local pack are different products with different expected click yields. Monitoring both surfaces, and treating them as separate performance inputs, is how the evidence base translates into a defensible reporting model rather than another dashboard tab.
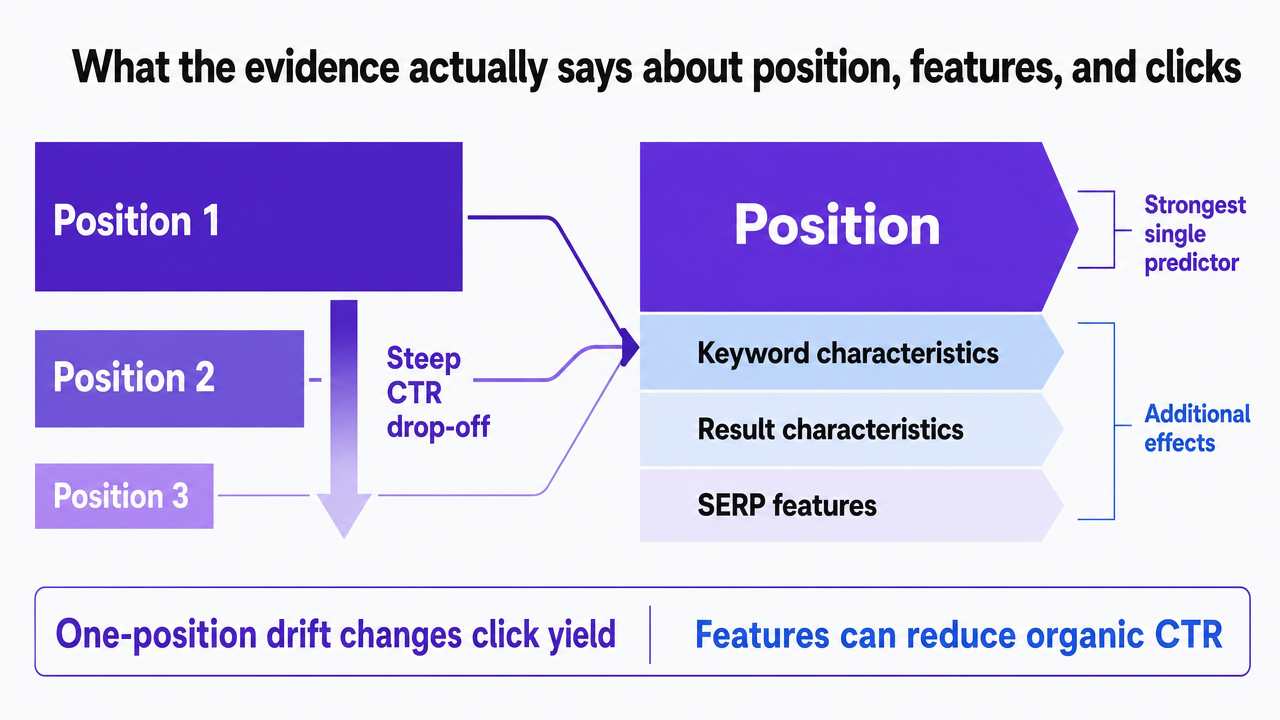 Visualize the steep CTR drop-off across the top three organic positions cited in this section, directly supporting the argument that a one-position drift materially changes click yield
Test SERP monitoring impact with real campaigns
Measure live keyword shifts and reporting accuracy using your actual client data during your trial.
Timing rules: when to react, when to wait, when to escalate
Core updates and the one-week hold
The most common monitoring failure is a fast reaction to a slow event. When a core update begins rolling out, rankings and traffic can move erratically for days before settling into whatever new equilibrium the update produces. Google's own guidance is direct on the timing: site owners should wait at least a full week after a core update completes before analyzing Search Console data, and should compare the week after the rollout finishes to the week before it began 11. That is not a cautious posture. It is the observation window the data actually supports.
Applied at portfolio scale, the one-week hold becomes a governance rule. A Head of SEO who lets strategists open remediation tickets during the rollout will burn hours diagnosing volatility that resolves on its own, and will ship changes that muddy the post-update read. The cleaner protocol is to freeze non-essential edits on affected accounts during the rollout, log the SERP composition and rank state at the start and end of the window, and reserve the post-completion week for diagnosis. Clients get an earlier note explaining the hold and the comparison logic. When the analysis lands, it separates system-driven movement from site-specific issues rather than blending them into a single anxious narrative.
Hourly views for short-lived volatility
Not every event deserves a one-week hold. Some shifts are short-lived, and the tooling to catch them has improved. Search Console now includes a 24-hour performance view with hourly granularity, reporting clicks, impressions, average CTR, and average position at the hour level 14. That resolution changes what a strategist can see. A morning drop in impressions on a commercial cluster, followed by a partial recovery by afternoon, is a distinct pattern from a sustained decline, and it now shows up in the source data rather than in a next-day rollup.
The escalation logic follows the resolution. Hourly views are the right surface for suspected feature swaps, indexing hiccups, and same-day tracking anomalies where the question is whether something is still happening. Daily views remain the correct surface for weekly reporting and trend confirmation. Core-update analysis stays on the one-week comparison window described above. Matching the observation window to the event class is what keeps a portfolio-scale monitor from generating alerts faster than strategists can interpret them, and it is what lets client communication distinguish a two-hour anomaly from a structural shift without waiting for either to prove itself.
Portfolio economics: monitoring cadence as time-per-account math
Scope shift: this section addresses the Head of SEO running a portfolio of 15 to 80 accounts, not a single-site operator. At that scale, the case for SERP monitoring stops being about signal quality and starts being about how many strategist hours it costs to interpret those signals across every account, every week. Volatility is a property of the system rather than any one site 16, which means the monitoring workload does not shrink when clients are performing well. It compounds with account count.
The workable model is tiered cadence. Not every account needs daily review of all three signals.
- A high-priority account with commercial-intent head terms and active AI Overview exposure earns daily rank volatility checks, weekly composition reviews, and weekly AI feature segmentation in Search Console 12, 13.
- A mid-tier account with stable rankings and lower feature density can run on weekly volatility scans and monthly composition audits.
- A long-tail account with informational queries and minimal commercial risk can operate on monthly rollups with alert-driven exceptions.
The tiering is the operating decision. The tool is downstream of it.
The math a Head of SEO should run is a variable expression, not a benchmark. Hours per account per month equal K keywords tracked, times R reviews per month, times H strategist hours per review, plus a fixed E hours for exception handling when alerts fire. Across a portfolio of N accounts, total monthly strategist load is the sum of that expression across tiers. Rate cards vary by market, so no dollar figure belongs in the model. What belongs is the ratio: how many hours does each tier consume, and does the retention and forecast-accuracy gain from that tier justify the load?
| Tier | Signals reviewed | Cadence | Hours per account per month |
|---|---|---|---|
| High-priority | Rank volatility, SERP composition, AI feature exposure | Daily volatility, weekly composition, weekly AI | (K × 4 × Hcomp) + (K × 4 × Hai) + E |
| Mid-tier | Rank volatility, SERP composition | Weekly volatility, monthly composition | (K × 4 × Hrank) + (K × 1 × Hcomp) + E |
| Long-tail | Rank volatility with alert-driven exceptions | Monthly rollup | (K × 1 × Hrank) + E |
Two operating consequences fall out of this table. The first is that most of the strategist load lives in the high-priority tier, which is where retention risk and forecast accuracy also concentrate. Under-investing there to spread hours evenly across the portfolio is how agencies lose the accounts that fund the P&L. The second is that alert quality determines whether the long-tail tier is genuinely low-cost or is silently generating unreviewed volatility 1. Monitoring cadence is only defensible when the alert thresholds separating tiers are tuned to portfolio-specific noise floors, not to vendor defaults.
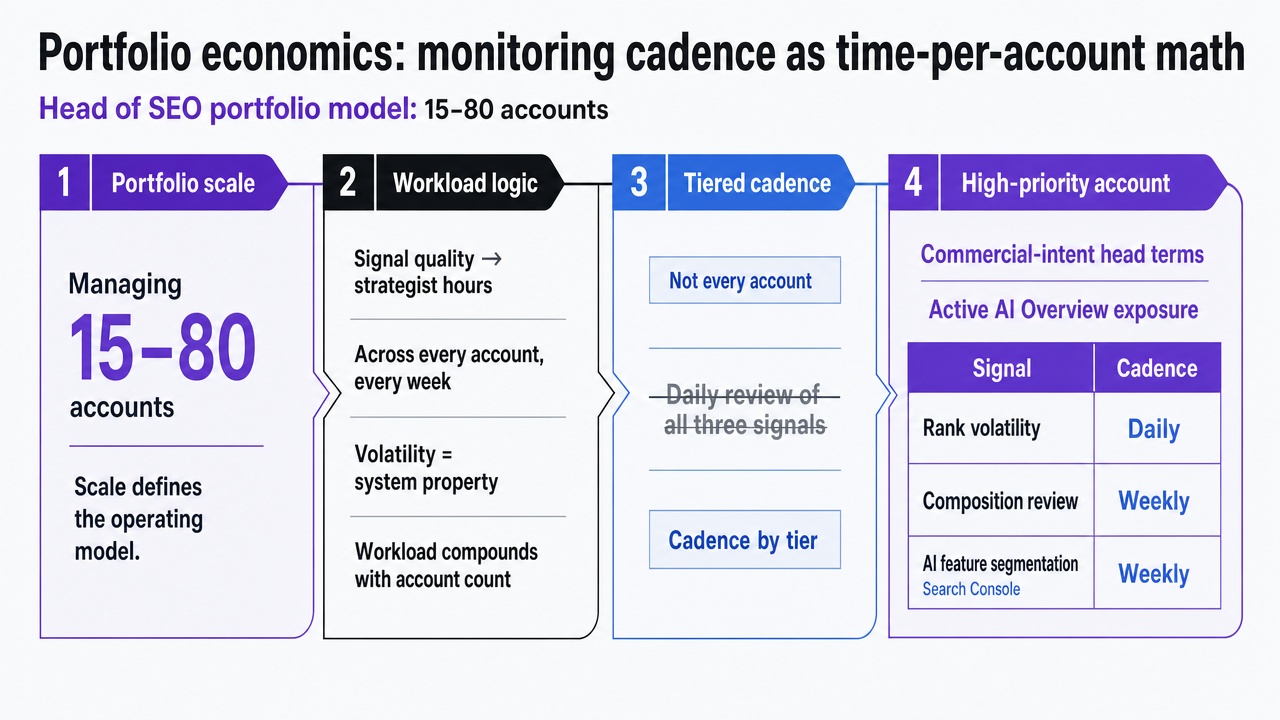 Visualize the tiered monitoring cadence model the section explicitly builds, mirroring the accompanying table so a Head of SEO can see tier, signals, and cadence at a glance
See SERP Movements in Real Time—Stay Ahead of Algorithm Shifts
Discover how leading agencies automate SERP monitoring and competitive tracking across all clients—enabling faster response to ranking changes, improved reporting accuracy, and streamlined multi-site management.
Rewriting the client conversation and the cross-channel call
From ranking reports to attention-allocation reports
The reporting artifact most agencies still send is a ranking table. It answers a question clients stopped asking. What a client on a monthly review actually wants to know is where the attention on their category is going, and what share of it their brand captured. Rankings are one input into that answer. They are no longer the answer itself.
An attention-allocation report reframes the same data. For each priority query, it shows the composition of the results page, the client's position and feature presence within it, and the estimated click yield given both. When an AI Overview or a product carousel absorbs intent above the organic block, that shows up as a reduction in effective yield rather than as an unexplained impressions-to-clicks gap. Design research supports the reframe: user gaze and clicks concentrate on visually emphasized elements such as rich results and top ads, even when other links may be more relevant 9. The report is describing where attention landed, not just where the client ranked.
The client conversation that follows is different in tone. Instead of defending a stable ranking against a falling click count, the strategist walks through which surfaces gained share of the page, which lost it, and what the next month's work is designed to reclaim. Retention arguments get easier because the report explains the outcome the client is already seeing.
When SERP data forces a reallocation between SEO and PPC
Composition data eventually produces a budget question. When ads, an AI Overview, and a shopping unit consistently push the organic block below the fold on a client's highest-intent queries, holding SEO spend flat while ignoring paid coverage on the same terms is a choice, not a default. The academic evidence on channel interaction is direct: clicks on organic listings and clicks on paid listings show positive interdependence rather than substitution 15. Presence in one surface tends to lift the other, which means the reallocation conversation is about combined coverage, not about picking a winner.
The trigger for a reallocation call is a specific pattern in the monitor. A query cluster shows stable rank, rising impressions, falling clicks, and a composition change that added a paid or AI feature above the organic result. SEO effort alone will not recover the lost yield in that quarter. The defensible recommendation is temporary paid coverage on the affected cluster while the organic work targets feature eligibility, with both tracked against the same yield metric.
That call is uncomfortable for agencies structured around channel silos. It is straightforward for a Head of SEO whose monitor already produces the evidence. The SERP data is the argument. The budget shift is the consequence.
What changes for a Head of SEO who runs this operating model
The visible change is in the shape of the work. Strategist hours stop being spent chasing individual rank movements and start being spent on interpretation: which composition shifts explain which yield changes, which query clusters have drifted into AI summarization surfaces 13, and which accounts need the paid coverage argument before the quarterly forecast slips. Alert volume goes down. Diagnostic depth goes up. The weekly client note reads less like a status update and more like a read on where category attention moved.
The operational change is in how the portfolio segments itself. Accounts sort into monitoring tiers by commercial risk and feature exposure rather than by billing size, and the tiering holds up under scrutiny because it maps directly to hours per account per month. Forecast accuracy improves because the model now accounts for composition-driven yield loss instead of treating impressions and clicks as a stable ratio 6. Retention conversations get easier for the same reason: the report explains what the client is already seeing.
Running this model across 40 or 80 accounts without adding senior specialists is the actual leverage. Platforms like Vectoron are built to carry that interpretation load under an approval-first workflow, so strategist judgment stays on the decisions that need it.
Frequently Asked Questions
References
- 1.Beyond Rankings: Exploring the Impact of SERP Features on Organic Click-through Rates.
- 2.Factors Influencing Click-Through Rates on Google Search Results.
- 3.From 10 Blue Links Pages to Feature-Full Search Engine Results Pages -- Analysis of the Temporal Evolution of SERP Features.
- 4.The Evolution of Web Search User Interfaces -- An Archaeological Analysis of Google Search Engine Result Pages.
- 5.Organic search results click-through rates on Google.
- 6.A Guide to Google Search Console Reporting for SEO Agencies.
- 7.Factors Influencing CTR on Google Search Results: Extended Analysis.
- 8.How Search Is Changing in the 2020s.
- 9.The Impact of Google Search Results Design on User Behavior.
- 10.A Guide to Google Search Ranking Systems.
- 11.Google Search's Core Updates.
- 12.AI Features and Your Website | Google Search Central.
- 13.Introducing Search Generative AI performance reports in Search Console.
- 14.An improved way to view your recent performance data in Search Console.
- 15.Analyzing the Relationship Between Organic and Sponsored Search Advertising.
- 16.On the Volatility of Commercial Search Engines and its ....