
Key Takeaways
- Rank movement is a leading indicator, not revenue proof; causal research shows a rank 1 to rank 2 drop can cut click odds by one third to two thirds 1.
- A defensible measurement stack has four layers: query-level rank, click yield adjusted for SERP features, qualified post-click conversions in GA4, and booked revenue closed through the CRM 6, 3.
- Incrementality reporting protects organic budget against paid, since 81% of ad impressions and 66% of ad clicks occur without an associated organic result 5.
- Prioritize keywords by modeled revenue per query, multiplying impressions, feature-adjusted click yield, landing page conversion rate, and CRM revenue per qualified conversion rather than volume or difficulty 2.
Why Rank Movement Rarely Explains Client Revenue on Its Own
A personal injury firm moves from position 4 to position 2 on a high-intent query. The agency dashboard lights up green. The client asks a different question on the monthly call: how many signed cases did that produce? The gap between those two conversations is where most agency retention risk lives.
Rank data is a leading indicator with real economic weight. Causal work on individual search behavior shows that moving from rank 1 to rank 2 can cut the odds of a click by one third to two thirds, even after controlling for relevance 1. That effect is large enough to matter to any revenue model. It is also narrow enough that treating it as a universal CTR curve breaks the moment SERP features, presentation quality, or AI-generated answers enter the picture 8, 10.
Rank is one variable in a longer chain. Click yield depends on layout and title attractiveness. Post-click behavior depends on landing page and offer. Qualified conversion depends on intent match. Booked revenue depends on intake, sales, and fulfillment 3. Skipping any link in that chain produces reports that celebrate movement without defending contribution, which is exactly the argument paid search teams win when budget gets reallocated.
The rest of this piece treats rank as an input to a measurement architecture, not a headline in a slide.
The Four-Layer Revenue Attribution Stack
Rank as an Input Variable, Not an Outcome
Treating rank as the outcome of an SEO program is what produces the disconnect between agency dashboards and client P&L conversations. Rank is a signal about visibility, not a receipt for revenue. The distinction changes what the position tracker is actually for: it becomes a feed into a model, not a scoreboard.
A working stack has four layers, each with its own math and its own failure mode. The top layer is query-level rank, sampled with enough frequency and geographic granularity to reflect what real searchers see. The second is click yield, where raw position is discounted by SERP layout and adjusted for position bias, since cascade-model research shows users scan top-down and abandon after finding a worthwhile result 9. The third is post-click behavior, measured against qualified conversion definitions rather than sessions. The fourth is offline outcome, where booked revenue closes the loop through CRM and call data 3.
Ranking movement enters the model as a variable that shifts the first two layers. Whether that shift produces revenue depends on what the next two layers are doing on that specific query for that specific client.
Mapping Data Sources to Each Layer
Each layer of the stack has a canonical data source, and confusing them is where most revenue attribution work breaks. Google's own guidance draws the line clearly: Search Console covers pre-click search performance, including queries, impressions, clicks, and position, while Google Analytics measures what happens after the user arrives on the site 6. That boundary defines the seam between layer two and layer three.
The full mapping runs like this. Layer one, query-level rank, comes from the position tracker itself, refreshed at the cadence and location set the client's market requires. Layer two, click yield, pulls impressions and clicks from Search Console to sanity-check the tracker's implied CTR against the client's real query mix 6. Layer three, post-click behavior, moves to GA4 for session quality, engaged sessions, and conversion events tied to specific landing pages. Layer four, offline outcome, brings in the CRM for closed revenue and, for service verticals where phone contact drives the deal, call intelligence to tag which inbound calls were qualified, which were missed, and which converted 3.
Wired this way, the position tracker stops answering "did we rank?" and starts answering "what did rank movement contribute to booked revenue on this query?"
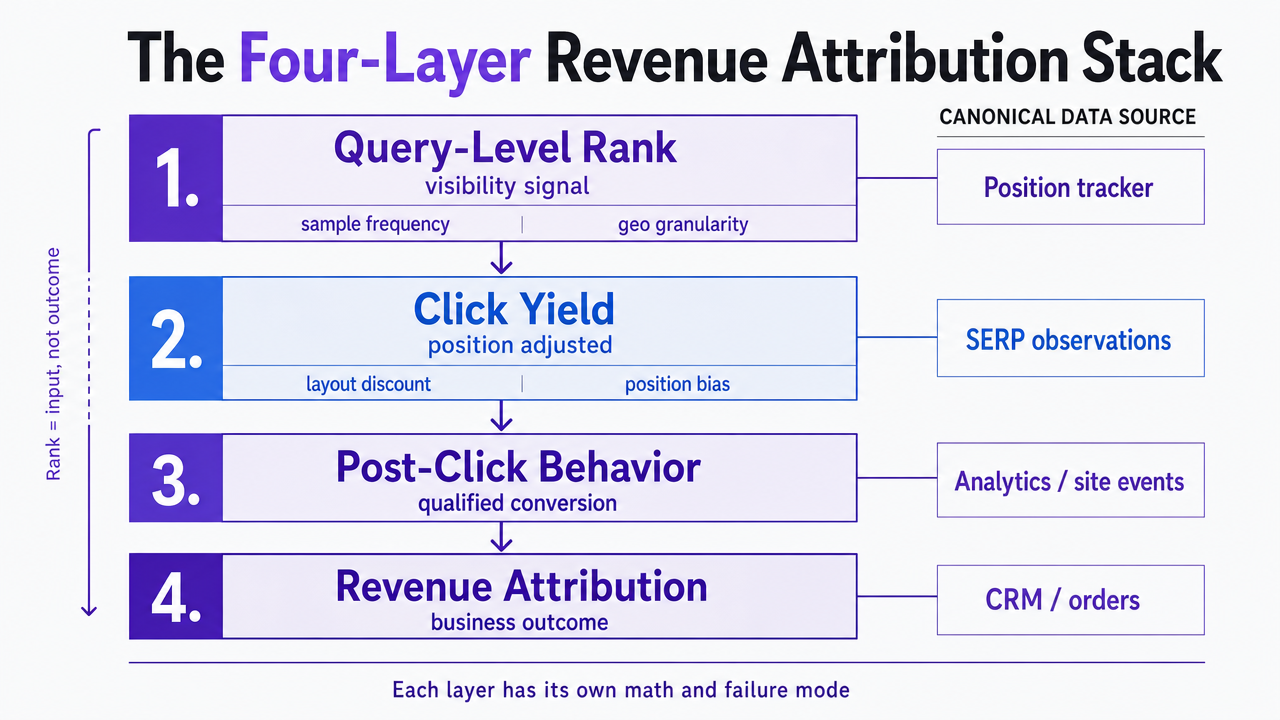 Visualize the four-layer measurement stack described in the section, mapping each layer to its canonical data source so readers can see the architecture at a glance
Modeling Click Yield: Position, Bias, and SERP Features
The Rank 1 to Rank 2 Collapse and What It Actually Measures
The most quoted number in agency rank-tracking decks is also the most abused. Causal analysis using a dataset of individual search behavior found that moving a website from rank 1 to rank 2 reduces the odds of a click by one third to two thirds, depending on the specific search, even after controlling for relevance 1. That is a wide band, and the band itself is the point.
The study measured actual user choice, not aggregated SERP logs, and it isolated the effect of position from the effect of content quality. That matters for revenue modeling in two directions. First, it confirms that agencies undervalue a slide from rank 1 to rank 2 when they treat it as a minor movement. On a query with any commercial intent, a one-position drop can wipe out half the click yield before any downstream layer runs its math. Second, it warns against porting the same coefficient to every keyword. A branded navigational query, a local service query, and a comparison query each sit in a different SERP environment, and the odds reduction lands somewhere different inside that one-third to two-thirds range.
Operators building revenue models should treat the finding as a scope, not a constant. The right move is to pair the tracker's position data with query-level click data from Search Console and back-solve the yield each client is actually seeing, then use the study's range as a sanity check against forecasts that assume a linear CTR curve.
SERP Features, Presentation Bias, and Why Identical Ranks Yield Different Clicks
Two clients can hold the same organic position on similar-volume queries and see click yields that differ by an order of magnitude. The tracker will not explain the gap. The SERP layout will.
A study spanning 67,000 keywords, more than 6 million clicks, and 24 million views found that SERP features have significant effects on organic CTR beyond rank, with the direction and size of the effect depending on which features appear, where the site sits relative to them, and whether the site is included in the feature itself 8. Featured snippets, People Also Ask blocks, local packs, image carousels, and shopping units all rearrange the attention available to a blue-link result. In most configurations the net effect on non-included results is a reduction in click yield, sometimes sharply.
Position bias compounds this. Click-log research favors a cascade model, where users scan results from top to bottom and stop after finding something worthwhile 9. When a SERP feature occupies the worthwhile slot before the first organic result, the cascade breaks early and downstream ranks lose disproportionately.
Presentation quality then decides what happens to the clicks that remain. Google's own work on presentation bias found substantial evidence that more attractive titles pull clicks independent of rank 10. A personal injury firm holding rank 3 with a sharper title and a review-rich snippet can outperform a rank 2 competitor with a generic tag.
The practical consequence: a click-yield model that ignores feature mix and title quality will systematically over-forecast revenue on feature-heavy queries and under-credit content teams for gains that came from snippet work rather than position work.
AI Overviews as a Live Variable in the CTR Model
The click-yield model that worked in 2023 is now missing a term. Search Console added performance reporting for generative AI features on Search, including AI Overviews and AI Mode, which means agencies can finally see impressions and clicks originating from AI-answer surfaces rather than only from the classic ten blue links 7. Before that reporting existed, any CTR curve applied to a query with an AI Overview was guessing at what share of attention had been consumed above the fold.
The practical move is to treat AI Overview presence as a query-level flag in the model. Queries with an Overview should be forecast with a discounted click yield, sourced from the client's own Search Console data rather than a generic curve. Queries without one can continue to use the historical yield. Queries that oscillate, appearing and disappearing across crawls, need the tracker configured to capture Overview presence at the same cadence as rank itself.
The reporting-to-client implication is direct. A ranking gain on a query that has since acquired an AI Overview is not the revenue event the old model would score it as. Agencies that flag this early keep credibility. Those that do not spend the next quarterly review explaining why traffic did not follow rank.
Track SERP shifts and tie them to revenue
Validate how ranking improvements correspond to revenue impact using real client data during your trial period.
Post-Click Behavior: From Session to Qualified Conversion
A click is not a conversion, and a session is not a lead. The third layer of the stack is where most agency revenue models quietly break, because sessions get counted as if they were outcomes and bounce rate gets treated as if it were intent.
Once a searcher crosses from the SERP to the site, the measurement handoff shifts from Search Console to GA4, which is designed to track post-arrival behavior rather than pre-click query performance 6. The useful signals in that handoff are narrow: which landing page received the click, whether the session met a defined engagement threshold, and whether the user completed a conversion event tied to commercial intent. Session counts and pageview totals do not belong in a revenue model. Qualified conversion events do.
Defining what qualifies is the work most agencies underinvest in. For a personal injury firm, a qualified conversion is a case-eligible form submission or a call that reaches intake, not a contact-page view. For a 40-location dental group, it is a booked appointment request tied to a specific location, not a click on a phone number. For a home services client, it is a scheduled estimate, not a quote-form start. Guidance on connecting SEO to business metrics is direct on this point: outcome events like qualified leads and purchases carry revenue signal, while traffic and engagement metrics without an outcome definition do not 3.
Two configuration details decide whether the layer produces defensible data. Conversion events must be defined at the query-to-landing-page level so rank movement on a specific keyword can be traced to conversions on the page that keyword sends traffic to. And the definition of a qualified conversion has to be set with the client, in writing, before the reporting cycle begins. Redefining it mid-quarter is how organic contribution gets argued away in the next budget review.
Offline Outcomes: Calls, Bookings, and CRM Closure
The fourth layer is where organic contribution either gets defended or gets written off. In service verticals, the transaction rarely closes on the website. A qualified lead becomes a phone call, an intake conversation, an appointment, and eventually a signed matter or a completed job. If the measurement stack stops at a form submission, the revenue argument stops there too.
Closing the loop requires two data movements that most agencies underbuild. The first is pushing query and landing page attribution into the CRM at lead creation, so a signed personal injury case can be traced back to the specific keyword that triggered the click. Guidance on connecting SEO to business outcomes is explicit that outcomes like qualified leads and closed revenue, not sessions, carry the signal worth reporting to clients 3. Without the attribution field on the CRM record, the rank tracker and the revenue ledger never meet.
The second movement handles the phone. For a 40-location dental group or a home services client, most conversions arrive as inbound calls, and the difference between a booked appointment and a price-shopper hangup decides whether the ranking gain produced revenue. Call intelligence that tags qualified inquiries, flags missed opportunities, and surfaces intake patterns turns those calls into structured conversion events the model can score against the query that generated them.
Once CRM closure and call tagging feed back to the query level, the position tracker finally answers the client's real question: what did rank movement on this keyword produce in booked revenue?
Incrementality: Defending Organic Revenue Against Paid Search
The budget conversation that ends organic programs rarely starts with rank. It starts with a paid search lead who walks into a QBR with a conversion export and asks what organic contributed that paid did not already capture. Agencies without an incrementality answer lose that argument on volume.
The strongest evidence in the reader's favor comes from Google's own research on the interaction between organic and paid search. Analyzing ad and organic data together, the paper found that 81% of ad impressions and 66% of ad clicks occur without an associated organic result, and that even when an organic listing is present at rank 1, roughly 50% of the ad clicks on the same query remain incremental 5. The frame matters: this is not a survey of advertiser opinion but a click-level analysis of when ads produced traffic that organic would not have produced anyway.
Two implications follow for revenue defense. First, holding rank 1 does not cannibalize half of the paid clicks on that query, which means paid teams cannot argue that organic gains erase their contribution. Second, and more useful for organic, the same logic runs in reverse: on the majority of ad impressions where no organic result appears, organic has upside that is not being credited against paid spend today. Rank movement on those queries is incremental revenue by definition.
Separate work from NYU Stern reinforces the joint case. A study of organic and paid coexistence found that when both listings appear together, advertiser profits rise by at least 6.15% versus paid alone, driven by higher combined CTR and conversion rates 4. The scope is important: this is a lift measured on advertisers with active paid campaigns, not a claim about organic in isolation. Used carefully, it lets an agency argue that pulling organic investment does not save the paid budget's efficiency; it degrades it.
The reporting move is to add an incrementality column to the client's query-level revenue table. For each tracked keyword, flag whether the client currently runs a paid ad, whether an organic result appears, and at what rank. Revenue from queries with no paid presence is fully attributable to organic. Revenue from queries with paid presence gets partial credit based on the incrementality benchmarks above, with the specific coefficient documented in the reporting appendix. That single column is what turns rank movement into a defensible line item in the next budget meeting.
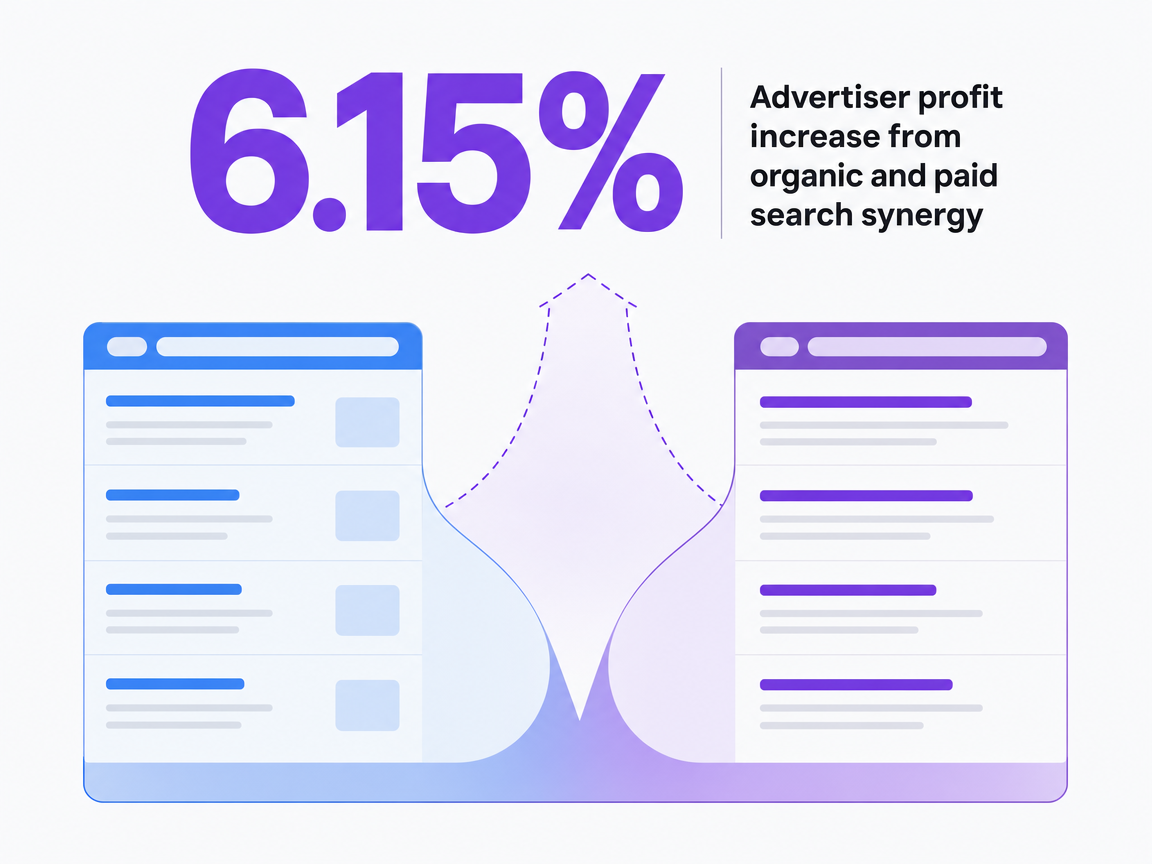 Advertiser profit increase from organic and paid search synergy
Advertiser profit increase from organic and paid search synergy
See Exactly How SERP Movements Impact Client Revenue—Not Just Rankings
Request a walkthrough of workflow-integrated SERP tracking that correlates position changes with real pipeline and revenue data for multi-location or high-stakes clients.
Prioritizing Keywords by Modeled Revenue Potential
Keyword prioritization based on search volume and difficulty scores produces roadmaps that look defensible in a pitch deck and underperform in a P&L review. The variable that matters is modeled revenue per query, and it rarely correlates with the metrics the tracker sorts by default.
Empirical work on search advertising found that the monetary value of a click is not uniform across positions because conversion potential varies by query and by rank within that query 2. The same logic transfers to organic. A rank 3 position on a query with clear commercial intent and no AI Overview above it will usually outproduce a rank 1 position on an informational query with a featured snippet and a People Also Ask block absorbing the attention. Volume ranks one; revenue potential ranks the other.
A workable prioritization score multiplies four terms from the stack already in place: monthly impressions from Search Console, a click-yield coefficient adjusted for current rank and SERP feature mix, the qualified conversion rate observed on the landing page for that query, and the average booked revenue per qualified conversion from the CRM. Queries with high scores and improvable rank become the roadmap. Queries with high scores where rank is already strong become retention priorities. High-volume queries with low modeled revenue drop off the list, no matter what the difficulty score says.
If You Manage a Portfolio: The Reporting-Cost Worksheet
The architecture above assumes one client. Agency Heads of SEO run 30. That shifts the problem from measurement design to measurement economics: how many analyst hours per client per month does the rank-to-revenue loop consume, and at what point does adding logos stop adding margin.
The variables are small in number and known to any operator who has staffed a delivery team. Analyst fully-loaded hourly cost. Hours per client per month spent pulling rank data, reconciling it against Search Console, joining it to GA4 conversion events, matching leads back through the CRM, and reviewing call recordings for qualified-inquiry tagging. Multiply across the client count. The result is the true cost of the reporting layer, separate from the strategy and production work the client is actually paying for.
The worksheet below uses variables, not benchmarks, because loaded costs and reporting depth vary by market. It compares a legacy workflow, where each layer of the stack is pulled and joined manually, against a consolidated loop where rank data, Search Console, GA4, and call intelligence feed a single query-level table. The delta the reader should solve for is hours per client per month, since that number multiplied by the portfolio is what frees strategist capacity or pays for the next hire.
| Variable | Manual reporting loop | Consolidated loop |
|---|---|---|
| Rank data pull and reconciliation | Hrank | Automated feed |
| GSC + GA4 join to query-level table 6 | Hjoin | Automated feed |
| CRM attribution match for closed revenue 3 | Hcrm | Hcrm / review only |
| Call review and qualified-inquiry tagging | Hcall | Auto-tagged, sampled review |
| Client-facing report assembly | Hreport | Hreport / review only |
| Total hours per client per month | Σ H | Σ H′ (typically a fraction) |
| Portfolio cost per month | Σ H × rate × N clients | Σ H′ × rate × N clients |
Two variables in that table move faster than the rest when the loop is consolidated. Call review collapses when intake calls are auto-tagged for qualified inquiries, missed opportunities, and intent, since strategists sample rather than listen end-to-end. And CRM attribution match collapses when query and landing page are pushed into the lead record at creation, removing the monthly reconciliation exercise 3. The hours that come back are the hours a Head of SEO can redeploy against strategy, competitive analysis, and the incrementality reporting that keeps organic budget in the next review.
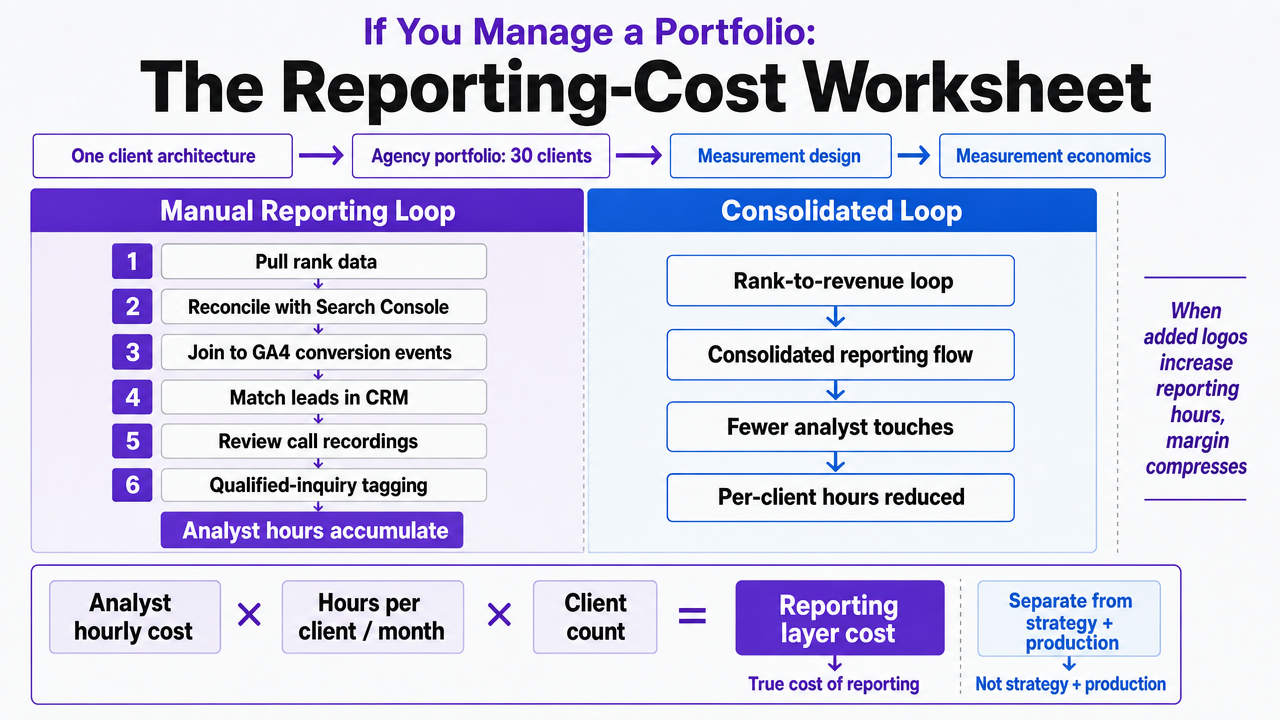 Translate the section's comparison table into a scannable side-by-side workflow comparison of the manual reporting loop versus the consolidated loop
Governing the Loop: From Monthly Report to Standing Workflow
The measurement stack does not fail because the math is wrong. It fails because it runs once a month, in a slide deck, disconnected from the decisions that would act on it. A revenue model that only surfaces during QBR prep is a reporting artifact, not a workflow.
Governance turns the stack into a standing loop. Query-level rank, click yield, qualified conversions, and booked revenue live in one table that refreshes on a set cadence, with defined thresholds that trigger action rather than commentary. A drop from rank 1 to rank 2 on a query with modeled revenue above a documented floor should open a ticket, not wait for the next report 1. An AI Overview appearing on a top-ten revenue query should trigger a click-yield reforecast the same week Search Console flags it 7. A qualified-call rate that decouples from ranking gains should route to intake review before the client raises it.
The operational shift is small in description and large in effect: every layer of the stack gets an owner, a threshold, and an approval path. Rank movement stops being news and starts being an input to the next approved action.
Frequently Asked Questions
References
- 1.How Does Ranking Affect User Choice in Online Search?.
- 2.An Empirical Analysis of Search Engine Advertising.
- 3.Connecting SEO Performance to Business Metrics.
- 4.Study Finds Synergies Between Organic Listings and Paid Search Ads.
- 5.Impact Of Ranking Of Organic Search Results On The Incrementality Of Search Ads.
- 6.Using Search Console and Google Analytics Data for SEO.
- 7.Introducing Search Generative AI performance reports in Search Console.
- 8.Beyond Rankings: Exploring the Impact of SERP Features on Organic Click-through Rates.
- 9.An experimental comparison of click position-bias models.
- 10.Beyond Position Bias: Examining Result Attractiveness as a Source of Presentation Bias in Clickthrough Data.