
Key Takeaways
- Raw rank reporting misleads because position, attractiveness, and presentation biases inflate or absorb clicks independently of the ranking URL's actual relevance 2, 9, 4.
- Device-split rank, impressions, and CTR benchmarked against device-specific curves are the reporting minimum, since blended averages hide where client revenue actually sits 5.
- A one-position slip from rank one to rank two cuts click odds by roughly one third to two thirds, making routine drift a material revenue event 8.
- Treat rank as a weighted input inside an expected-click model calibrated by SERP composition and joined to pipeline at the query-cluster level, then reconciled with paid coverage 7, 12.
Why Rank Data Stops Being a Deliverable and Becomes an Input
Rank concentration is the reason SEO retainers exist. In a 2023 study of real browsing logs across Google and Bing, the first organic result on Google captured 51.3% of clicks, the top five results captured more than 86%, and 97.11% of all clicks landed on the first page 1. The scope matters: this is observed browsing behavior on general-purpose queries, not a synthetic CTR curve modeled from impressions, and the distribution shifts by engine and query type. The headline still holds. Attention on organic SERPs is concentrated enough that a two-position move on a commercial keyword is a material business event.
That is also where most agency reporting stops, and where the ROI argument starts to fall apart. A Head of SEO who ships a monthly deck of green arrows and average-position deltas is training clients to treat rank as the product. When rank climbs and revenue stays flat, the client concludes the product is broken. When rank slips and revenue climbs, the client concludes the product is irrelevant. Both readings are the predictable result of reporting an input as if it were an outcome.
The framework in the sections that follow treats rank as one weighted signal inside a revenue attribution model, not a standalone deliverable. Before that model can be built, three biases in raw rank data have to be named, device performance has to be separated, and the effect of SERP features on the traffic a given rank actually produces has to be priced in.
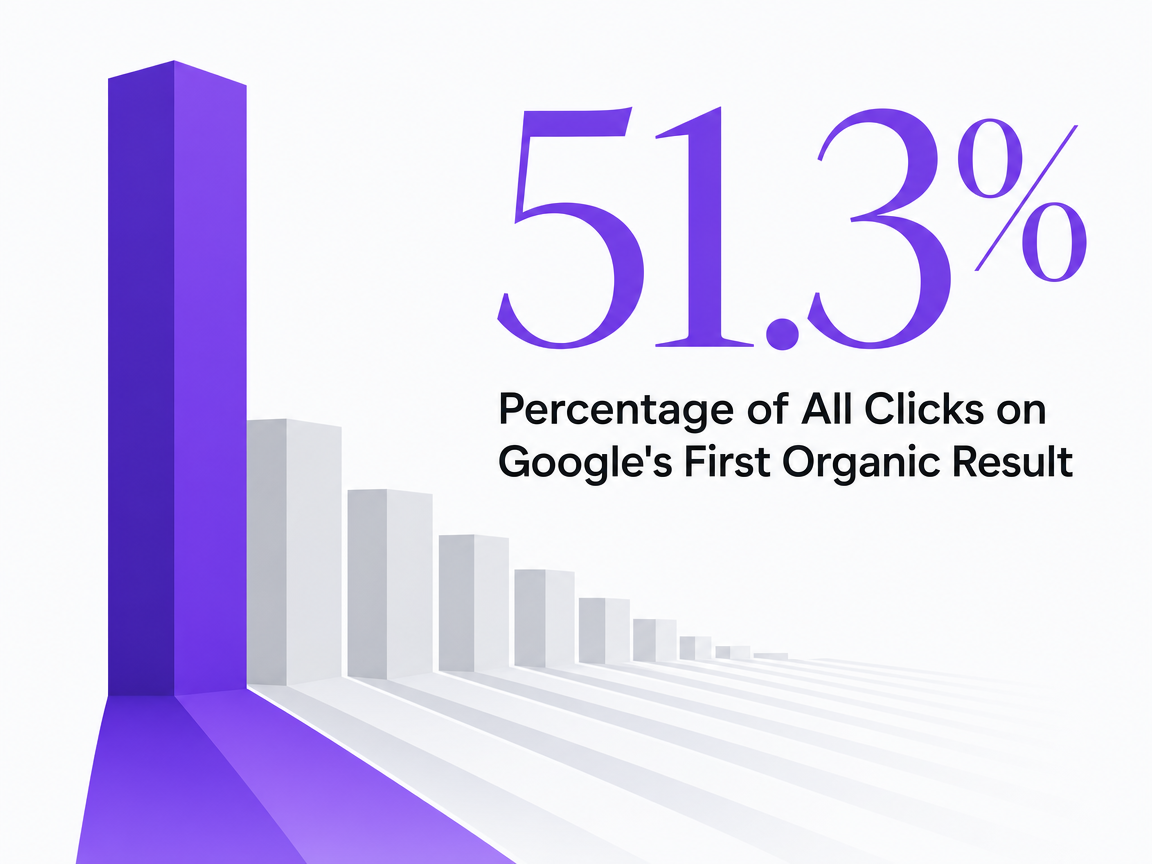 Percentage of All Clicks on Google's First Organic Result
Percentage of All Clicks on Google's First Organic Result
The Three Biases That Break Raw Rank Reporting
Position Bias: Why Clicks Follow Rank Regardless of Relevance
Position bias is the reason rank tracking works at all, and the reason it lies. Users click higher-ranked results even when those results are less relevant to the query 2. The behavior is not a judgment about the page. It is a scanning habit reinforced by every prior search session, and it means clickthrough data mixes two things that agencies routinely conflate: the value of the content and the value of the slot.
The operational consequence is that a rank improvement produces click gains that are partly earned and partly borrowed from the slot itself. Collaborative ranking research documents the same effect in click logs, noting that top-ranked results collect a disproportionate share of clicks that would not survive a blind relevance test 3. For agency reporting, this matters in two places. First, when a client asks why a mid-page rank jump did not produce proportional revenue, the answer often lies in the fact that the traffic gained was slot-driven rather than intent-matched. Second, when a competitor at position two outconverts a client at position one, that outcome is not anomalous. It is what happens when position bias inflates the top slot's click share above its qualified-intent share.
Attractiveness Bias: Snippets, Titles, and the Gap Between Rank and Click
Position sets the ceiling on visibility. What the user sees at that position sets the floor on clicks. Google research on presentation bias separates position from result attractiveness and shows that users judge relevance from titles, URLs, and summaries before they click, even when position is held constant 9. Two results at rank one on comparable queries can produce materially different CTRs based on the strength of the snippet alone.
This is where reporting decks that celebrate a rank climb without inspecting the SERP element go sideways. A client can move from position four to position two, watch CTR barely respond, and reasonably ask what the retainer bought. The answer is often that the new slot is drawing a weak snippet, or that a competitor's snippet is doing more work at a lower rank. Attractiveness bias also cuts the other way in agency defense: when rank slips but a rewritten title tag holds CTR steady, the account team can point to the SERP element as the load-bearing asset. Neither reading is available in a rank-only report. Both require pairing rank with impression-weighted CTR at the query-URL level and a snapshot of the live snippet.
Presentation Bias: What Layout Does to the CTR Curve
Presentation bias is the effect of the SERP itself, independent of the result. Radlinski et al. show that aggregate click patterns are heavily influenced by how results are presented, which makes raw CTR an unreliable measure of retrieval quality without additional signals such as reformulations, abandonment, and task success 4. Layout changes the denominator of every CTR calculation the agency ships.
The practical version of this problem is familiar to any Head of SEO who has watched a first-page CTR curve collapse in a single quarter. An answer box appears, a product carousel takes the top of the page, an AI overview pushes the first blue link below the fold on mobile, and the same rank now produces a fraction of the clicks it did a quarter earlier. The rank did not move. The presentation did. Agencies that report rank without a companion measure of SERP composition inherit these curve shifts as apparent performance drops and spend budget explaining artifacts. The fix is not more granular rank data. It is a reporting layer that captures which SERP features were live for each tracked query on the day the click data was collected, so presentation-driven CTR changes can be isolated from ranking-driven ones.
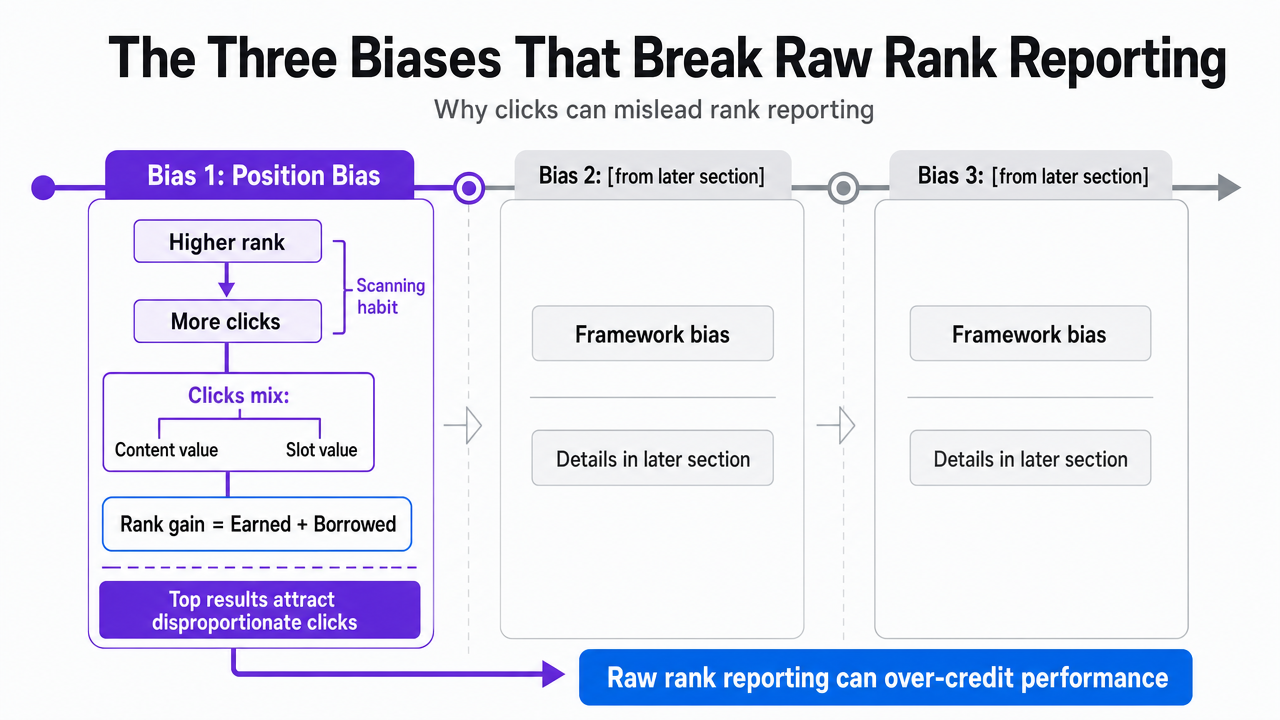 Process infographic comparing the three biases outlined in the section's subheadings, giving readers a compact reference for the framework
Device Segmentation as a Reporting Standard
Reporting a single average position across devices hides most of what a Head of SEO needs to defend the retainer. Desktop and mobile SERPs have different real estate, different feature density, and different user intents on the same query, which produces different CTR curves at the same rank. A 2024 analysis of Google click and impression data measured organic CTR by device and position and found the top-ranked organic result earned 9.28%, position two earned 5.82%, and position three earned 3.11% 5. The decay is steep on its own terms, but the operational point is that a blended curve smooths away the device where the client's revenue actually sits.
For a home services client, mobile is where the booking intent lives and where AI overviews, local packs, and click-to-call widgets compress the organic real estate above the fold. For a B2B legal or SaaS client, desktop is where research-stage queries convert and where feature-light SERPs leave the classic CTR curve mostly intact. Reporting a single average-position number to both clients uses the same instrument to measure two different economies.
The reporting standard that follows from this is straightforward. Rank, impressions, and CTR should be pulled by device for every tracked query, with position benchmarks applied against the device-specific curve rather than a global one. When a client's mobile CTR at position two underperforms the 5.82% device benchmark by a meaningful margin, that is a diagnostic signal about snippet, feature crowding, or intent mismatch, not a reason to push for a rank change that may not move revenue. Account managers who cannot produce a device-split view on request are shipping the wrong instrument.
Track and act on real SERP data instantly
Monitor SERP positions and publish live optimizations during your trial—see actual impact on rankings in real time.
SERP Features Rewrite the Rank-to-Traffic Assumption
The classic CTR curve assumes a page of ten blue links. Modern SERPs rarely look like that. Featured snippets, People Also Ask blocks, product carousels, local packs, video panels, and AI overviews now sit between the user's query and the tracked organic rank, and each of them changes the traffic value of the same position. A 2023 study of SERP feature impact on organic CTR reports that positional SERP features correlate positively with CTR, while most page-level SERP features correlate negatively with CTR 7. The direction is not incidental. Features that occupy the result slot itself, such as sitelinks or expanded rich results, tend to amplify clicks to the ranking URL. Features that occupy the rest of the page, such as answer boxes and knowledge panels, tend to absorb the click that would otherwise flow to organic positions below them. Companion work from the same authors finds that SERP features, on average, exert a negative influence on organic CTR across the query set studied 6.
For an agency reporting standard, this reframes what a rank number actually means. A position-three ranking on a query with a static ten-link SERP is a different asset than a position-three ranking on a query where an AI overview, a video carousel, and a People Also Ask block sit above the first organic result. Both are reported as "position 3" in every mainstream rank tracker. Only one of them behaves like the position-3 CTR benchmark the account team is comparing against.
The reporting move is to log SERP composition alongside rank for every tracked query on the day of the pull, then classify each feature as positional (accretive to the tracked URL) or page-level (dilutive to the tracked URL). When a client's traffic drops without a rank change, the SERP composition log usually surfaces the cause: a new page-level feature took share, or an existing feature expanded. When traffic climbs without a rank change, the same log often shows the client's result acquired a positional feature such as sitelinks or a rich result. Neither event is visible in rank data alone, and neither should be reported as an unexplained variance.
The Nonlinear Cost of a One-Position Slip
A one-position slip is not a linear traffic event. Peer-reviewed work on ranking's causal effect on click probability shows that moving a site from rank one to rank two decreases the odds of a click by between one third and two thirds, depending on the query 8. The range matters. On commercial-intent queries with concentrated attention, the loss sits at the top of that band. On informational queries with more distributed clicks, the loss sits closer to the bottom. Either way, a single position is not a single-digit percentage adjustment. It is a step change in the click economics of that query.
For an account team, this reframes what qualifies as a routine fluctuation. A tracked keyword drifting from position two to position three on a client's highest-margin service page is not a report footnote. If that query drives even a modest share of qualified pipeline, the expected click loss is large enough to shift monthly revenue attribution. The corollary is more useful than the warning: a one-position gain into the top three produces a nonlinear traffic pickup that, joined to conversion data, often accounts for the majority of a quarter's incremental organic revenue. Reporting that flattens both movements into a delta column erases the two events an SEO practice is actually paid to produce.
Building the Rank-to-Revenue Attribution Model
Layer One: Rank as a Weighted Input, Not a Score
The first layer of the model treats rank as a variable with a coefficient, not a metric with a target. Each tracked query gets weighted by three inputs the account team already collects:
- device-specific CTR benchmark at the current position 5,
- the direction of SERP-feature influence on that query (positional features accretive, page-level features dilutive) 7, and
- a bias-correction discount that accounts for how much of the current click share is slot-driven rather than intent-matched 2.
The output is not a rank score. It is an expected-click value per query per device per week, calibrated against the actual SERP the tracker observed. A position-two ranking on a feature-heavy mobile SERP and a position-two ranking on a clean desktop SERP resolve to different expected-click values in the same report. That single change ends the argument about why two clients at the same average position produced different traffic. The rank was the input. The expected-click value was the deliverable.
Layer Two: Joining Rank Data to Pipeline and Conversion Signals
Expected clicks are still a proxy. Layer two joins the query-level expected-click value to the client's pipeline signals: form fills, qualified calls, booked appointments, opportunity stage, and closed revenue. The join key is the landing URL, and the aggregation is by query cluster rather than individual keyword, which is where most agency reports quietly fall apart. A single URL typically ranks for dozens of queries with different intents, and rolling them up to a page-level conversion rate erases the queries that actually drive pipeline.
The framework in the search-performance literature makes the same point at a higher level of abstraction: engine performance metrics such as relevance and speed have to be distinguished from user outcome metrics, and single-metric evaluation of search performance is inadequate on its own 11. In agency reporting, the operational version is a query-cluster table that shows expected clicks, observed clicks, conversion rate, and revenue contribution side by side. When observed clicks track expected clicks but conversions lag, the diagnosis points at the landing page or offer. When observed clicks trail expected clicks at a strong rank, the diagnosis points at the snippet, the SERP composition, or the device split 9. Rank is present in the model. It is no longer the headline.
Layer Three: Harmonizing Organic With Paid in Blended Reports
Most retainer clients also run paid search, and most blended reports treat the two channels as parallel columns that never reconcile. Layer three closes that gap. Academic work comparing organic and sponsored search using a hierarchical Bayesian framework shows that click-through, conversions, and revenue contribution have to be estimated jointly across modalities to produce coherent ROI figures 12. The practical translation is that a query the client ranks for organically at position two and bids on at ad position one is not two independent line items. The paid click cannibalizes some share of the organic click, the organic presence lifts some share of the paid conversion, and the blended report should show that interaction rather than double-count it.
For account teams, the reporting move is to tag every tracked query with its paid coverage status and reconcile the organic expected-click value against paid impression share on the same query. That single view ends most of the awkward conversations about why organic traffic dropped in a month the client cut ad spend. Rank did what rank does. The blended demand curve moved underneath it.
See How Unified SERP Tracking Accelerates Agency ROI at Scale
Connect with our team for a walkthrough of scalable, approval-based SERP rank tracking frameworks proven to improve reporting accuracy and strategic oversight across high-volume client portfolios.
If You Manage a Portfolio: The Economics of Standardized Reporting
The audience shifts here. The previous sections assumed a single account and a single reporting standard. A Head of SEO running twenty to a hundred and fifty accounts is not solving that problem once. They are solving it at the scale of a delivery organization, where the marginal cost of every custom report compounds across account managers of varying skill and clients of varying patience. Standardization stops being a stylistic preference at that scale. It becomes the operating margin.
The math is simple enough to model with variables the account team already tracks. Let N be the number of client accounts under management, H the analyst hours consumed per account per reporting cycle to pull rank data, reconcile it against SERP composition, split by device, and join it to pipeline signals, and C the number of reporting cycles per quarter. Total quarterly reporting labor is N × H × C. When each of those inputs is bespoke, H drifts upward with every new client-specific dashboard request, and analyst capacity that could be spent on strategy is spent on data plumbing.
| Input | Bespoke Reporting | Standardized Framework |
|---|---|---|
| Analyst hours per account per cycle (H) | Variable, drifts upward per client request | Fixed, set by the reporting template |
| Reporting cycles per quarter (C) | Client-defined, uneven | Uniform cadence across the book |
| Quarterly labor (N × H × C) | Scales linearly with accounts | Scales sub-linearly as templates mature |
| Analyst time redeployable to strategy | Residual, unpredictable | Recovered from the delta in H |
The framework laid out in the prior sections is what makes H a fixed input rather than a variable one. Device-split rank, SERP composition tagging, expected-click values, and pipeline joins are the same operations run against the same schema for every account. The reporting deck changes at the presentation layer. The data model does not. That is the difference between an SEO practice that adds an analyst for every ten new accounts and one that adds an analyst for every thirty. Multi-dimensional evaluation of search performance is a recognized requirement in the literature 11. At portfolio scale, it is also a labor argument. The hours recovered from standardization are the hours that fund the strategic work clients renew for.
Defending the Framework Against Benchmark Disputes
Any account manager who has presented a rank-to-revenue model has met the client who arrives with a competing CTR curve pulled from a vendor blog. The disagreement is not a sign of a weak framework. It is a feature of the field. Public CTR-by-position studies vary widely across datasets and query types, and top-position estimates in particular drift as SERPs and measurement methods change 10. A defensible framework acknowledges the range rather than picking one number and pretending it is universal.
The defense runs on three points:
- Benchmark selection has to match the client's environment: device, query intent, and SERP feature density, none of which a generic industry curve captures 5, 7.
- The model uses benchmarks as calibration inputs, not as targets, so a competing curve moves an expected-click value rather than invalidating the report.
- The framework's authority comes from the joined pipeline data, not the CTR assumption. When observed clicks and conversions are tracked at the query-cluster level, benchmark disputes shrink to a sensitivity analysis the account team can run in front of the client rather than a debate the retainer loses.
What Changes When Rank Becomes an Input
The reporting deck stops leading with green arrows. Rank still appears, but it sits inside an expected-click value calibrated by device, SERP composition, and a bias discount, then joined to pipeline at the query-cluster level. Clients stop asking why rank moved without revenue, because the model already priced the movement. Account managers stop defending artifacts, because presentation-driven CTR shifts are logged rather than reported as performance drops.
The internal change is larger than the client-facing one. A standardized framework turns rank tracking into a repeatable schema across the book, which is what makes the practice scale without adding an analyst per ten accounts. That is the argument against in-house alternatives: not that agencies produce better rankings, but that they operate a rank-to-revenue model no single-client team has the volume to build. Platforms like Vectoron exist to run that schema at portfolio scale under human approval.
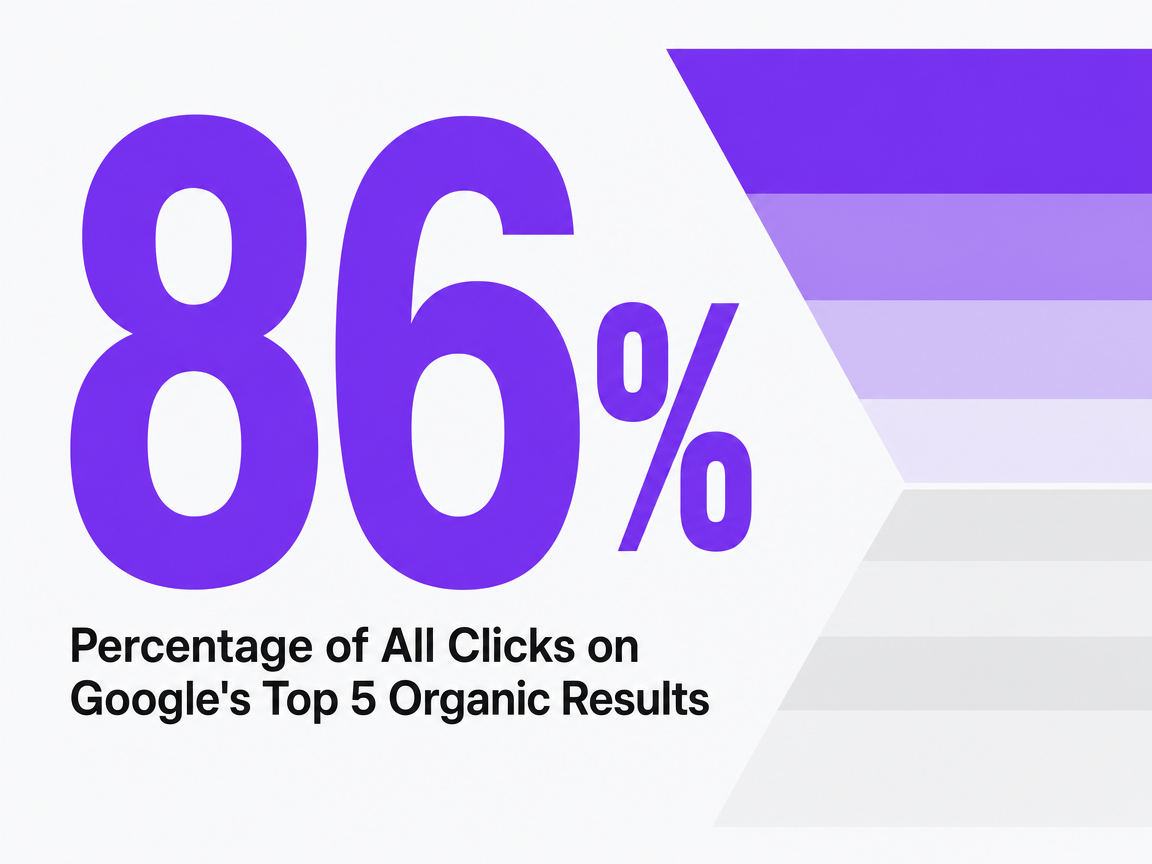 Percentage of All Clicks on Google's Top 5 Organic Results
Percentage of All Clicks on Google's Top 5 Organic Results
Frequently Asked Questions
References
- 1.You are how (and where) you search? Comparative analysis of web search behavior using desktop and mobile data.
- 2.Improving Web Search Ranking by Incorporating User Behavior Information.
- 3.Clickthrough Log Analysis by Collaborative Ranking.
- 4.How Does Clickthrough Data Reflect Retrieval Quality?.
- 5.Device-dependent click-through rate estimation in Google organic search results based on clicks and impressions data.
- 6.Beyond Rankings: Exploring the Impact of SERP Features on Organic Click-through Rates.
- 7.Exploring the Impact of SERP Features on Organic Click-through Rates.
- 8.How Does Ranking Affect User Choice in Online Search?.
- 9.Beyond Position Bias: Examining Result Attractiveness as a Source of Presentation Bias in Clickthrough Data.
- 10.The Click-Through Rate Decay Curve and SERP-Position Economics.
- 11.Search engine Performance optimization: methods and techniques.
- 12.Comparing Performance Metrics in Organic Search with Sponsored Search Advertising.
- 13.Identification of Positioning Factors in Academic SEO (ASEO ....