
Key Takeaways
- Average position alone misleads client reporting because Search Console's four metrics—impressions, clicks, CTR, and position—only make sense read together at the query-cohort level 1.
- A four-layer stack decides outcomes: SERP composition, Search Console behavior signals, technical eligibility through Core Web Vitals and structured data, and pipeline reconciliation against first-party client data.
- AI Overviews do not require a separate tracking discipline; their appearances flow through standard Search Console performance data under the same eligibility rules as conventional Search 2.
- Senior analyst hours are the real portfolio constraint, so pre-joined multi-signal data shifts time from report assembly to diagnosis and QBR defense, where retention and margin actually live.
Why average position stopped explaining client performance
A client's average position climbs from 8.4 to 5.1 across the tracked keyword set. Sessions drop 14%. Booked consults drop 9%. The QBR deck is already built around the position win, and the account manager has ninety seconds to explain why the number that used to matter no longer maps to the number the client actually cares about.
This scenario is now routine, reflecting a structural change in what a search results page is. Google's own ranking documentation describes Search as a set of automated systems weighing many signals across hundreds of billions of pages, not a single leaderboard producing ten blue links 1. Search Console reports the same reality through four metrics that only make sense read together: impressions, clicks, CTR, and position 1. Reading position without the other three has always been incomplete; it is now misleading.
Two forces widened this gap. First, feature-crowded SERPs push organic listings below AI Overviews, People Also Ask blocks, local packs, and video carousels; ranking position still drives CTR the most, but SERP features can pull organic CTR down even when position holds 4. Second, Google states that AI Overview and AI Mode appearances flow through the same standard Search performance data agencies already collect, with no separate optimization checklist 2. The measurement surface expanded, but reporting habits did not.
Agencies that continue to lead with average position are defending a metric Google's own tooling treats as one input among four. The rest of this piece rebuilds SERP ranking analysis around the layers that now decide client outcomes.
The four-layer SERP measurement stack
Layer 1: Query-level SERP composition
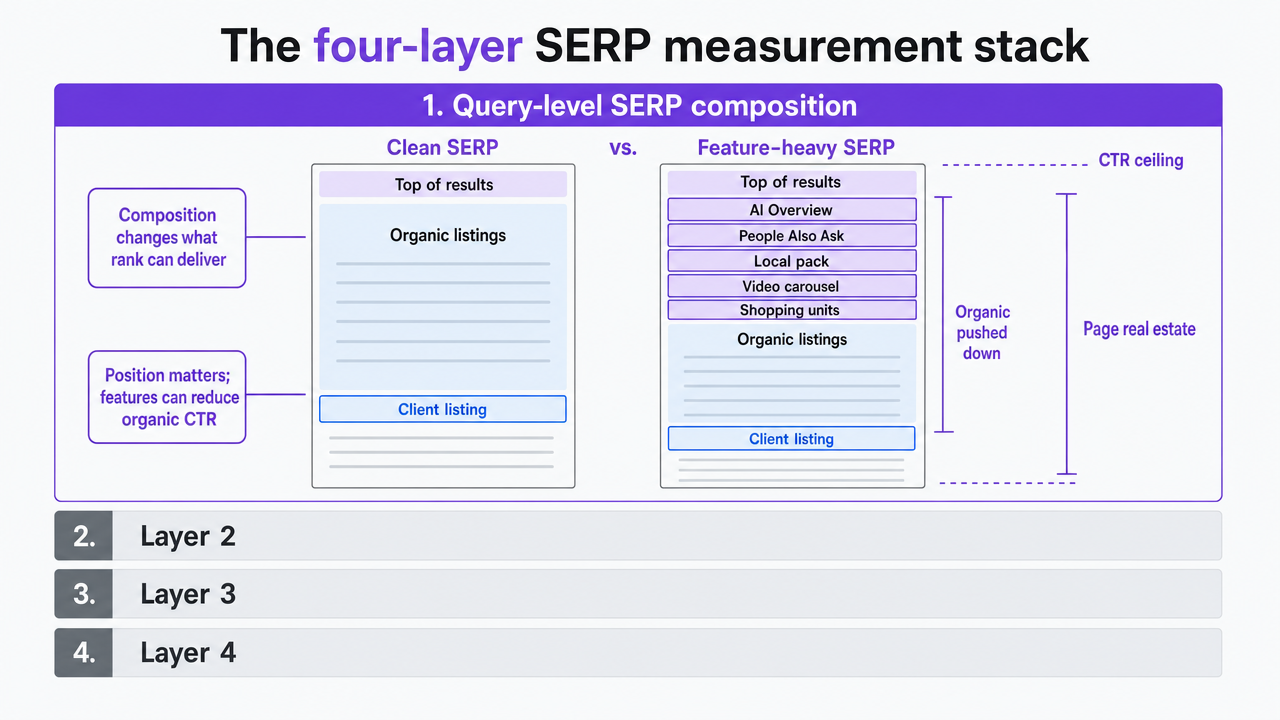
The first layer records what the SERP actually looks like when a client's query fires. Not just the position, but the entire page. This includes which features occupy the top of the results, how far organic listings are pushed down, and what real estate the client's listing competes for after AI Overviews, People Also Ask, local packs, video carousels, and shopping units take their share.
Composition matters because it changes the ceiling on what a given rank can deliver. An analysis of SERP features and organic CTR found that ranking position remains the most dominant determinant of CTR, but SERP features can exert a negative influence on organic click-through even when position holds steady 4. A position-three result on a clean ten-blue-link page and a position-three result buried under an AI Overview, a four-item People Also Ask block, and a local pack are not the same asset. Rank-tracker reports treat them as identical, but clients feel the difference in traffic.
The workflow implication is that agencies need to capture SERP composition as a first-class field for every tracked query, not as an occasional screenshot. This means logging feature presence, feature position, and whether the client appears inside any of those features, alongside the traditional position number. Query cohorts then get segmented by SERP type before any CTR or traffic comparison runs.
Read this way, a flat position report can be diagnosed correctly: the ranking held, but a new AI Overview arrived on 40% of the tracked queries, and organic CTR compressed accordingly. That is a defensible QBR sentence. "Average position 5.1" is not.
Layer 2: Search Console behavior signals
Composition sets the ceiling, while behavior tells the agency what users did with the impression they saw. Search Console reports performance through four metrics designed to be read together: impressions, clicks, CTR, and average position 1. Reading any one of them alone is where most client reports go wrong.
Productive readings come from ratios and deltas:
- Impressions rising while clicks stay flat points to feature encroachment or thinner snippets, not a ranking failure.
- Position improving while CTR compresses points to the same source: the query gained an AI Overview or a richer feature block above the organic result.
- Position slipping while CTR holds usually means the queries that survived are higher-intent, and the raw position average is being dragged by long-tail impressions the client never converted on anyway.
Google's own guidance on debugging traffic changes recommends comparing time periods, examining search types, and reviewing queries and pages before drawing conclusions about ranking cause 6. This sequence applies to steady-state analysis, not just decline diagnosis. Behavior signals also cover AI experiences: Google states that AI Overview and AI Mode appearances are included in the standard Search Console Web search performance data, so no parallel tracking stack is required to see them 2.
The operational takeaway is that behavior analysis lives at the query and page level, not the account rollup. Aggregate CTR across a client site is a vanity number. CTR by query cohort, segmented by SERP composition from Layer 1, is what actually explains movement.
Layer 3: Technical eligibility for rank and rich results
Layer three answers a simple question: is the client's page even eligible to earn the visibility Layers 1 and 2 are measuring? Eligibility has two components. Page experience thresholds decide whether a URL is competitive on the standard result. Structured data decides whether it is competitive for the richer features that now dominate composition.
Core Web Vitals set the page-experience floor. Google's recommended thresholds are LCP within 2.5 seconds, INP below 200 milliseconds, and CLS below 0.1, with pages falling into good, needs-improvement, or poor bands against those cutoffs 7. INP replaced First Input Delay in 2024, which matters for agencies still running legacy dashboards built against FID. A cohort view—what percentage of a client's ranking URLs pass all three thresholds—is more useful than a site-average score, because averages hide the specific templates that fail.
Structured data operates on a separate track. Google uses markup to understand page content and may display it in richer search appearances called rich results 11. Eligibility is not a guarantee of display, and it is not a ranking bonus. It is a gate: without accurate, complete markup, the page cannot compete for the feature slots Layer 1 records. Google's structured data guidelines require markup to accurately describe visible page content and warn that violations can make pages ineligible for rich results 12. Templated agency deployments that drift from visible content—outdated review counts, mismatched pricing, stale FAQ answers—quietly disqualify pages from the features their clients are trying to win.
Cohort-level dashboards that combine Vitals pass rates with structured-data validation results give senior strategists a fast read on whether a ranking problem is a content problem or an eligibility problem. Those are different fixes.
Layer 4: Business outcome and pipeline reconciliation
The top three layers describe visibility, behavior, and eligibility. The fourth layer is what the client's CFO actually asked about: did any of it turn into pipeline. Reconciliation at this layer is where most agency reporting falls apart, because the tooling that produces rank data does not talk to the tooling that produces booked-consult or qualified-lead data.
The IAB's State of Data 2026 report frames the broader problem: marketers are working in a fragmented measurement environment where platform metrics, attribution models, incrementality testing, and marketing mix modeling all produce different views of the same activity, and AI-assisted methods are being layered on top to reconcile them 13. For SERP analysis specifically, that means one metric will not carry the QBR. The defensible move is to pair the Search Console query-and-page cohorts from Layer 2 with the client's own downstream data—form fills, calls, booked appointments, qualified opportunities—and read the joined view.
Two disciplines keep this layer honest:
- Cohort matching: the queries and landing pages driving pipeline get compared against the queries and pages driving impressions, so the agency can see whether visibility work is landing on revenue-relevant surfaces or elsewhere.
- Directional caveats: attribution is contested and platform-fragmented, so pipeline movement gets presented as directional evidence against a baseline, not as causal proof of a single tactic.
Layer 4 is where the four-layer stack pays off. Composition, behavior, and eligibility explain what happened on the SERP. Pipeline reconciliation explains why the client should keep paying for it.
 Visualize the four-layer measurement framework that structures the entire article, giving readers a reference map for the subsequent subsections
Diagnosing the two scenarios that break agency reporting
Position up, leads down: a debugging sequence
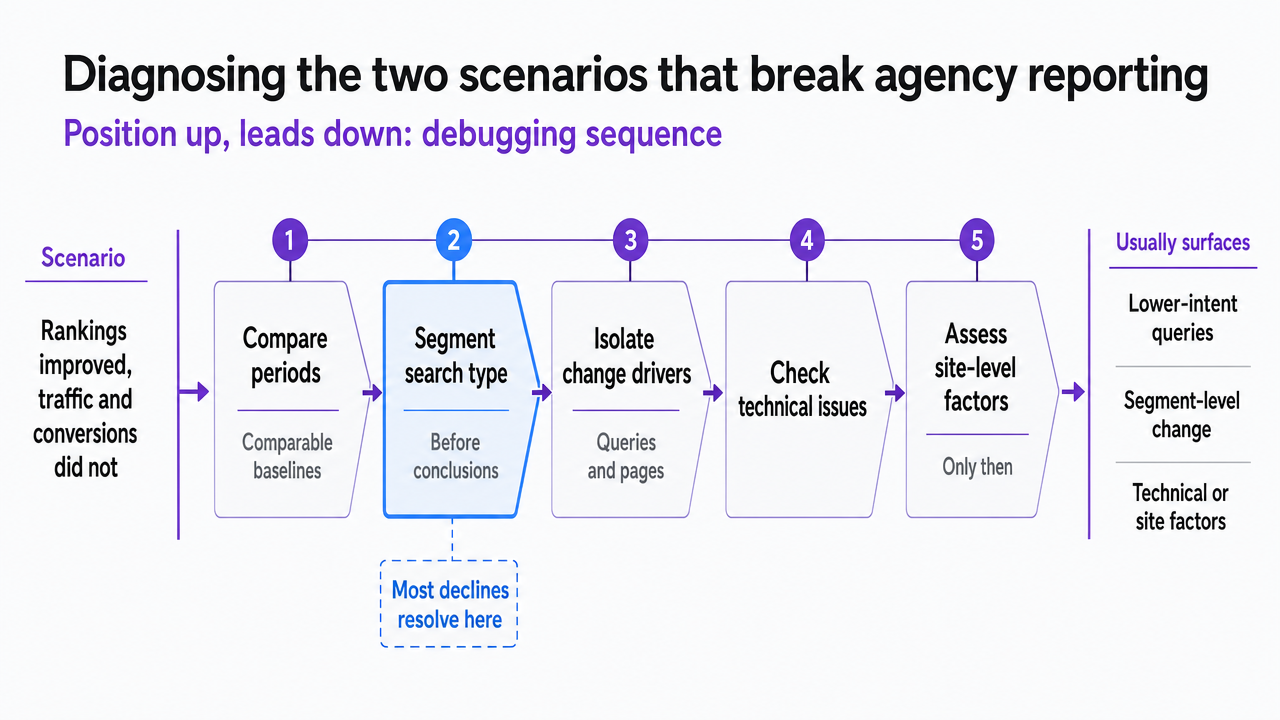
Rankings improved, but traffic and conversions did not. The instinct is to blame tracking, then landing pages, then the sales team. The disciplined move is to work through Google's own debugging sequence before anyone touches a fix.
Google's traffic-drop guidance sets the order:
- Compare time periods against comparable baselines.
- Segment by search type before drawing conclusions.
- Isolate the queries and pages driving the change.
- Check for technical issues.
- Only then assess broad site-level factors 6.
That sequence exists because most apparent declines resolve at the segmentation step, not the intervention step.
Applied to a position-up, leads-down account, the sequence usually surfaces one of three explanations:
- The queries that gained rank are lower-intent than the queries that lost impressions—the average moved because the mix moved.
- The SERPs where rank improved now carry AI Overviews or expanded feature blocks that compressed organic CTR at the new position, a pattern the CTR research anticipates when features occupy the top of the page 4.
- The winning URLs are informational pages that were never in the conversion path, so ranking gains land on surfaces the client's pipeline never depended on.
Each explanation points to a different response: rebalance the target set, revisit snippet and structured-data eligibility, or reroute internal linking toward converting templates. None of them require a strategy rewrite. All of them require Layer 1 and Layer 4 data joined in the same view.
Position flat, leads up: defending the strategy that's working
The mirror scenario is easier to celebrate and harder to defend. Rankings sit where they were last quarter, but booked consults are up double digits. The client's finance lead wants to know what changed, and the account team cannot point to a position chart to explain it.
The defense lives in the joined view of Layers 2 and 4. Impressions may be flat while CTR climbed on the query cohort that actually converts, which happens when snippet quality, structured-data eligibility, or brand recognition improves without a rank change 1. Alternatively, the query mix shifted toward higher-intent phrases—fewer top-of-funnel impressions, more bottom-of-funnel clicks—with average position holding because the losses and gains offset in the aggregate.
Pipeline reconciliation confirms which story is true. Cohort-matched Search Console data pulled against the client's booked-consult or qualified-lead records will show whether the converting queries and landing pages are the ones the agency has been working on. When they are, the QBR argument writes itself: the strategy targeted revenue-relevant surfaces, and the downstream data moved even though the vanity metric did not. The IAB's 2026 measurement report notes that fragmented attribution makes single-metric proof harder, which is exactly why the joined view carries more weight than any one dashboard 13.
 Illustrate Google's compare-segment-isolate-check debugging sequence referenced in the section, giving analysts a visual reference for the diagnostic workflow
Test Data-Driven SERP Analysis at Scale
Experience rapid, measurable SERP insights and publish real campaign content within your first week.
AI Overviews as a Search Console layer, not a parallel discipline
Half the vendor pitches landing in an agency inbox this year sell a separate AEO or GEO tracking stack for AI Overviews. Google's own documentation says that is unnecessary. AI Overview and AI Mode appearances flow through the same standard Search performance data Search Console already produces, and there are no additional technical requirements beyond the eligibility rules that already govern conventional Search—crawlability, indexing, useful content, page experience, and accurate structured data 2.
Read against the four-layer stack, AI Overviews are a composition-layer event with behavior-layer consequences. When an AI Overview appears above the organic block, Layer 1 records the new SERP shape; Layer 2 shows the impression and click impact through the same query and page reports the agency already segments. Google's 2025 guidance for AI experiences reinforces the point: pages must first be discoverable, crawlable, and indexable, and the same content quality and format signals that support standard Search support AI-feature inclusion 3. There is no parallel checklist to build, and no separate ranking API to buy.
The practical implication for agency delivery is that AI visibility should be reported inside the existing Search Console workflow, not in a bolt-on dashboard that duplicates the query set. Two additions are enough:
- Tag which query cohorts consistently trigger AI Overviews so behavior-layer analysis can control for their presence when explaining CTR changes.
- Treat AI-feature inclusion as an eligibility question routed through Layer 3, since structured data and page experience decide whether Google can use the page in the summary at all 2.
Anything beyond that is duplicate tooling defending a discipline Google says does not exist.
Scaled production and the compliance line agencies keep crossing
Agency delivery models that pushed monthly content volume from ten pieces per client to eighty ran headfirst into a policy update most competing pillar pages still skirt. In March 2024, Google formalized a scaled-content-abuse policy that took effect May 5, 2024, applying whether the material is produced through automation, human effort, or a combination 9. The spam policy defines the violation precisely: creating many pages primarily to manipulate Search rankings rather than help users 8. Production method is not the trigger; intent and value are.
That distinction protects legitimate scale and eliminates a common defense. An agency running a templated multi-location page program is not automatically offside; an agency shipping four hundred thin service-area pages that recombine the same paragraphs to chase long-tail impressions is, regardless of whether a writer or a model produced the words. Google's guidance on generative AI content applies the same test to model-assisted work: accuracy, quality, and relevance are the standards, and creators should avoid generating many pages without adding value 10.
The implication for SERP ranking analysis is that provenance and publishing pattern belong in the measurement stack alongside position and CTR. A senior strategist reviewing a client account needs visibility into publish velocity, template reuse, and cohort-level engagement on newly produced URLs—not to slow production, but to catch the pages that are drawing impressions without earning behavior. When Layer 2 shows a new cohort accumulating impressions with sub-baseline CTR and no downstream pipeline signal from Layer 4, that is the internal early warning. Waiting for a manual action or a core-update correction is a more expensive way to learn the same thing.
See How Data-Driven SERP Insights Can Streamline Multi-Client SEO Delivery
Connect with our specialists to explore scalable SERP ranking analysis workflows that reduce manual reporting cycles and deliver measurable outcomes across your client portfolio.
If you manage a portfolio of accounts: analyst hours as the real constraint
This section shifts scope from a single-account analysis to the delivery economics of a multi-client agency. The bottleneck at 10, 40, or 80 accounts is not tooling budget or data access. It is senior analyst hours, and specifically the ratio of hours spent collecting SERP data to hours spent interpreting it.
The four-layer stack multiplies data volume. Query-level SERP composition, Search Console cohorts, Core Web Vitals pass rates, and pipeline reconciliation each add fields per account. Google's own troubleshooting sequence—compare periods, segment by search type, isolate queries and pages, check technical, assess site-wide changes—is defensible per client but expensive when repeated by hand across a portfolio 6. Collection scales linearly with accounts. Interpretation does not, because judgment is the part that requires a senior strategist.
The worksheet below compares three delivery models using variables the reader supplies rather than invented benchmarks. Fill in accounts under management (A), hours per monthly report (H), and the blended senior rate (R) to see how per-account load shifts.
| Delivery model | Hours per account per month | Portfolio hours | Senior hours reallocated |
|---|---|---|---|
| Manual rank-tracker reporting | H | A × H | Baseline |
| Rank tracker plus Search Console pulls | H + collection overhead | A × (H + overhead) | Negative — collection grows faster than insight |
| Unified multi-signal analysis with automated collection | Judgment hours only | A × judgment hours | (H − judgment hours) × A available for diagnosis |
The point of the worksheet is not the exact number; it is the reallocation. When Layers 1 through 3 arrive pre-joined at the query cohort level, senior time moves from assembling reports to running the diagnostic sequence and defending the strategy in QBRs—which is what retention and margin actually depend on. The IAB's 2026 measurement report makes the same argument in a broader frame: AI-assisted reconciliation is becoming standard because fragmented sources make manual assembly the wrong place to spend expensive time 13.
What a defensible QBR looks like when rank isn't the headline
A QBR that leads with average position is a QBR that surrenders the narrative to whichever number moved most. A QBR built on the four-layer stack does the opposite: it tells the client what happened on the SERP, what users did about it, whether the site was eligible to compete, and what any of it produced downstream.
The order matters:
- Open with composition—how the SERPs for the client's priority queries actually looked this quarter, including AI Overview presence and feature encroachment, so the client sees the environment before the scoreboard 2.
- Move to behavior: impressions, clicks, and CTR read as a set at the query-cohort level, not the account average 1.
- Cover eligibility next—Core Web Vitals pass rates and structured-data validation on the URLs that actually earn impressions, since averages hide the failing templates 7.
- Close with pipeline reconciliation against the client's own booked-consult or qualified-lead data, presented as directional evidence rather than causal proof given the attribution fragmentation the IAB documents 13.
Two disciplines keep the meeting honest. Every claim carries the data source that produced it, and every diagnosis follows Google's compare-segment-isolate-check sequence rather than jumping to a fix 6. That is what turns a rank chart into a defense of the retainer.
Frequently Asked Questions
References
- 1.A Guide to Google Search Ranking Systems.
- 2.AI Features and Your Website.
- 3.Top ways to ensure your content performs well in Google's AI experiences on Search.
- 4.Beyond Rankings: Exploring the Impact of SERP Features on Organic Click-through Rates.
- 5.Suppressing the Search Engine Manipulation Effect (SEME).
- 6.Debugging declines in Google Search traffic.
- 7.Understanding Core Web Vitals and Google search results.
- 8.Spam Policies for Google Web Search.
- 9.What web creators should know about our March 2024 core update.
- 10.Google Search's guidance on using generative AI content.
- 11.Structured Data Markup that Google Search Supports.
- 12.General Structured Data Guidelines.
- 13.State of Data 2026: The AI-Powered Measurement Transformation: Implications for Attribution, Incrementality, and MMM.