
Key Takeaways
- Tracked positions are behavioral proxies for visibility potential, not scores. Interpret them alongside attention patterns, click behavior, and satisfaction proxies rather than reporting rank in isolation 7.
- Diagnose every flagged movement against four causes: real ranking change, SERP feature displacement, tracker volatility, or intent drift. Each has a distinct cue and a different operational response 9.
- Weight tracked keywords by commercial value and query quality before rolling them into reports, since identical positions on a mixed keyword set represent different economic outcomes 1, 4.
- Lead QBRs with impressions on the weighted keyword set, click-through against category baselines, and organic-assisted conversions, using position as the explanatory input that connects work done to observed outcomes 7, 10.
Why Position Numbers Stopped Predicting Client Outcomes
The quarterly business review script that worked in 2015 is now a liability. A client sees keyword X move from position 4 to position 7, opens the retainer conversation with concern, and the account team spends the first fifteen minutes defending a number that no longer maps cleanly to traffic, leads, or revenue. The position moved. The pipeline did not follow. Nobody in the room can explain the gap with confidence.
That gap is not a reporting failure. It reflects how search result pages actually work now. Users do not scan results top-to-bottom and stop at the first blue link. Large-scale interaction data from Bing shows examination behavior varies by individual and by task, meaning the same tracked position produces different outcomes depending on who searched and why 1. On feature-heavy pages, attention bounces between ads, answer modules, local packs, and organic listings rather than following the ranked order 5. A position-3 result sitting below an AI overview and a four-pack of ads is not the position-3 result agencies were selling five years ago.
For heads of SEO managing 15 to 80 accounts, the practical consequence is straightforward. Rank trackers still produce useful signal, but the signal has to be interpreted alongside attention, satisfaction proxies, and SERP composition 7. The rest of this piece lays out that interpretation model and how to defend it in front of clients.
Rankings as Behavioral Proxies, Not Scores
What a Tracked Position Actually Measures
A tracked position is a snapshot of where a URL appeared in a crawl of a results page for a specific query, from a specific location, on a specific device, at a specific moment. It is not a measure of how many people saw the listing, how long they looked at it, or whether they were satisfied with what they clicked. The distinction matters because agencies build client narratives on top of the number as if the number itself carries all four properties.
Rankings are outputs of multi-factor retrieval systems that blend content signals, technical factors, and authority inputs. A catalog of 40 positioning factors in academic search engines identified 12 direct and 28 indirect factors driving where a document lands 11. The commercial web operates on a similar principle: a tracked position reflects the interaction of dozens of upstream inputs with a query and a user context. Movement in the position number can come from changes to any of them, or from changes to the query mix a tracker samples.
Treated correctly, a position is a behavioral proxy—an estimate of visibility potential. Treated as a score, it invites clients to reward or punish work that had nothing to do with the movement.
The Pinball Pattern and Why 'Top 3 or Die' Misleads Clients
Clients still walk into QBRs asking why a keyword sits at position 5 instead of position 2, as if the delta between those positions maps to a proportional delta in traffic. On the pages users actually see today, it does not. Nielsen Norman Group's eye-tracking work on complex results pages found that users bounce between organic listings, answer modules, ads, and rich features in what the researchers called a pinball pattern rather than scanning top-to-bottom. On those complex pages, the sixth organic position received looks in 36% of cases, and the top-five results drew glance probabilities in the 40–80% range 6. The finding was based on eye-tracking sessions across feature-heavy SERPs, not a universal law, but the direction is clear: attention below position 3 is neither trivial nor predictable from rank alone.
This reframes the conversation account teams should be having. The value of a listing depends on whether it sits in a zone where the pinball gaze lands, and whether the surrounding SERP furniture pulls attention toward or away from it 5. A position-4 result next to a sparse answer module can outperform a position-2 result buried under an AI overview, a local pack, and four shopping tiles.
Agencies that keep pushing a rigid top-3 promise inherit two problems. The promise is technically achievable on some queries and structurally impossible on others, and clients cannot tell the difference. The more defensible commitment is a visibility model tied to attention zones, feature composition, and click behavior—one that treats position as an input rather than the outcome.
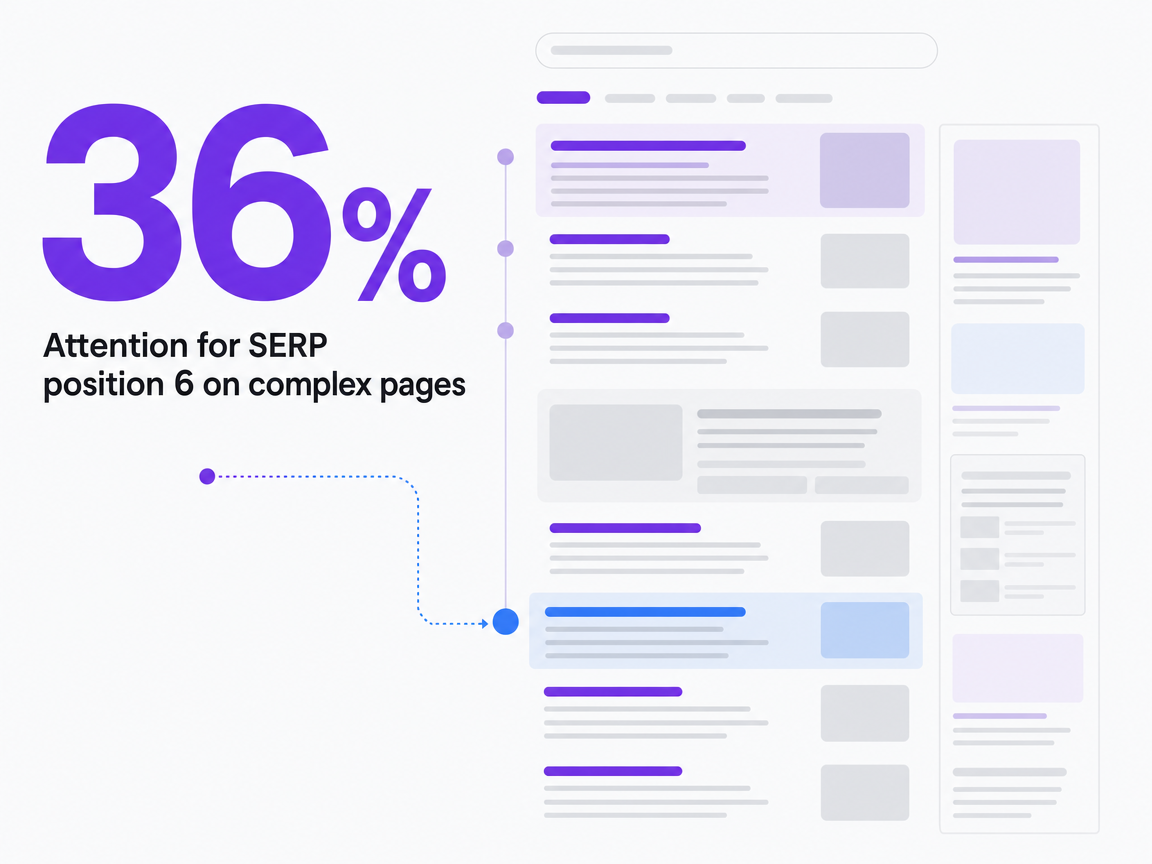 Attention for SERP position 6 on complex pages
Attention for SERP position 6 on complex pages
First-Page Dominance Still Sets the Ceiling
Rejecting the top-3 fixation is not the same as dismissing first-page importance. A demographic study of SERP behavior found that across every category measured—gender, age, and field of study—between 78.0% and 85.4% of users clicked 10 or fewer results per session 2. First-page real estate remains the ceiling on organic exposure for the overwhelming majority of sessions, regardless of who is searching.
The practical read for agency SEO leads is that page-1 versus page-2 is still the binary that matters most, while position-within-page-1 is a softer signal shaped by the pinball pattern and SERP composition. A move from position 12 to position 8 is a genuine outcome change. A move from position 5 to position 3 on a feature-crowded page may not be.
This has implications for how tracked keyword lists are curated. Terms sitting in positions 11–20 deserve monitoring because they represent the exposed edge of the ceiling. Terms already on page 1 benefit less from position-obsessed reporting and more from analysis of attention capture and click behavior at the position they hold.
See Real Client SERP Impact in Days
Track actual ranking shifts for your clients before committing to a long-term solution.
A Multi-Signal Interpretation Model for Client Reporting
Borrowing the Clicks-Attention-Satisfaction Frame
Google Research proposed a useful evaluation model called CAS: Clicks, Attention, and Satisfaction. The paper introducing it argued that a metric combining all three gives more accurate predictions of user actions and self-reported satisfaction than models built on clicks alone 7. The specific CAS metric was designed for internal SERP quality evaluation using proprietary behavioral data, so agencies cannot replicate it directly. The frame, though, transfers cleanly to client reporting.
A single-metric report answers one question: where did the keyword rank this week. A CAS-style multi-signal report answers a different set. Did the listing get seen. Did users engage with it. Did the click resolve the query or send the user back for more. Each layer picks up where the previous one leaves off. Position estimates visibility potential. Click-through rate from Search Console measures whether the listing earned the click at the position it held. Satisfaction proxies—dwell time, pogo-sticking rates, assisted conversions from organic sessions—indicate whether the click delivered on the query intent.
Structured this way, the report survives the client questions that break single-metric reports. When a position drops but conversions hold, the multi-signal view explains why. When rankings climb but revenue lags, the same view flags a snippet or intent problem instead of forcing the account team to hedge.
Precision, Recall, and the Metric Stack Behind a Position
Information retrieval evaluation has always stacked metrics rather than crowning one. The Springer reference entry on search engine metrics notes that precision and recall have been extended and adapted to many different types of evaluation and task, but remain the core of performance measurement 8. Precision asks whether the results returned are relevant. Recall asks whether the relevant results were returned at all. Neither reduces to a position number.
For agencies, the translation is that a tracked ranking sits inside a stack that also includes coverage (how many commercially relevant queries the domain ranks for at all), share of voice within the tracked set, and click-weighted visibility that adjusts for position. A client whose average position improved five points but whose ranking keyword count shrank is not winning. A client whose flagship term slipped two spots while long-tail coverage expanded may be. The metric stack forces the question the position number cannot answer on its own: relevant to what, and against whose retrieval set.
Snippet Quality as a Rank-Independent Lever
Two listings at the same position do not earn the same clicks. A peer-reviewed study on snippet selection found that readability of the snippet was an important indicator of document relevance and was associated with receiving significantly more clicks in a query log, including on results that did not sit at the top 10. The lever is title tag and meta description craft, and it operates largely independent of where the crawler places the URL.
This has direct reporting consequences. Click-through rate at a stable position is a signal the account team can move without waiting on algorithmic tides. A position-5 listing pulling a 4% CTR against a category baseline of 7% is a snippet problem, not a ranking problem. Rewriting the title and description can close that gap in the next crawl, and the change shows up in Search Console within days rather than the weeks or months a genuine rank improvement typically requires.
Framed this way, snippet quality gives agency SEO leads a fast-cycle lever to pair with the slower work of content and authority building. It also gives account teams a concrete answer when a client asks what improved this month at unchanged positions.
Diagnosing What a Ranking Movement Actually Means
Four Causes Behind a Position Change
A position move on Monday's report can come from at least four different sources, and the operational response to each is different. Confusing them is how analyst hours get wasted and how client trust erodes when the explanation shifts week over week.
- The first cause is a real position change: the URL genuinely moved in the ranked set because content, links, technical signals, or competing pages changed. This is what clients assume every movement means, and it is often the least common of the four.
- The second is SERP feature displacement. The URL holds the same organic slot, but a new answer module, local pack, or shopping unit pushed it down the pixel stack, or an existing feature disappeared and pulled it up. Competition-for-attention research treats the SERP as an ecology where features and organic listings vie for the same fixations, so the visible outcome shifts even when the ranked position does not 5.
- The third cause is tracker volatility. Bar-Ilan and colleagues examined how the average rank of a URL in the top ten changes between crawls and demonstrated that observed rank moves between rounds without any underlying content or algorithm change 9. Location, personalization, and sampling all inject noise into a single tracked number.
- The fourth is intent drift: Google reinterpreted the query, so the result set now favors a different content type entirely. The URL did not fall so much as it stopped matching what the query returns.
Each cause has its own diagnostic cue. Real change shows up in aligned Search Console impressions and clicks. Feature displacement shows up in the SERP screenshot. Volatility shows up in the multi-day trend line. Intent drift shows up in the type of URLs now ranking above the client.
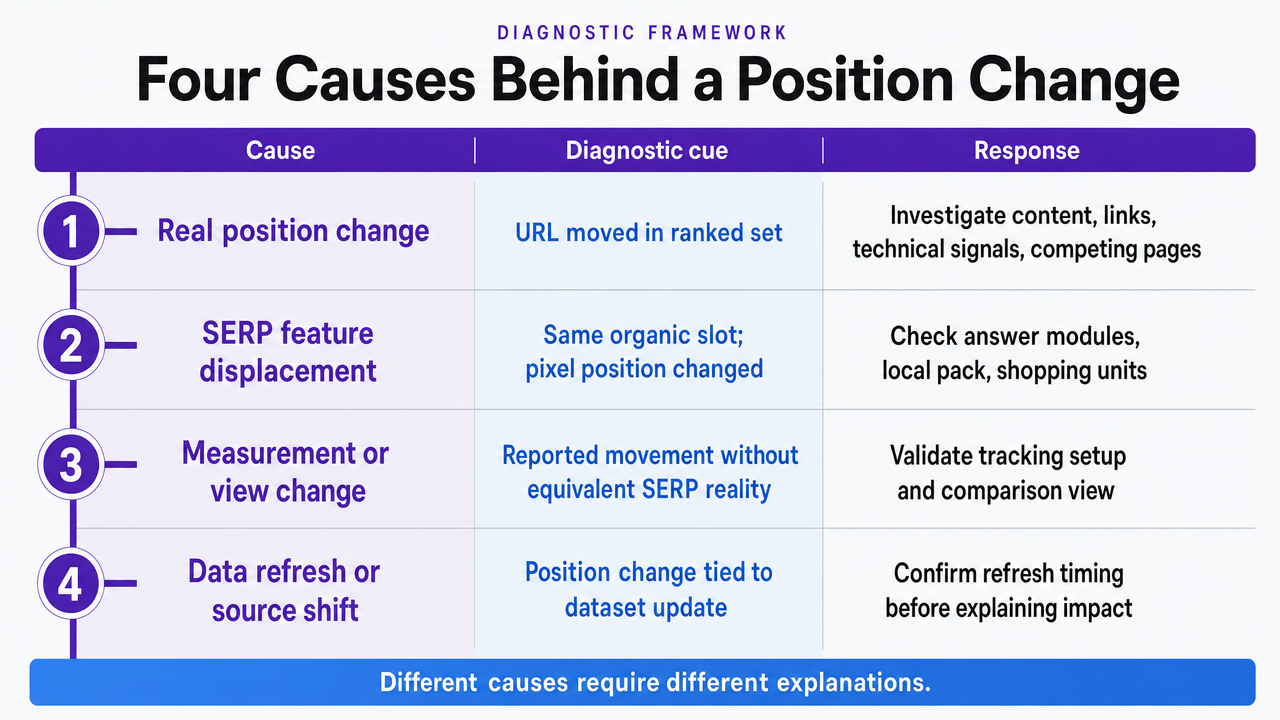 Convert the section's four-cause diagnostic framework into a scannable reference infographic showing each cause, its diagnostic cue, and the appropriate response — directly matching the article's cited framework
Volatility Bands vs. Signal: Defending Against Week-Over-Week Panic
Bar-Ilan et al. defined the average rank of a URL over a crawl round as a value between 1 and 10 and studied how that average changes between rounds, finding meaningful movement without corresponding changes in the underlying document 9. The takeaway for weekly client reports is that a two- or three-position wobble is often inside the noise floor of the measurement itself, not a signal of anything the account team did or failed to do.
Practically, this argues for two adjustments in reporting. Position figures should carry a volatility band drawn from the keyword's own recent history rather than the industry-wide averages third-party tools sometimes surface. A term that historically swings four spots week to week has not moved when it swings four spots this week. Second, weekly reports should surface trailing seven- or fourteen-day averages alongside the point-in-time position, so the QBR conversation anchors on the trend rather than the last crawl.
When a client escalates on a single week's drop, the defensible response is the volatility band and the trailing average. When both the band and the trend break, the movement is worth investigating.
SERP Feature Displacement and the Attention Economy
Feature displacement is the movement type most likely to be misread as failure. The URL still ranks at position 3, but an AI overview, a video carousel, and a people-also-ask block now sit above it, so the pixel depth to the listing has doubled and clicks have fallen. Nothing in the ranking data explains the traffic loss. Everything in the SERP layout does.
Competition-for-attention theory frames this directly: viewing behavior is shaped by the elements competing for a user's focus on the page, not just the ordered list 5. When a new module enters the SERP, it does not merely add a row; it redirects the gaze pattern away from listings that used to catch attention. A position-3 organic result on a clean SERP and a position-3 result buried under three feature blocks are the same rank and different products.
The reporting move is to pair every tracked position with a SERP feature inventory captured at the same crawl. When impressions hold but clicks fall at a stable position, the feature stack above the listing is usually the story. That is a snippet and structured-data conversation, not a ranking one.
See How Accurate SERP Tracking Drives Real Client Outcomes at Scale
Connect with experts to benchmark your SERP tracker performance, interpret ranking volatility, and optimize reporting systems for multi-client environments—without adding analyst headcount.
Weighting Keywords by Query Quality and Commercial Value
Why a Flat Keyword List Distorts the Story
Most client rank reports treat every tracked term as if it carried equal weight. A 200-keyword set produces an average position, a share of terms in the top 10, and a count of movers. The math is clean. The story it tells is misleading.
Not all queries examined by users lead to the same outcome. Waterloo eye-tracking research on how users move from query to first action found that query quality itself shaped whether the searcher clicked a result or reformulated, with reformulation traced to examination patterns that failed to surface a relevant result 4. Two keywords sitting at position 3 can produce entirely different downstream behavior depending on how well the query matches what the SERP returns. A flat list averages these outcomes together and hides the queries that matter most to pipeline.
Bing interaction data reinforces the same point from a different angle: examination behavior varies by individual and by task, so identical rankings across a mixed keyword set represent different economic products 1. Averaged reporting collapses that variance. The keywords a client's revenue actually depends on get buried in the same summary line as the informational tail.
A Query Classification Approach for Account Teams
The corrective is to classify tracked terms along two axes before rolling them into a report: commercial value and query quality.
Commercial value : The account team's judgment about pipeline contribution—transactional and high-intent local terms sit at the top, comparison and category terms in the middle, informational and brand-defensive terms at the base.
Query quality : A behavioral judgment about how cleanly the SERP resolves the search. Waterloo's finding that reformulation traces to examination patterns missing a relevant result gives the operational cue: queries where the client's page type genuinely matches what the top results return are high-quality; queries where intent is contested or the SERP is dominated by a mismatched content type are low-quality regardless of where the client ranks 4.
Crossing the two axes produces a working matrix.
- High-value, high-quality terms drive the QBR narrative and receive the weekly diagnostic attention outlined earlier.
- High-value, low-quality terms flag intent problems the content team should address before further ranking work.
- Low-value terms of either kind stay in the tracker for coverage and share-of-voice math but do not lead the report.
Bing's demonstration that examination patterns vary by task supports keeping the classification query-specific rather than category-wide 1. The output is a ranking report that answers the client question that actually matters: how are the terms tied to revenue moving, and what is happening on the SERPs where intent is still being contested.
Translating Rank Data into Pipeline Conversations
Building the QBR Narrative Around Attention and Satisfaction
The QBR opens better when the account team leads with what happened to attention and satisfaction, then folds ranking movement in as the input that shaped both. A client hearing "impressions rose 22% on our high-value term set, click-through held at the category baseline, and organic-assisted conversions grew" is having a business conversation. A client hearing "average position improved 1.4 spots" is being asked to trust a proxy.
The sequence that holds up in front of a skeptical stakeholder starts with visibility on the weighted keyword set, moves to click behavior at the positions held, and ends with satisfaction proxies drawn from analytics—dwell time, return-to-SERP rates, and organic-sourced pipeline. This mirrors the Clicks-Attention-Satisfaction logic that outperforms click-only evaluation for predicting user actions 7. Position sits inside the story as the explanatory variable that connects work done to outcomes observed. When the three layers move together, the account team has a clean win. When they diverge, the narrative names the specific gap—snippet, intent, or feature displacement—and points to the next month's work.
If You Manage a Portfolio of Accounts: Scaling the Interpretation Layer
For heads of SEO running 15 to 80 accounts rather than a single retainer, the interpretation model has to survive contact with limited analyst hours. A weekly report built from scratch per client—position pull, SERP screenshot review, Search Console cross-reference, snippet audit, volatility check—consumes hours no portfolio can afford at scale.
The leverage point is the interpretation layer itself, not the tracker. The tracker produces the same position data it always did. The scalable asset is a standardized diagnostic that runs across every account: the four-cause movement classifier applied to every flagged keyword, volatility bands calculated from each keyword's own history, and a query-classification matrix maintained per client. Once the framework is codified, analysts spend their time on the queries flagged as high-value with genuine signal change, not on defending noise or re-explaining feature displacement account by account.
This is where AI-assisted execution platforms earn their place in the stack. Systems that read live signals across content, technical, and search performance data—and route ranked recommendations through human approval—compress the analyst hours per account without removing the strategic judgment the client is paying for. Vectoron builds toward that operating model: the interpretation layer becomes the retained asset, and the reports scale with the portfolio instead of the headcount.
Frequently Asked Questions
References
- 1.Large-Scale Analysis of Individual and Task Differences in Search Result Page Behavior.
- 2.An analysis of user behaviors on the search engine results pages based on the demographic characteristics.
- 3.Eye-Tracking Analysis of User Behavior in WWW Search.
- 4.Patterns of Search Result Examination: Query to First Action.
- 5.Search Results Pages and Competition for Attention Theory.
- 6.Complex Search-Results Pages Change Search Behavior.
- 7.Incorporating Clicks, Attention and Satisfaction into a Search Engine Result Page Evaluation.
- 8.Search Engine Metrics.
- 9.Methods for comparing rankings of search engine results.
- 10.Beyond Query-Oriented Highlighting: Investigating the Effect of Snippet Readability on Search Results Selection.
- 11.Identification of Positioning Factors in Academic SEO (ASEO).