
Key Takeaways
- Treat average position as a diagnostic signal only, since Google aggregates it across queries, pages, countries, devices, and search appearances, hiding the dimensions that actually matter 2.
- Separate visibility from position by tracking SERP features and AI Overview impressions on their own trend lines, because a page can gain presence while its blue-link rank falls 15.
- Tie rank data to clicks, conversions, and revenue in an outcome layer, so a drop out of the top five becomes a material event rather than a vanity shift 13.
- Design the collection pipeline around the 50,000-row-per-day API ceiling by tiering pulls and reserving the expensive page × query join for a curated keyword set 4, 5.
- Standardize country, device, date window, and search type on every API call and label live SERP captures separately, so records remain comparable across time and clients 11, 12.
- Make Google's ranking status history a first-class annotation in the warehouse, shading rollout windows like the March and May 2026 core updates and deferring interpretation until after completion 7, 8, 9.
- Tier escalations into monitoring notes, review tickets, and incidents, and follow Google's diagnostic order—rollouts, search type, seasonality, then page and query—before touching content 14.
- Run quarterly QA on keyword sets using precision and recall against actual impression data, pruning dead queries and adding recall gaps rather than reorganizing wholesale 19.
Why Position Alone Stopped Scaling
The agency that still ships a weekly PDF of keyword positions is selling a product Google has quietly deprecated. Average position in Search Console is defined as an aggregated metric across queries, pages, countries, devices, and search appearances 2. It is not a direct reading of where a client ranks but a weighted summary of their appearance under conditions the client did not control and the agency did not standardize.
The variance underneath that number has grown. Google's own documentation states that ranking considers query words, relevance, usability, location, past Search history, and settings, and that the weight applied to those factors varies by query 11. Peer-reviewed work on personalization confirms that login state, cookies, and temporal churn change result ordering above a measurable noise floor 12. A single manually captured SERP is one draw from a distribution, not the distribution itself.
Scale compounds the problem. A Head of SEO running 40 clients across three verticals cannot defend 40 single-number trend lines when each one hides device splits, SERP feature shifts, and rollout-window noise from events like the March 2026 core update 8. The deliverable has to change shape. Position belongs inside a governed pipeline — standardized collection conditions, documented API limits, annotated update timelines, and a direct line from rank to clicks, conversions, and revenue. The rest of this piece specifies that system.
The Three-Layer Reporting Stack
Layer 1 — Position as a Diagnostic Signal
Position belongs on the bottom of the stack, not the top. The data is cheap to collect, moves daily, and tells an operator where to look next — but it does not, on its own, tell anyone whether a client is winning.
The cleanest definition comes from Google: average position in Search Console is the average position of a site, URL, or query in Search results, computed as an aggregate across queries, pages, countries, devices, and search appearances 2. That aggregation is the point. One average-position number for a client property mixes a branded query ranking 1.1 on mobile in Chicago with a long-tail commercial query ranking 42.3 on desktop in Phoenix, then collapses the two into a single line on a chart.
A scalable Layer 1 pulls position as a dimensioned record, not a scalar. The minimum useful breakdown is query × page × device × country, which matches the dimensions Google itself exposes through the Performance report and Search Analytics API 2. Google's ranking systems operate at page level and apply different weights to different query types 10, so collapsing those dimensions destroys the diagnostic value before analysis begins.
Layer 1 answers one question: where did this specific page appear for this specific query, under these specific conditions, this week. Nothing more.
Layer 2 — Visibility Beyond the Blue Link
Position measures ordering within one surface. Visibility measures presence across all the surfaces Google now puts between a query and a click. Treating these as the same metric is where most agency dashboards break first.
The Search Console Performance report already breaks impressions down by search appearance, which lets Layer 2 record whether a client's page surfaced inside a featured snippet, sitelink, product result, FAQ block, or image pack rather than just a standard blue link 2. A page that moves from position 3 to position 5 while gaining a featured snippet is not losing visibility; it is gaining it. A page that holds position 2 while a local pack and three ads push it below the fold is not holding visibility; it is losing it. Layer 1 cannot see the difference. Layer 2 is built to.
AI surfaces now sit inside this layer as well. Google's generative AI performance report in Search Console exposes impressions, pages, countries, devices, and dates for URLs appearing in AI Overviews and AI Mode 15. Those impressions are not equivalent to a traditional ranking position and should carry their own column, their own refresh cadence, and their own trend line in client reports.
Layer 2 answers a different question than Layer 1: in how many places, and in what forms, did this client appear for the queries that matter. Impressions, SERP feature inventory, and AI-feature exposure are the three streams that belong here, each labeled by its source so no one later averages them into a single misleading number.
Layer 3 — Outcome, Where Rank Earns Its Place
Layer 3 is what the client is actually paying for. Clicks from Search Console, sessions and conversions from analytics, booked appointments from call tracking, and revenue from the CRM — joined back to the same query, page, device, and location keys used in Layers 1 and 2. Without that join, position data is trivia.
The reason position still deserves a seat at the table is the shape of user attention, not the number itself. A 2021 analysis of real-world web-tracking data found that 97.11% of observed Google clicks landed on first-page results and more than 86% landed in the top five, within that study's sample of tracked users and queries 13. The figures are not a universal CTR curve — they describe one research panel's behavior across a mix of queries, devices, and SERP layouts — but the direction is consistent enough to justify treating movement in and out of the top five as a material event, not a vanity shift.
Layer 3 is also where the escalation logic lives. A ranking drop that costs zero conversions is a monitoring note. A stable ranking that costs 40% of booked calls is an incident. Only the outcome layer can distinguish the two, and only an agency that reports at Layer 3 can defend retainers through an update cycle.
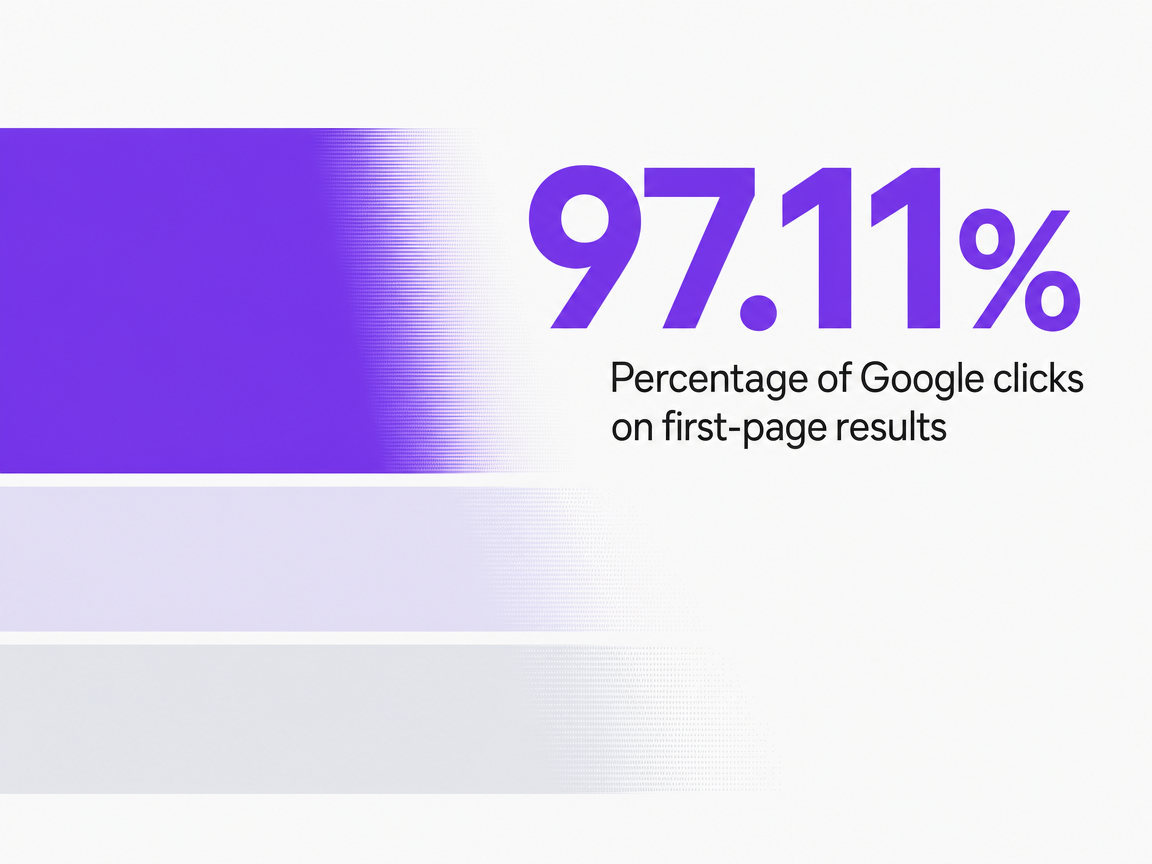 Percentage of Google clicks on first-page results
Percentage of Google clicks on first-page results
Designing the Collection Pipeline Around Google's Hard Limits
The 50,000-Row Ceiling and What It Forces
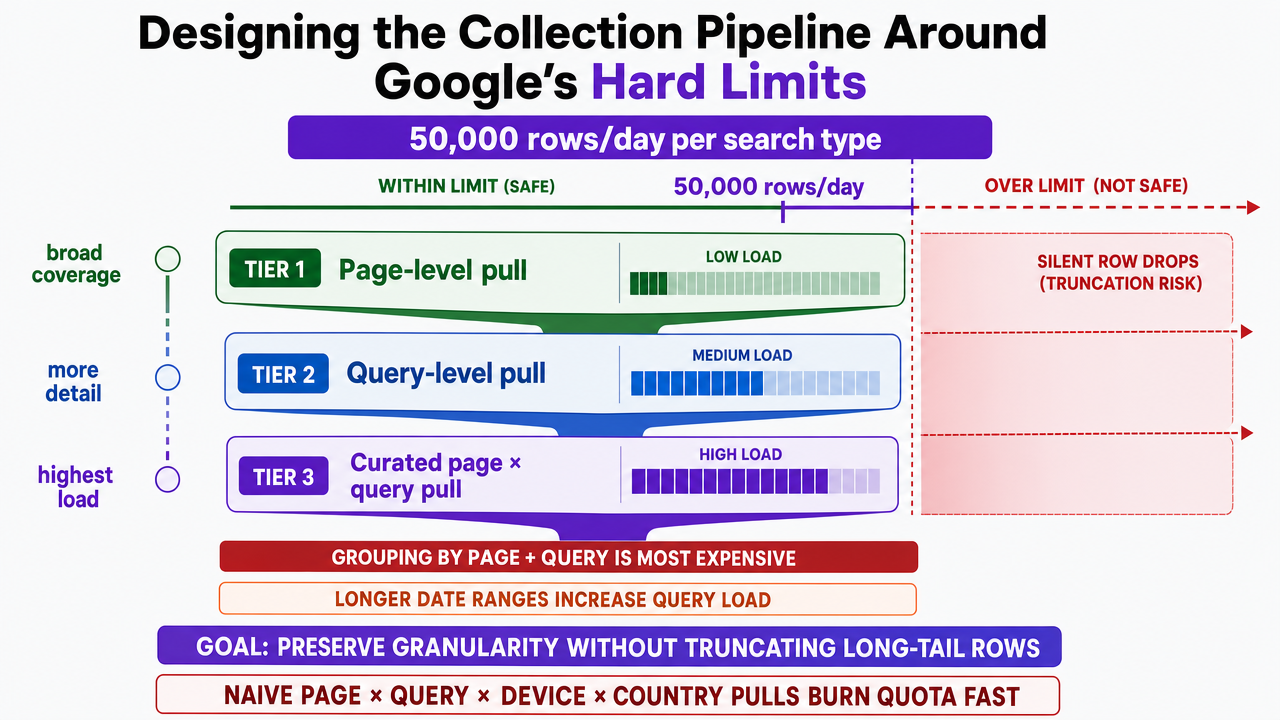
The Search Analytics method of the Search Console API returns a maximum of 50,000 rows of data per day per search type 4. That number is the single most important design constraint in any multi-client rank pipeline, and most agencies discover it only after a dashboard quietly starts truncating long-tail queries for their largest clients.
The constraint compounds under grouping. Google documents that queries grouped or filtered by both page and query are the most expensive, and that longer date ranges increase query load 5. A pipeline that naively pulls page × query × device × country for every property, every day, will burn through quota on the clients that need the most granularity and silently drop rows on the clients with the deepest keyword footprints. The API returns rows grouped by requested dimensions but does not guarantee all rows and generally returns top rows 3, which means the data that disappears is usually the long-tail traffic an agency most wants to monitor for emerging opportunity.
The design response is tiering. A scalable collector splits each client property into three pulls per day per search type:
- a page-level pull for site-wide position and impression trends,
- a query-level pull for topic coverage, and
- a focused page × query pull restricted to a curated keyword set — the queries that drive conversions, the pages that house money content, and the branded terms that function as a reputation canary.
The curated set is what keeps the expensive join inside the 50,000-row envelope. Everything else is reconstructed through less costly single-dimension pulls and joined downstream. Treating the row cap as a hard physical limit, rather than a soft recommendation, is what separates a pipeline that scales to 150 clients from one that silently loses fidelity at 25.
Standardizing Collection Conditions
Google ranks results using query words, relevance, usability, location, past Search history, and settings, and the weight applied to those factors varies by query 11. Research on personalization confirms that logged-in status and cookies change Google's result ordering, with consistent but modest differences between users and measurable temporal churn even for the same query 12. A rank record collected without stated conditions is not comparable to the next one.
Standardization at the pipeline level means fixing the variables an agency can actually control and labeling the ones it cannot. Country and device are supplied as explicit dimensions in every API call rather than inferred from a sampled aggregate 3. Date windows are defined in the client's reporting time zone and held constant across comparisons. Search type — web, image, video, news — is captured as its own field, because the 50,000-row cap applies per search type and mixing them hides the ceiling.
For the queries that still require live SERP capture — local pack composition, AI feature presence, feature ownership — the collector pins location to a defined geo, uses a clean browsing context, and records the collection timestamp alongside the result. Those captures sit beside Search Console data, never on top of it. The two sources answer different questions, and conflating them is how agencies end up explaining to a client why a tool's rank-3 reading disagrees with a Search Console average position of 7.4 for the same URL.
The Client Rank Record Schema
Every row that enters the warehouse carries the same fields, regardless of which client or search type produced it. The minimum schema reflects what Google's ranking systems actually evaluate and what the Search Console API actually exposes 3, 10:
- keyword_id, query_text, intent_label
- location_id, country, geo_target
- device (desktop, mobile, tablet)
- search_type (web, image, video, news)
- page_url, canonical_url
- serp_feature_set (featured snippet, local pack, AI Overview, image pack, sitelinks)
- position (average, as defined by Google 2)
- impressions, clicks, ctr
- conversions, conversion_value
- collection_timestamp, source (sc_api, sc_24h, live_capture)
- annotation_id (foreign key to the update/event table)
Two fields do most of the operational work. The source field preserves the provenance distinction between stable Search Console data and the 24-hour view, which Google introduced for shorter-latency monitoring but which should complement rather than replace weekly and monthly comparisons 6. The annotation_id joins each row to the ranking event timeline covered in the next section, so no analyst ever has to overlay dates by hand when a client asks what moved in the second week of May.
The schema is deliberately flat. Every reporting layer — position, visibility, outcome — reads from the same table and filters by dimension. That is what makes the system additive across clients instead of bespoke per client.
 Visualize the tiered collection pipeline workflow (page-level pull, query-level pull, curated page × query pull) that keeps extraction under the documented 50,000-row-per-day API ceiling
Track and validate client keyword rankings instantly
Experience live rank tracking and reporting workflow on real client sites before making a commitment.
Annotating Google Events So Reports Survive Update Season
The second week of April is when the client emails start. Rankings moved, calls dropped, someone saw a competitor jump three spots on a branded query — and the agency has one meeting to explain whether this was Google, the site, or neither. The only reliable way to answer that question at portfolio scale is to make Google's own event timeline a first-class field in the warehouse.
Google maintains an official ranking status history that records core updates, spam updates, and other ranking-related events as structured incidents with release and completion dates 7. Each incident on that dashboard is a candidate annotation. For example, the March 2026 core update began on March 27, 2026 and completed on April 8, 2026 8. The May 2026 core update began on May 21, 2026 and completed on June 2, 2026 9. Together with the December 2025 core update and the August 2025 spam update also catalogued on the ranking history page 7, these windows define the shaded regions that belong on every client's position chart for the year.
Two operational rules follow. First, no position movement inside a rollout window gets interpreted as a final outcome. Google states that core updates can change many pages simultaneously, which makes before-and-after attribution during an unfinished rollout unreliable 8. The evaluation window opens after the completion date, not after the announcement date. Second, the annotation layer records the event even when the client's own data looks flat. A client whose average position did not move during the May 2026 rollout is a data point about the client's content, not a reason to omit the annotation from the chart.
The schema does the actual work. Each row in the rank record carries an annotation_id, and the event table carries the start date, end date, type (core, spam, product review, system-specific), and official status URL. When an analyst opens a client dashboard, the rollout windows are already shaded, the labels are already attached, and the conversation shifts from "what happened" to "what the post-rollout data says about our content assumptions." That is the difference between a report that survives update season and one that generates emergency calls.
Escalation Rules: When a Drop Becomes a Ticket
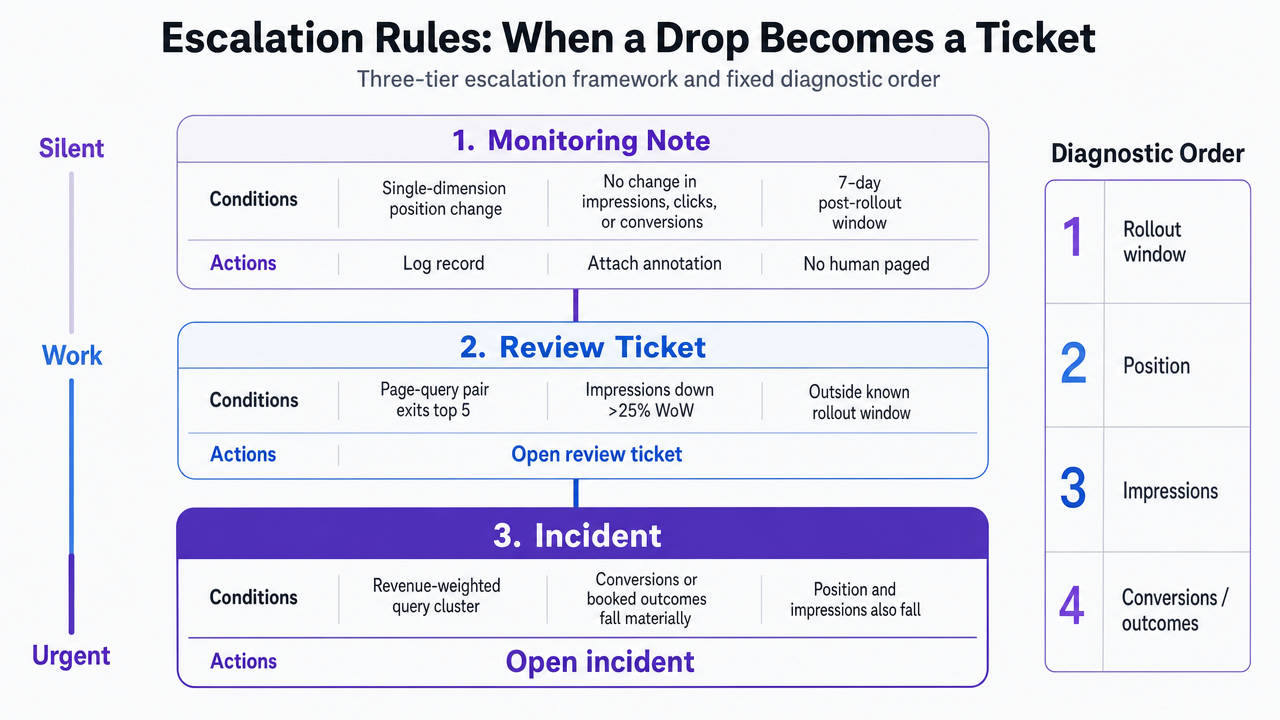
A pipeline that flags every red cell in a dashboard trains analysts to ignore the dashboard. The point of an escalation layer is to turn position movement into a tiered response, so that noise stays silent and material loss generates work.
Three thresholds define the tiers.
- A monitoring note covers any single-dimension position change that does not alter impressions, clicks, or conversions for the affected page-query pair over a seven-day post-rollout window. The record is logged, the annotation is attached, no human is paged.
- A review ticket opens when a tracked page-query pair crosses out of the top five, or when impressions drop more than 25% week-over-week outside a known rollout window 8, 9.
- An incident opens when conversions or booked outcomes for a revenue-weighted query cluster fall materially while position and impressions are flat — the signal that something downstream of ranking, not ranking itself, has broken.
The diagnostic order is fixed. Google's own debugging guidance for traffic drops starts with platform-wide events, search type filters, seasonality, and date comparisons before examining query and page segments 14. A scalable escalation runbook follows the same sequence:
- check the annotation table for an active rollout,
- filter by search type to isolate web from image or news,
- compare year-over-year to rule out seasonality, then
- narrow to the page and query clusters that moved.
Content and link hypotheses come last, not first. That ordering is what keeps a small team from rewriting a page in response to what turns out to be a demand shift or a SERP feature change.
 Visualize the three-tier escalation framework (monitoring note, review ticket, incident) with its fixed diagnostic order, since this section defines a governance workflow
QA for Keyword Sets: Precision, Recall, and Portfolio Hygiene
Keyword sets rot. New services launch, old pages redirect, intent shifts, and the curated query list that was defensible in January is quietly tracking irrelevant terms by August. Without a QA cadence, the expensive page × query pulls described earlier spend quota on noise and miss the queries that actually matter.
The cleanest evaluation frame comes from information retrieval. NIST defines precision as the proportion of retrieved documents that are relevant, and recall as the proportion of relevant documents that are retrieved 19. Applied to a client keyword set, precision asks what share of tracked queries still map to a page the client monetizes. Recall asks what share of the queries the client actually earns impressions and clicks for are present in the tracked set at all. Both numbers degrade on different schedules, and both need to be computed, not estimated.
A quarterly QA pass runs three checks against the warehouse:
- Pull the top 1,000 queries by impressions from the Search Console API for each property 3 and compare against the tracked set; queries driving material impressions but absent from tracking are recall gaps and get added.
- Flag tracked queries with zero impressions over 90 days as precision candidates for removal.
- Re-verify intent labels against the current ranking page, because Google's ranking systems operate at page level and a URL swap can silently invalidate the mapping 10.
The output is a short diff — adds, removes, relabels — reviewed by a strategist, not a reorganization of the entire set.
See How Top Agencies Track and Scale SEO Rankings Across Every Client Account
Connect with our team to learn how leading agencies standardize rank tracking, automate reporting, and maintain strategic control—without expanding headcount or manual workload.
Portfolio Economics of a Defensible Rank Layer
The business case for productizing the rank layer is not a line about efficiency. It is the shape of the cost curve as clients are added. Three variables determine it: API quota consumed per property, analyst hours spent on collection and QA, and annotation plus incident-review hours spread across the portfolio. The Search Console API caps extraction at 50,000 rows per day per search type 4, and queries grouped or filtered by both page and query carry the heaviest quota load 5. Those two facts, not tool pricing, dictate the architecture.
The table below uses only sourced variables and the quota ceiling. Pricing is deliberately absent because it is site-specific and not present in the research.
| Portfolio size | API calls/day (bounded by 50k rows/day/search type per property 4) | Analyst hours/client/month | Annotation + QA hours/month (portfolio-wide) | Marginal cost per added client |
|---|---|---|---|---|
| 10 clients | Up to 50k rows × search type, per property | ~4–6 | ~8–12 | High (fixed costs spread thin) |
| 50 clients | Same per-property ceiling; tiered pulls required to stay under cap | ~2–3 | ~16–24 | Falling (annotation reused) |
| 150 clients | Same per-property ceiling; curated page × query sets mandatory 5 | ~1–1.5 | ~24–40 | Flattening (schema and runbook amortized) |
Two mechanics drive the flattening. Annotation work is portfolio-wide, not per-client: the March 2026 and May 2026 core update windows 8, 9 are entered once and attached to every chart through the annotation_id join. Escalation runbooks compound the same way — Google's traffic-drop diagnostic sequence 14 is codified once and executed against any client whose metrics trip a threshold.
The curve is the actual argument for productizing rank tracking. An agency running bespoke reports pays roughly linear labor cost per client. An agency running a governed pipeline pays a steep fixed cost early and marginal cost that approaches the price of an additional API pull and a few analyst minutes. Delivery margin at 150 clients is a function of how disciplined the schema and escalation layer were at 10.
What to Stop Reporting
Three artifacts belong in the archive, not the next client deck.
The single site-wide average position line is the first to retire. Google computes average position as an aggregate across queries, pages, countries, devices, and search appearances 2, which means a flat line can hide a 30% drop on money queries offset by branded gains, and a declining line can reflect expanded impressions on long-tail terms the client never cared about. The number is not wrong; it is unreadable without the dimensions underneath it.
The 24-hour view belongs in the operations channel, not the monthly report. Google positioned the shorter-latency view for recent-data monitoring alongside, not in place of, stable comparison windows 6. Hourly movement is anomaly-detection fuel for analysts; presenting it to clients trains them to react to noise.
Structured-data validation screenshots are the third. Valid markup makes a page eligible for rich results but does not guarantee display 16, so reporting "valid" as a win inflates expectations the SERP will not meet. Track eligibility status in the warehouse, surface it only when a rich result is actually earned or lost.
Frequently Asked Questions
References
- 1.How To Use Search Console.
- 2.A deep dive into Search Console performance data filtering and limits.
- 3.Search Analytics: query | Search Console API - Google for Developers.
- 4.Getting your performance data | Search Console API.
- 5.Usage Limits | Search Console API.
- 6.An improved way to view your recent performance data in Search Console.
- 7.History for Ranking | Google Search Status Dashboard.
- 8.March 2026 core update - Google Search Status Dashboard.
- 9.May 2026 core update - Google Search Status Dashboard.
- 10.A Guide to Google Search Ranking Systems.
- 11.How Does Google Determine Ranking Results.
- 12.Measuring Personalization of Web Search.
- 13.You Are How (and Where) You Search? Comparative Analysis of Web Search Behaviour Using Web Tracking Data.
- 14.Debugging drops in Google Search traffic.
- 15.Introducing Search Generative AI performance reports in Search Console.
- 16.Completeness.
- 17.Local Business (LocalBusiness) Structured Data.
- 18.Web Vitals.
- 19.NIST Special Publication 500-274.