
Key Takeaways
- Rank reports describe pre-click opportunity, not revenue earned. Renewal conversations now require a visibility-to-revenue chain spanning Search Console, GA4, CRM, and incrementality testing 1.
- Build reporting as four layers: pre-click visibility in Search Console, post-click behavior in GA4, revenue tie-out through ecommerce events or CRM, and incrementality signal from holdouts or geo tests 6.
- Replace blended numbers with a three-column scorecard separating sourced revenue, assisted revenue, and estimated incremental revenue, each labeled with its attribution model, lookback window, and confidence note 4.
- Diagnose dips by decomposing clicks, impressions, CTR, and position before touching rankings, and scale across clients by templatizing API pulls so analyst hours focus on interpretation 9.
Why rank reports lose renewals
A monthly deck full of green up-arrows next to keyword positions no longer wins the renewal conversation. CFOs and marketing directors ask a different question now: what did organic search contribute to the pipeline, and how is that contribution measured? Rank movement, on its own, cannot answer either part.
The reason is structural. Position is a pre-click signal. Google's own guidance separates Search Console metrics—impressions, clicks, click-through rate, and average position—from the on-site behavior, conversions, and revenue that Analytics captures after a visitor arrives. It notes the two systems will not reconcile exactly because they measure different events under different processing rules 1. A rank report sits entirely on one side of that boundary. It describes an opportunity to earn a click, not a dollar earned.
Academic work reinforces this limit. Click-through rate is best treated as an intermediate proxy for the advertiser's real outcome, and naive click-based attribution can overstate value when organic and paid clicks substitute for one another 6. Rankings sit one step further upstream than CTR. Reporting them as the headline KPI asks a client to trust a chain of inferences the deck never shows.
Agencies that keep renewing have moved the conversation to a visibility-to-revenue chain: what showed up in search, what earned the click, what the visitor did, what the business booked, and how much of that would have happened anyway. The sections ahead lay out that chain as a four-layer measurement stack and the scorecard that goes with it.
The four-layer measurement stack
Layer 1 — Pre-click visibility in Search Console
Search Console owns the pre-click half of the keyword story. It records what Google showed, what query triggered the impression, which page received it, and whether a user clicked. Impressions, clicks, CTR, and average position all live here, broken down by query, page, country, device, date, and search appearance 2. Nothing in Search Console describes what happened after the click.
This boundary is the first thing to make explicit in a reporting architecture. Google's own guidance draws it in plain language: Search Console reports activity before a visitor arrives, Analytics reports activity after, and the two will not reconcile exactly because they measure different events under different processing rules 1. A keyword dashboard that treats GSC clicks and GA4 organic sessions as the same number invites the first client challenge of the quarter.
For agency-scale reporting, the Search Console API is the delivery mechanism. It returns the same dimensions available in the UI and feeds scheduled pulls into a warehouse or Looker Studio layer 2. One caveat matters for client defense: API responses do not always return every row and tend to prioritize top-performing queries, which makes the API a reliable monitoring source but not an exhaustive historical archive 2. Bulk exports fill that gap when deep retrospective analysis is required.
The failure mode at this layer is SERP feature absorption — a ranking improvement that does not produce proportional clicks because a shopping unit, answer panel, or local pack is taking the attention. The visibility layer must be read with SERP composition in view, not in isolation.
Layer 2 — Post-click behavior in GA4
Once the click lands, the measurement shifts to GA4. The relevant signals are landing page, source and medium, sessions, engaged sessions, and key events — the on-site behaviors that connect a keyword's inbound traffic to intent and progression 1. Position and CTR disappear from the view; scroll, form starts, booking widgets, and lead events replace them.
The dominant failure mode at this layer is event hygiene. Duplicate events, missing parameters, misfiring triggers, consent-driven data loss, and inconsistent landing-page tagging all distort the keyword-to-behavior join before any revenue question is asked. Google itself names implementation, consent, time zones, attribution models, canonical URLs, traffic-type differences, non-HTML pages, and bot filtering as common drivers of discrepancy between Search Console and Analytics counts 1. Any of these can make a well-ranked keyword look dead on the GA4 side.
The practical move at Layer 2 is to lock a shared landing-page key between GSC and GA4 and treat it as the join column for every client report. Pages, not queries, are what both systems agree on with the least slippage, and both systems support page-level breakdowns natively. Everything else — session counts, engagement rates, key event rates per keyword cluster — rolls up from that join.
Behavior is still not revenue. It is the bridge between a visible keyword and a measurable outcome, and it is the layer where most agency reports stop. The next layer is where the revenue conversation actually begins.
Layer 3 — Revenue tie-out through ecommerce events and CRM
Revenue enters the stack through a purchase event or a CRM-logged outcome. For ecommerce clients, GA4's documented pattern is to send a purchase event with items, transaction ID, and an explicit currency so revenue is calculated correctly and not double-counted across refunds, tax, and shipping 4. For service-business clients — law firms, dental groups, behavioral health, home services, senior living — the equivalent is a qualified lead, booked appointment, or signed matter captured in a CRM or call-intelligence system and joined back to the organic landing page that produced the session.
The tie-out depends on three joins holding at once:
- the keyword-to-landing-page join from Search Console,
- the landing-page-to-session join inside GA4, and
- the session-to-outcome join against ecommerce or CRM records.
Each join degrades under consent loss, cross-device gaps, and attribution-window choices. Google explicitly flags refunds, duplicate purchase events, missing currency, and consent-related data loss as common sources of unreliable reported revenue 4.
Keyword-level revenue reporting is not a free number from the platform. It is a modeled rollup from landing-page revenue, allocated to the queries and clusters that produced the sessions behind those pages. The honest version of this report labels the allocation method — last non-direct, data-driven, or first-touch — rather than presenting a single blended figure as fact.
The failure mode at Layer 3 is treating attributed revenue as proof of impact. It is sourced revenue, which is useful. It is not incremental revenue, which is what the fourth layer exists to estimate.
Layer 4 — Incrementality signal from holdouts and geo tests
Attributed revenue answers the question "which organic sessions preceded a purchase." It does not answer "how much of that revenue would have happened without the SEO work." Those are different questions, and the gap between them is where renewal arguments are won or lost.
The cleanest demonstration of that gap comes from a large eBay field experiment on paid search. When branded paid ads were turned off, 99.5% of the forgone paid clicks were immediately recaptured by the site's own organic results — the paid attribution report had been crediting ads for clicks that would have arrived anyway 5. This study highlights how click-based attribution can overstate a channel's effect when a second channel is available to catch the same demand.
The implication for SEO reporting is that an incrementality column has to exist, even if it is populated conservatively. The tools are:
- geo-based holdouts,
- de-indexing or noindex tests on expendable page sets,
- pre/post analysis on content launches with matched control pages, and
- paid-search pause tests that isolate what organic actually carries.
NBER's broader review of digital measurement treats CTR and attributed conversions as intermediate proxies and recommends experimental designs when a channel's causal contribution is in question 6.
No agency runs incrementality tests on every client. The operational standard is to run them on the largest accounts, on the highest-revenue keyword clusters, once or twice a year, and use the resulting lift factors to discount sourced revenue elsewhere in the portfolio. That discounted figure is what belongs in the CFO-facing summary.
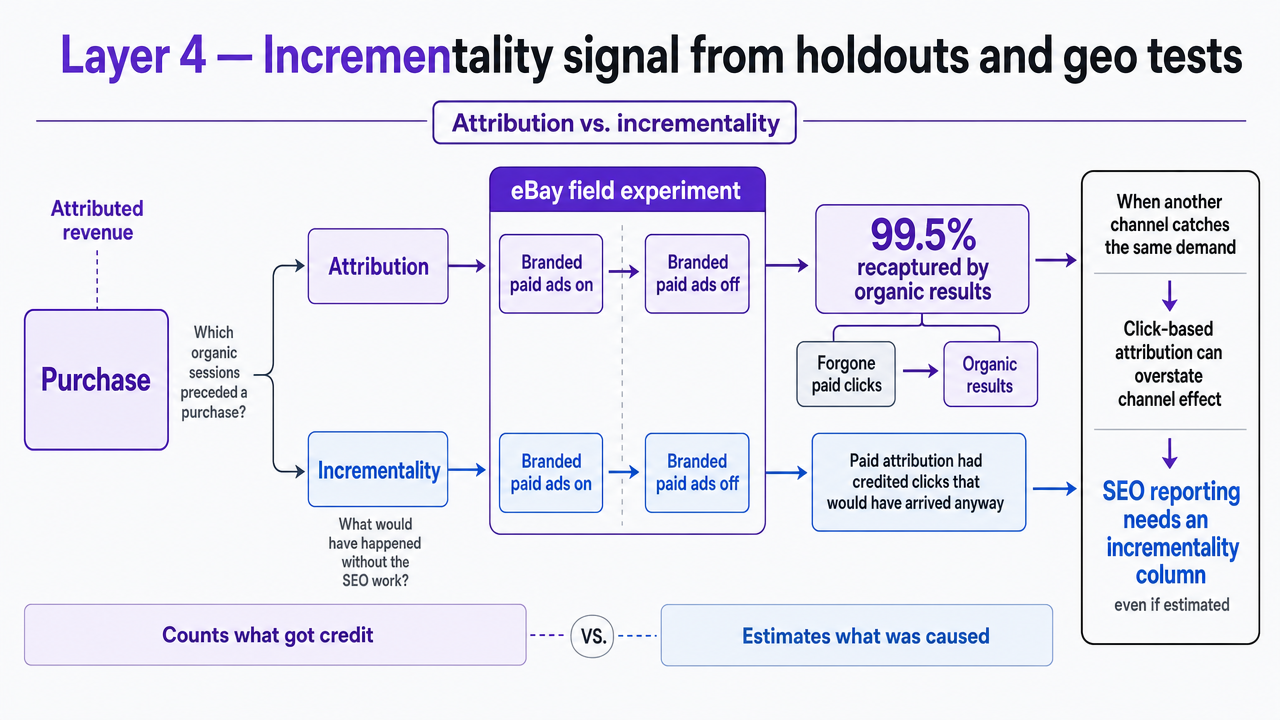 Show the eBay experiment's substitution effect that is cited in prose to justify the incrementality layer
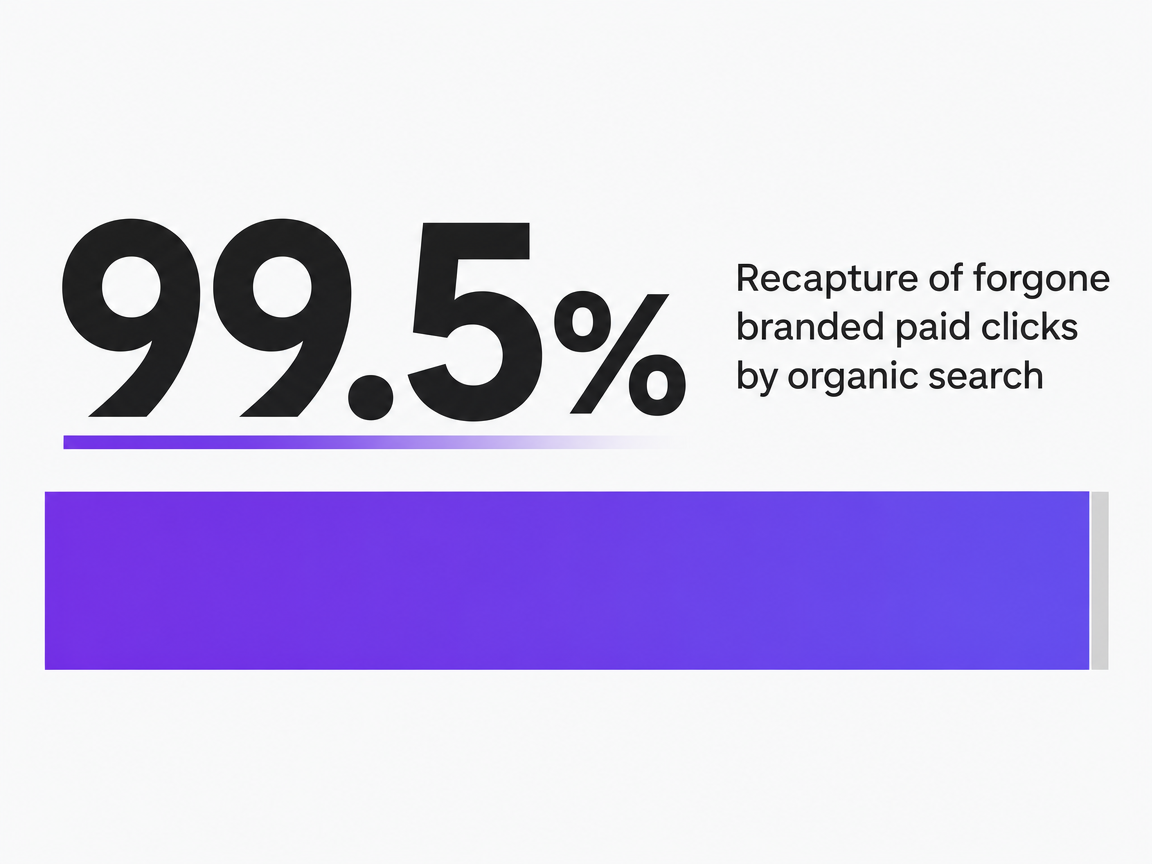 Recapture of forgone branded paid clicks by organic search
Recapture of forgone branded paid clicks by organic search
Reading rank, CTR, and SERP composition together
Rank alone is a thin story. Click-through rate alone is thinner. The honest read of a keyword's performance comes from stacking three signals in the same view: where the page ranks, what share of impressions it converts to clicks, and what else is on the search result page competing for attention.
The rank-to-click relationship is strong but observational. An analysis of organic clicks to retail sites found roughly a 1.3% click lift for each 1% rank improvement among results within the top pages, and a 90% click loss when a retailer was pushed beyond the first five pages 10. Those numbers set a working expectation for how much movement to budget for a given rank gain. They do not prove that any specific ranking improvement will produce a proportional revenue gain — brand strength, query intent, and the composition of the result page all intervene.
SERP composition is the intervening variable most agencies underweight. A study of 67,000 keywords, more than 6 million clicks, and 24 million views across 40 U.S. ecommerce domains confirmed position as the strongest predictor of CTR but found that shopping units, answer panels, featured snippets, and local packs produce significant positive or negative CTR effects on top of rank 7. A move from position 4 to position 2 on a query with a shopping carousel above the fold is not the same event as the same move on a plain ten-blue-links result. Reporting that treats them as equivalent will miss the reason clicks did not follow rank.
Google's own prioritization pattern uses all three dimensions together: average position on one axis, CTR on the other, bubble size for total clicks, and color for device 8. That view separates the queries worth working on into recognizable groups:
- high-impression and low-CTR queries where the title, snippet, or SERP feature strategy is the bottleneck;
- high-CTR and low-position queries where a rank push would compound existing demand;
- high-click workhorses that need defending rather than optimizing.
The operational rule is simple. Every keyword review attaches a SERP snapshot — which features are present, which competitors occupy them, and whether the client's own result is one of them — alongside the rank and CTR columns. When CTR falls while rank holds, the SERP snapshot is where the explanation lives, not the ranking log.
Measure Keyword Impact on Revenue in Real Time
Get immediate visibility into how tracked keywords influence pipeline value and ROI across live campaigns.
The aggregation trap — why one average position lies
A single average position across a client property is almost always the wrong number to report. Google's own guidance on grouping dimensions is explicit: impressions, clicks, CTR, and position are calculated differently depending on whether results are grouped by property, page, query, device, or country 3. This means the same keyword can show one position in the property view and a different position when the same query is isolated against the page that actually ranks for it.
The distortion runs in both directions. A property-level average pulls in every page that ever surfaced for a query, including thin or unintended matches that drag the number down. A page-level filter strips those out and often produces a stronger apparent position for the same term. Neither number is wrong on its own — they answer different questions — but a client scorecard that mixes them produces a story the data cannot defend under scrutiny.
The operating rule is to pick the grouping that matches the decision being reported. Query-by-page for optimization work. Query-by-device when mobile and desktop SERPs diverge. Property-level only for portfolio-wide trend lines, never for keyword-specific claims. Every chart in the deck should carry its grouping dimension in the title, not buried in a footnote.
The three-column client scorecard
A keyword-to-revenue report that collapses everything into one blended number is the report most agencies lose renewals with. The CFO asks what the figure represents, the account team hedges, and the credibility of the entire deck slips. The alternative is a scorecard that resolves the three different questions a client is actually asking into three separate columns: what organic directly produced, what it helped produce, and what it caused.
Sourced revenue : The first column. It is the revenue tied to sessions where organic search was the last non-direct touch before the purchase or qualified lead, rolled up from landing-page outcomes and allocated back to the query clusters that drove those pages. The underlying events are GA4 purchase events with items and currency, or CRM-logged qualified leads joined to organic sessions 4. The column header should name the attribution model and the lookback window, not hide them.
Assisted revenue : The second column. It captures the organic sessions that appeared earlier in a converting path but were not the final touch — the research visit before the branded return, the comparison query before the direct type-in. Google's own guidance treats pre-click Search Console activity and post-click Analytics behavior as different measurement surfaces that will not reconcile exactly, which is why assisted contribution has to be modeled from GA4 path data rather than read off a single query report 1. This column is where organic's role in demand creation shows up when sourced revenue alone understates it.
Estimated incremental revenue : The third column, and it is the one most agency scorecards omit. It applies a lift factor — derived from the holdout, geo, or pause tests described in the incrementality layer — to discount sourced and assisted revenue down to what would not have arrived through another channel or through direct demand. NBER's measurement work is explicit that attributed clicks and conversions are intermediate proxies, and that experimental designs are the mechanism for separating correlation from causal lift 6. The column carries a confidence note stating which clusters were tested, when, and what lift factor is being applied to the untested remainder.
Three columns, three definitions, three sources of truth. The client sees what organic brought in, what it contributed to, and what it caused — and no single number is asked to carry weight it cannot support.
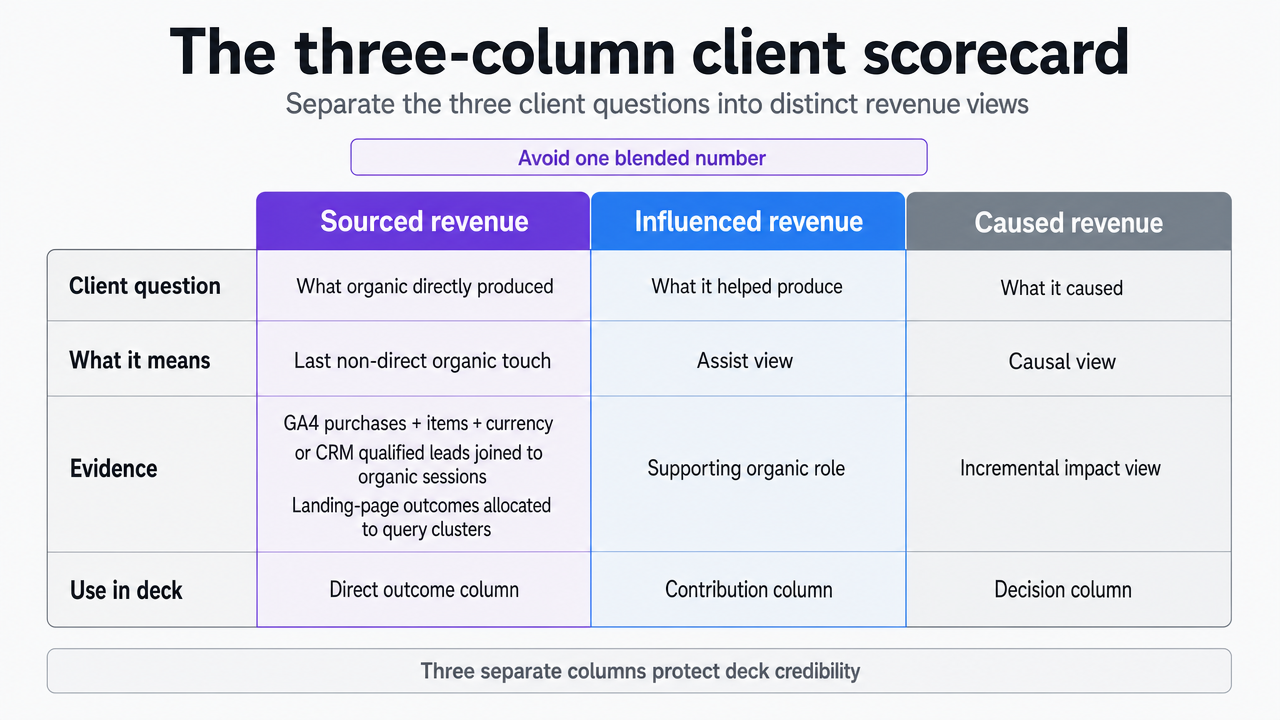 Translate the three revenue columns described in prose into a scannable comparison table that readers can replicate in a client deck
Diagnosing a revenue dip without blaming SEO
When organic revenue drops, the first instinct of a nervous account team is to open the ranking log. That is the wrong starting point. Google's own debugging guide decomposes a traffic change into clicks, impressions, CTR, average position, affected pages, affected queries, search type, and date range — and recommends comparing periods across the last 16 months, filtering by search type, and ordering pages by click difference before concluding what moved 9.
The decomposition produces four distinct diagnoses, each pointing to a different owner:
- Impressions flat and clicks down means CTR is the problem — a title or snippet change, a new SERP feature above the organic result, or a competitor earning the shopping or answer slot 9.
- Impressions down and clicks down with position stable means demand itself has softened; the keywords still rank, but fewer people are searching for them.
- Impressions down with position down means a ranking loss, which is where traditional SEO diagnostics apply.
- A click decline with no change in any Search Console metric points downstream — to tagging, consent, or conversion-page breakage inside GA4 rather than to search performance at all 1.
SERP composition belongs in this review. The 67,000-keyword ecommerce study already cited found that shopping units, answer panels, and local packs produce measurable positive or negative CTR effects on top of rank, which means a CTR dip on a stable ranking is often a SERP-feature event rather than an SEO failure 7. The diagnostic deck should carry a before-and-after SERP snapshot for the affected queries, not just a position chart.
The output of the workflow is a one-line attribution for the dip — CTR, demand, ranking, or measurement — before any remediation is proposed. That line is what the client conversation turns on, and it is what keeps the renewal argument on the data instead of on the defensiveness.
See How Enterprise SEOs Tie Keyword Performance Directly to Revenue Impact
Request a demo focused on tracking keyword movements from SERP to pipeline, with reporting that connects rankings to lead quality and revenue—built for agencies managing multiple client portfolios.
Measurement hygiene that survives a CFO review
Every layer of the stack depends on the same unglamorous work: the events have to fire correctly, the joins have to hold, and the gaps have to be labeled rather than hidden. Google's integration guidance lists the usual suspects for discrepancy in one place — implementation errors, consent-driven data loss, time-zone mismatches, attribution-model differences, canonical URL conflicts, traffic-type definitions, non-HTML pages, and bot filtering — and treats them as expected, not exceptional 1. A measurement system that pretends these do not exist produces numbers a CFO can pick apart in a single meeting.
Four hygiene checks hold up under review:
- Purchase events fire once per transaction with items and currency set, so revenue is not inflated by duplicates or stripped of value by missing fields 4.
- Landing-page URLs match between Search Console and GA4 at the canonical level, so the join column does not fracture across trailing slashes and tracking parameters.
- Consent state is logged alongside the session count, so a drop in measured conversions can be separated from a drop in actual ones.
- The attribution model, lookback window, and grouping dimension are printed on every chart, not assumed.
The deliverable is a one-page data-quality appendix at the back of every client report naming what is measured, what is modeled, and what is missing. That page is what turns a CFO review from a cross-examination into a conversation.
If you manage a book of clients — scaling the stack across the agency
For agency leads running 40, 80, or 150+ accounts, the four-layer stack has to survive a second test: it has to run at portfolio scale without a proportional increase in analyst headcount. A measurement system that works beautifully on one flagship client and collapses into manual spreadsheet work on the rest is not a system — it is a demo.
The scaling move is to templatize the pulls, not the analysis. Scheduled Search Console API jobs retrieve query, page, device, and country dimensions on a fixed cadence into a shared warehouse, with the API's row-limit behavior accepted as a monitoring constraint and bulk exports reserved for deep retrospectives 2. GA4 landing-page sessions, key events, and purchase events feed the same warehouse through BigQuery export, keyed on canonical landing-page URL so the join column holds across clients 1, 4. One schema, one join key, N client datasets.
Analyst time then moves off data assembly and onto the three things that actually require judgment:
- interpreting the bubble-chart quadrants for each client's opportunity triage 8,
- running the traffic-drop decomposition when a dip appears 9, and
- sizing the incrementality discount applied to sourced revenue in the scorecard.
Everything upstream of those three tasks is a scheduled job.
The portfolio economics are easier to reason about in variables than in invented dollars.
H : analyst hours per client per month under manual rank-report delivery
N : the number of active clients
C : fully loaded analyst cost per hour
Manual delivery scales as H × N × C and caps the book of clients a single analyst can own before quality slips.
| Model | Hours per client / month | Clients per analyst FTE | Monthly cost basis |
|---|---|---|---|
| Manual rank reporting | H | ≈ 160 / H | H × N × C |
| Templated GSC API + GA4 warehouse + approval-gated review | H′ (where H′ < H) | ≈ 160 / H′ | H′ × N × C + fixed pipeline cost |
The lift is not that analysts work faster. The lift is that the hours they keep are spent on interpretation and client defense rather than on copying numbers between tabs. An approval-gated workflow — where the pipeline drafts the scorecard commentary, the SERP snapshots, and the dip decomposition, and a human analyst signs off before the deck ships — is how a Head of SEO holds the quality bar while N grows. Platforms like Vectoron are built around that approval-first pattern; the measurement system is the asset, and the automation is what makes it portable across the book.
Frequently Asked Questions
References
- 1.Using Search Console and Google Analytics data for SEO.
- 2.Search Analytics: query | Search Console API - Google for Developers.
- 3.Getting your performance data | Search Console API.
- 4.Measure ecommerce - Analytics.
- 5.Consumer Heterogeneity and Paid Search Effectiveness.
- 6.Measuring the Effects of Advertising: The Digital Frontier.
- 7.Exploring the Impact of SERP Features on Organic Click-through Rates.
- 8.Improving SEO with a Search Console bubble chart.
- 9.Debugging drops in Google Search traffic.
- 10.Search Engine Optimization: What Drives Organic.
- 11.Customers acquired through Google search advertising more valuable than previously thought.
- 12.Comparing Performance Metrics in Organic Search with Sponsored Search Advertising.