
Key Takeaways
- Predictable organic revenue depends on collapsing design, SEO, and CRO onto one measurement surface with a single owner, not on adding traffic or coordinating three vendor dashboards 2.
- Model booked revenue through three levers — retention, conversion, and unit cost — and track design-to-booking latency so every shipped URL change becomes a dated cohort with a known payoff window.
- Map each URL to a decision-journey phase (initial consideration, active evaluation, closure, post-purchase) rather than to a keyword alone, since no template optimizes for all four at once 6.
- Start with three assets in order: the measurement surface, the ten service URLs carrying the most non-brand demand, and a weekly approval queue with one human owner.
Revenue predictability is an operations problem, not a traffic problem
The marketing leaders who forecast organic revenue within a reasonable margin of error are not the ones with the most traffic. They are the ones who have wired design, search, and conversion into a single instrumented path from query to booked appointment. Everything upstream of that path — keyword clusters, page templates, form logic, schema — is treated as an input variable. Everything downstream — qualified call, consultation held, contract signed — is treated as the dependent variable. The forecast falls out of the model.
Most in-house teams cannot produce that forecast because their web design, SEO, and CRO functions live in three separate contracts with three separate reporting cadences. Traffic reports come from the SEO vendor. Heatmaps come from the CRO consultant. Page speed and template changes come from the design agency. Each dashboard is internally coherent and collectively useless for predicting next quarter's pipeline.
Forrester's guidance on justifying UX investment makes the same point in the language of finance: experience improvements only become forecastable when their metrics are tied to conversion, revenue, and cost outcomes on the same measurement surface 2. The problem is not that any single function is failing. It is that no one owns the seam between them.
Predictable revenue is what happens when that seam gets an owner and an operating model.
The single instrumented funnel: collapsing design, SEO, and CRO into one measurement surface
Why three vendors produce three dashboards and no forecast
A typical growth-stage marketing team runs three concurrent contracts against the same website. The SEO agency reports on rankings, impressions, and non-brand clicks. The design or web dev shop reports on template completion, page-speed scores, and sprint velocity. The CRO consultant reports on test win rates and lift percentages against isolated control variants.
Each report is defensible in isolation. None of them can answer the question a CEO actually asks: how many booked consultations will organic search deliver in Q3, and what does it cost to add another twenty?
The gap is structural. Rankings live in one tool, session behavior in another, and revenue in the CRM. When the design agency ships a new service-page template, the SEO vendor sees a traffic delta and the CRO consultant sees a conversion-rate delta, but no one owns the line from that template change to a booked appointment thirty-seven days later. Attribution stops at the handoff between contracts.
Forrester's framing of the UX business case makes the reason plain: experience metrics only become financial metrics when they are pulled onto the same measurement surface as conversion and revenue outcomes 2. Three vendors optimizing three surfaces produce three local maxima. The forecast requires one surface with one owner.
Web Conversion Optimization as the shared architecture
Forrester defines Web Conversion Optimization as the discipline of building digital environments that attract, engage, and qualify targeted visitors — moving them from unknown to known through the site itself 10. The definition is useful because it refuses the vendor split. Attraction is an SEO problem. Engagement is a design and content problem. Qualification is a form-logic and CRO problem. WCO treats all three as one architecture.
Practically, that means the information architecture, the keyword map, and the conversion instrumentation are drafted as a single document. Every URL has an intended query cluster, an intended user task, and an intended downstream event — a call, a scheduled consult, an intake form submitted with a qualifying answer. Page speed is not a design KPI; it is a conversion input. Schema is not an SEO tactic; it is a qualification signal for the CRM.
The output is a site where each page can be evaluated on the same axis: how much qualified pipeline did this URL produce against its acquisition and production cost? Once that axis exists, budget allocation becomes a straightforward exercise rather than a negotiation between three vendors defending three dashboards. The forecast follows from the model, not from the meeting.
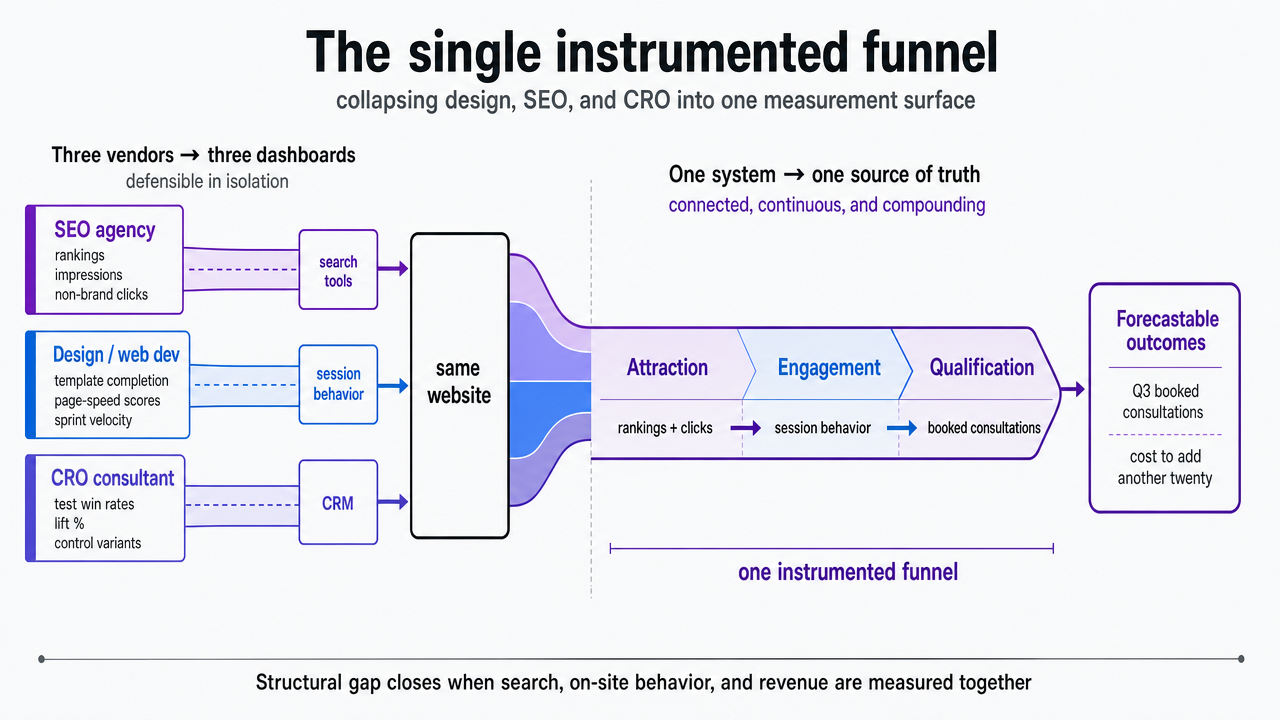 Visualize the comparison between three-vendor fragmentation and the unified Web Conversion Optimization architecture described in this section, showing how attraction, engagement, and qualification collapse onto one measurement surface
Modeling booked revenue from organic search
The revenue levers hidden inside better digital journeys
Organic search does not produce revenue. Booked consultations, signed contracts, and retained clients produce revenue. The gap between the two is where the model lives, and it is narrower than most in-house teams assume once the journey itself is treated as the intervention rather than the traffic feeding it.
McKinsey's B2B digital sales research quantifies the ceiling on that intervention with unusual specificity. Companies that redesigned digital journeys — including the search-led discovery and site experiences that sit inside a web design SEO program — saw customer churn drop by 10 to 15 percent, offer win rates rise by 20 to 40 percent, and cost-to-serve fall by up to 50 percent 9. The study measured B2B contexts, not consumer service verticals, so the numbers function as a benchmark ceiling rather than a promise. A dental group or a personal injury firm operates under different unit economics, and the win-rate lift on a $4,000 case is not mechanically the same as on an enterprise contract.
What travels across contexts is the shape of the model. Three levers — retention, conversion, and unit cost — respond to journey design in measurable ways, and each one compounds into the annual forecast differently. Retention protects the base. Conversion multiplies the acquisition spend. Unit cost changes the marginal economics of every new page shipped. A marketing operator who names these three levers, assigns a working assumption to each, and updates the assumptions quarterly has the beginning of a defensible forecast. One who reports only on rankings and sessions does not.
Design-to-booking latency: a named metric for the marketing operator
Most funnel dashboards track conversion rate. Almost none track the elapsed time between the design decision and the booking it produces. That interval — call it design-to-booking latency — is the metric that turns web design SEO from a project into an operating system.
The definition is narrow on purpose. Design-to-booking latency is the median number of days between a shipped change to a URL (new template, revised H1, added intake field, restructured schema) and the point at which that change has accumulated enough booked outcomes to be evaluated against the pre-change baseline. For a personal injury firm with a 60-day consultation cycle, latency runs long. For a home services operator taking same-week appointments, it runs short. Either way, the number is knowable.
Tracking it changes two behaviors. First, it disciplines the roadmap. Teams stop shipping changes they cannot measure inside a reasonable horizon, because the latency clock exposes which experiments will still be unresolved at the next board meeting. Second, it forces the CRM and the CMS onto the same timeline. Without that alignment, design changes look free — they cost nothing until the annual redesign — and their revenue contribution stays invisible. With it, every URL becomes a dated cohort with an expected payoff window, and the forecast stops depending on rankings that may or may not translate into bookings within the quarter.
Treating design and SEO as a marketing ROI portfolio
McKinsey's marketing ROI guidance argues that better MROI begins with objectives grounded in the consumer decision journey, which then shape better metrics 8. Applied to web design SEO, the implication is direct: design and search spend should be evaluated as a portfolio of investments with different payback curves, not as separate line items competing for the same annual budget.
A portfolio view sorts investments by expected lift, latency, and confidence interval. Technical SEO fixes are typically high-confidence and short-latency. New service-page templates are moderate-confidence and moderate-latency. Full information-architecture rewrites are lower-confidence and long-latency, but they compound across every URL downstream. A VP running the portfolio decides how much capital sits in each bucket the same way a CFO decides between short-duration and long-duration debt.
The alternative — funding whichever vendor has the most compelling quarterly deck — produces the exact volatility that makes organic revenue feel unforecastable. Portfolio discipline does not remove risk. It prices it.
See How SEO-Optimized Design Drives Pipeline
Test real web design SEO workflows and measure impact on qualified lead generation before committing.
Mapping design decisions to the four phases of the decision journey
McKinsey's reframing of the purchase funnel as a circular decision journey identifies four phases where marketers win or lose the customer: initial consideration, active evaluation, closure, and the post-purchase experience 6. The framing matters for web design SEO because each phase is influenced by a different set of design and search decisions, and no single template optimizes for all four at once.
Initial consideration is where non-brand organic visibility does its work. The decisions that move the needle are topical authority, entity coverage across a service category, and category-level landing pages that answer the broad question a first-time searcher types. Design contribution at this stage is largely restraint: fast load, scannable structure, no premature conversion pressure.
Active evaluation is where a visitor compares options. Comparison content, transparent pricing signals, credential proofing, and interior-page navigation carry the weight. The design decisions are structural — cross-linking between service pages, consistent proof modules, review schema that surfaces in the SERP and again on the page.
Closure is the qualification moment. Form length, field logic, click-to-call placement, and the specificity of the intake question determine whether a qualified visitor becomes a booked outcome or an abandoned session. This is where CRO instincts and SEO intent converge on the same URL.
Post-purchase — the phase most organic programs ignore — is where retention and referral get built. Client portals, follow-up content, and status-tracking interfaces feed the loop that produces branded search the following quarter. A design decision made once at intake pays out across every renewal.
Mapping each URL to the phase it serves, rather than to a keyword alone, is what turns a page count into a journey model.
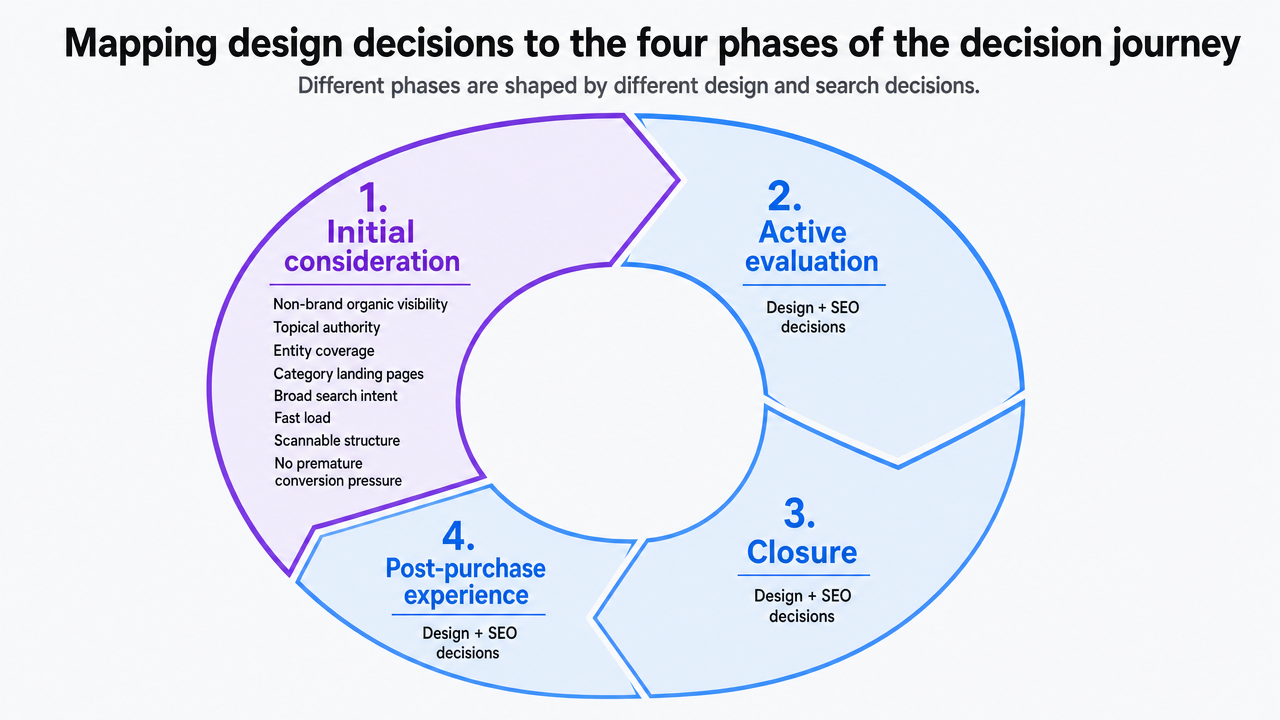 Visualize McKinsey's four-phase circular decision journey mapped to specific web design and SEO decisions at each stage, as explicitly enumerated in this section
High-stakes verticals: what regulated-industry redesigns actually change
Evidence from a telemedicine interface redesign
A 2022 peer-reviewed usability assessment of a telemedicine interface measured user satisfaction and task performance before and after a systematic redesign, and found that the post-redesign version scored materially higher on subjective usability across every dimension the researchers tracked 3. The scope matters. It examined a single telemedicine interface using subjective metrics — questionnaire-based ratings from participants — not booked-appointment data across a portfolio of clinics. It is not a claim about search rankings or patient acquisition cost. It is a claim about how much easier a redesigned interface was to use for the specific tasks the study measured.
That narrower finding is exactly what makes it useful for a VP modeling revenue in a regulated vertical. Regulated interfaces — patient intake, insurance verification, HIPAA-compliant messaging, legal intake screening — carry an unusually high abandonment penalty. A prospective patient who cannot complete a booking on the first attempt often does not return. A redesign that lifts subjective usability scores is a redesign that reduces that abandonment rate at the moment of highest intent.
The 2025 healthcare UX review reaches a compatible conclusion: poorly designed healthcare interfaces produce patient frustration and underutilization, while user-centered design supports engagement and service delivery 4. Task completion is the mechanism. Booked outcomes are the downstream effect.
Patient acquisition, compliance, and the limits of conversion pressure
Peer-reviewed work on healthcare digital marketing links improved website usability and search visibility to increases in patient inquiries and appointment volume, positioning SEO-driven design as a direct input to acquisition in the vertical 5. The same body of research flags the ethical guardrail: conversion pressure that reads as manipulative in a clinical or legal context damages trust faster than it lifts submits.
What that means operationally is narrower than most CRO playbooks suggest. The tactics that work in ecommerce — countdown timers, artificial scarcity, aggressive exit intent — degrade credibility on a service page for a spine surgeon or a criminal defense firm. The conversion instruments that do work are structural: shorter intake forms with conditional logic, credential proofing near the CTA, transparent scope-of-service language, and click-to-call placement calibrated to how the vertical actually books.
Accessibility sits inside the same envelope. WCAG 2.2 added nine Success Criteria addressing visual, mobility, hearing, and cognitive barriers, including easier navigation and reduced form errors 11. A regulated-vertical operator treats WCAG 2.2 conformance as a conversion input, not a legal checkbox — the same interaction fixes that satisfy the standard also reduce the abandonment rate the redesign is trying to move. The design decisions that lift booked patients and the design decisions that keep the site defensible are, in practice, the same list.
Governance: the approval loop that replaces vendor coordination
Signal, recommendation, approval, execution, attribution
Three vendors do not fail because their people are weak. They fail because their coordination surface is the calendar. Status meetings, briefing documents, and Slack threads sit between the signal a site generates and the change that responds to it. Every hop adds latency, and latency is what makes revenue feel unforecastable.
An approval-first operating model compresses the hops into a single loop with five named stages.
- Signal: the site produces a measurable event — a service page whose non-brand impressions are climbing but whose form completion rate is decaying, a template whose Core Web Vitals slipped after a CMS update, an intake question that correlates with drop-off.
- Recommendation: the change is drafted against that signal with the expected lift, the affected URLs, and the design-to-booking latency window named up front.
- Approval: a human owner accepts, edits, or rejects the recommendation with the reasoning attached.
- Execution: the approved change ships against the CMS, the schema, and the tracking layer at once, not across three vendor tickets.
- Attribution: the change is tagged as a dated cohort, and its downstream booked outcomes are measured against the pre-change baseline through the latency window.
The loop does two things a vendor stack cannot. It gives every design and content decision a traceable line to a KPI, and it removes the meetings that exist only to translate between contracts. What remains is judgment, applied to ranked recommendations, one approval at a time.
Measuring brand and CX on the same surface
Forrester's Total Experience Score treats brand and customer experience as one measurement problem rather than two 12. The framing matters for governance because it settles an argument in-house teams have been losing quietly for a decade: whether the brand team and the performance team should be optimizing against separate dashboards.
On a design-led SEO program, that separation is expensive. A service page carries brand signals — voice, credential proofing, category framing — and conversion signals — form logic, CTA placement, schema — in the same URL. Governing them apart produces pages that rank and repel, or pages that convert and erode positioning. Governing them together, on a shared surface where booked outcomes and brand-lift indicators sit side by side, is what lets a VP defend a redesign that lifts organic bookings without cannibalizing the pricing power that brand equity protects.
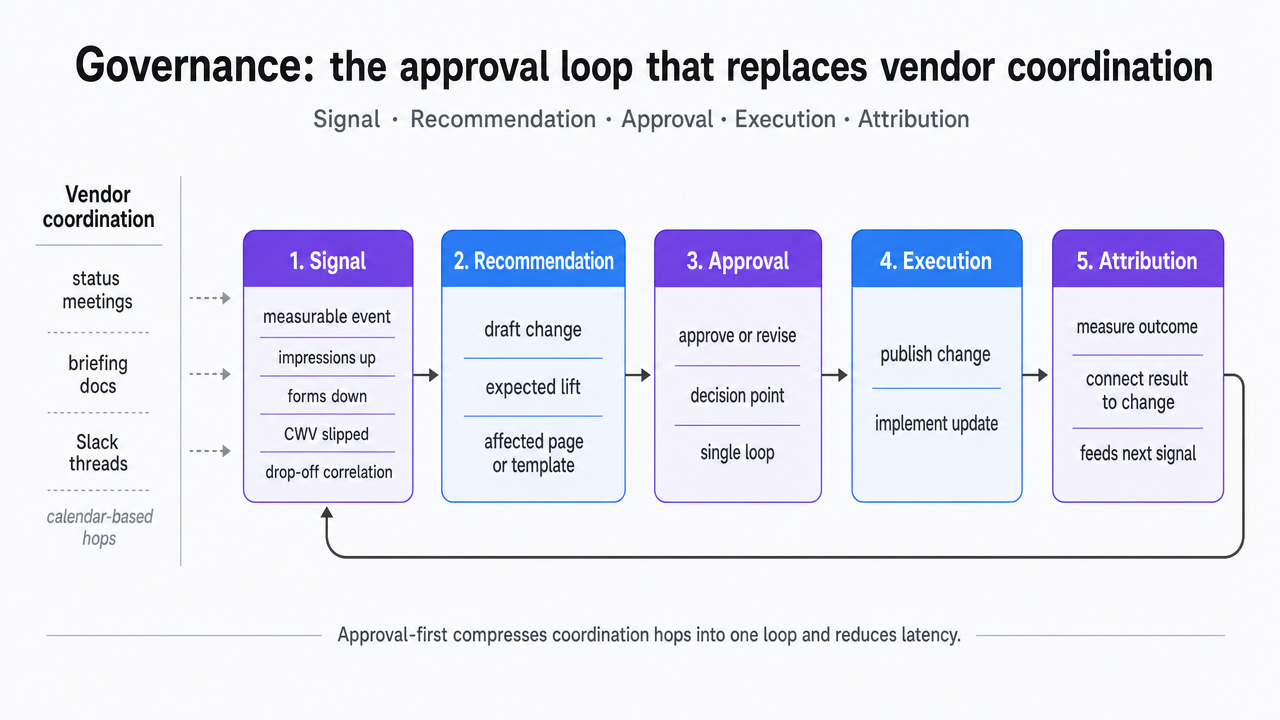 Visualize the five-stage approval-first operating loop explicitly named in this section: Signal, Recommendation, Approval, Execution, Attribution
See How AI-Driven Web Design SEO Delivers Measurable Pipeline Gains
Request a tailored walkthrough of automated, approval-first workflows for integrating SEO with web design—built to help enterprise teams generate predictable, attributable revenue without expanding headcount or juggling multiple vendors.
If you operate multiple locations: the consolidation math
A variable-driven worksheet for stack consolidation
The reader shifts here. The rest of this piece speaks to any in-house VP running a design-led SEO program. This section speaks specifically to operators running the same program across five, twenty, or two hundred locations — dental groups, DSO-backed practices, home-services franchises, senior living portfolios, multi-market legal groups. The economics change in a specific way that a single-location worksheet cannot capture.
The trap in multi-location marketing is that vendor cost scales with locations while coordination cost scales with vendors squared. A four-vendor stack across twenty locations does not cost four times a single-location stack. It costs whatever the retainers total, plus the weekly hours the in-house team spends translating between contracts, multiplied by the average approval latency each hop adds. Those two variables — coordination hours and approval latency — are the ones a portfolio operator can actually attack.
The worksheet below is variable-driven on purpose. It uses inputs the reader supplies rather than fabricated retainer benchmarks, and it reports outcomes in hours reclaimed and days compressed rather than invented dollar totals.
| Input variable | Traditional multi-vendor stack | Unified approval-first model |
|---|---|---|
| Vendor count (design, SEO, CRO, PPC) | V (reader supplies) | 1 |
| Retainer dollars per month | R (reader supplies, sum of contracts) | Trial entry point: $599/mo |
| Briefing and coordination hours per week | H × V (per-vendor briefing load) | H (single approval queue) |
| Approval latency per change (days) | L × number of vendor handoffs | L (single hop) |
| Locations governed on one measurement surface | Depends on vendor tooling | All locations, one dashboard |
Two outputs matter. Reclaimed hours equal (H × V) − H per week, compounding across every location in the portfolio. Cycle-time compression equals L × handoffs − L per shipped change, which sets the ceiling on how many design-to-booking latency windows a portfolio can close in a fiscal year. Operators who run the numbers with honest inputs usually find that coordination cost, not retainer cost, is the line item consolidation actually moves.
What to build first inside a lean marketing team
Sequence matters more than scope. A VP running a five-person team cannot rebuild the site, rewire attribution, and re-platform the CMS in the same quarter, and does not need to. Three assets, built in order, produce a working version of the system inside one fiscal quarter.
- First, the measurement surface. Before any page ships, the CRM, the CMS, and the analytics layer have to agree on what a booked outcome is and which URL touched the session that produced it. Without that agreement, every subsequent change generates opinions instead of evidence. Forrester's guidance on justifying UX ties this step directly to the business case: experience investments only earn budget when their metrics live on the same surface as revenue 2.
- Second, the ten URLs that carry the most non-brand demand. Not the homepage. Not the about page. The specific service pages where qualified searchers arrive with intent to book. Each gets a phase assignment against the decision journey, a redesign against the qualification instruments that actually work in the vertical, and a dated cohort tag.
- Third, the approval queue. One human owner, ranked recommendations, a weekly cadence. That is the operating system. Everything else compounds from it.
Frequently Asked Questions
References
- 1.What's The ROI Of CX Transformation?.
- 2.The Six Steps For Justifying Better UX.
- 3.Pre- and Post-Redesign Usability Assessment of a Telemedicine Interface Based on Subjective Metrics.
- 4.Usability and UX in Healthcare: Exploring Current Trends and Challenges.
- 5.Digital Marketing Strategies to Increase Patient Volume in Healthcare.
- 6.The consumer decision journey.
- 7.The new consumer decision journey.
- 8.Marketing Return on Investment.
- 9.Digital Sales & Analytics: Driving above-market growth in B2B.
- 10.The Web Conversion Optimization Framework.
- 11.W3C WCAG 2.2 Now Available.
- 12.Forrester's Total Experience Score – Measure Brand & CX, Together.