
Key Takeaways
- Treat search rank as a leading indicator inside a five-stage chain (qualified impressions, click quality, landing experience, conversion, customer value), not as a revenue metric itself 1.
- Segment impressions by commercial intent and pair position with CTR split by AI-feature versus non-AI queries, since SERP shape now shifts click volume independent of rank 8.
- Fix landing-stage leaks by holding qualified-query pages to LCP under 2.5s, INP under 200ms, and CLS under 0.1, then prioritize underperformers in the engineering backlog 9.
- For multi-location portfolios, replace per-market rank spreadsheets with one row-per-location model where stage multipliers compound into booked events and revenue the CRO can act on 2.
Rank Is an Input Variable, Not a Revenue Metric
Position 3 does not pay salaries. Booked consultations, admissions inquiries, and signed engagement letters do. Yet most organic reporting handed to a CRO still leads with average position and a weekly rank-tracker screenshot, as if a two-slot climb on a commercial query were a line item on the P&L.
It is not. Rank is an input variable that feeds a chain of downstream conversions, each with its own loss rate. Google's own measurement guidance makes this split explicit: Search Console reports what happens in the search results themselves (impressions, clicks, queries, CTR, position), while Analytics reports what happens after arrival, and the two totals are calculated differently and will not match 1. Rank lives on one side of that line. Revenue lives on the other.
Google reinforces the same point in its AI Search guidance, telling publishers to measure sales, signups, and engaged audiences rather than optimize for clicks in isolation 7. For a VP defending organic spend to a CRO, the implication is operational: stop reporting positions as outcomes and start reporting them as leading indicators inside a modeled revenue chain. The rest of this piece builds that chain stage by stage, and shows which tool owns which stage, which lever moves pipeline, and which numbers belong in the Monday deck.
The Five-Stage Measurement Chain From Position to Pipeline
Mapping Each Stage to the Tool That Owns It
- Qualified impressions
- Click quality
- Landing experience
- Conversion
- Customer value
No single tool owns all five, which is why most organic reports collapse into either a rank screenshot or a session count and leave the CRO guessing about the middle.
Stages one and two belong to Search Console. It records impressions, clicks, queries, CTR, and position at or before the moment a user arrives from Google Search 1. That is the only system with native visibility into what the SERP actually showed and who chose to click. Stages three and four, landing experience and conversion, belong to Google Analytics, which measures sessions and on-site interactions after arrival 1. Stage five, customer value, belongs to the CRM, the practice management system, the call-tracking platform, or the ecommerce database, depending on the vertical. A booked consultation at a law firm, an admissions inquiry at a behavioral health network, and a scheduled estimate at a home services operator all live in those downstream systems, not in Analytics.
Two operational points follow from this split. First, Search Console clicks and Analytics sessions are calculated differently and the totals will not match 1. VPs who try to reconcile them line-by-line waste cycles. Second, no stage can be optimized without instrumentation at the next stage down. A rank gain with no landing-stage telemetry is a hypothesis, not a result.
Defining Qualified Impressions Instead of Raw Visibility
Total impressions is a vanity number. A dental group ranking for "what is a root canal" and the same group ranking for "emergency root canal near me" produce the same impression unit and radically different revenue potential. The first stage of the chain has to be narrowed before it becomes useful.
Qualified impressions are the subset of impressions on queries that match commercial intent for the business. Search Console's Performance report supports this filtering natively: traffic can be segmented by query, page, country, and other dimensions, so a VP can isolate the queries that actually feed pipeline rather than the broader keyword universe a page happens to surface for 2. The segmentation work is not glamorous. It typically means tagging queries into intent buckets (branded, high-intent commercial, mid-funnel research, informational) and reporting impressions and clicks only within the buckets that correspond to revenue events downstream.
The payoff is a cleaner leading indicator. When qualified impressions rise, pipeline pressure follows if the rest of the chain holds. When they fall, the team has a specific place to look before Analytics sessions move at all. Treating raw impressions as the top-of-funnel number masks both signals. For multi-location operators and single-site teams alike, the discipline is the same: define the query set that matters, exclude the rest from the headline chart, and let unqualified visibility live in a diagnostic tab where it belongs.
Click Quality: Why Position Still Dominates but No Longer Decides
Position is still the strongest single predictor of organic CTR. Research on SERP-feature effects confirms it: across the dataset studied, position remained the dominant factor in whether a result earned a click, even as feature-rich result pages changed click behavior around it 8. A move from position 7 to position 3 on a commercial query still matters. That part of the old model survives.
What the same research also shows is that SERP features can push average organic CTR downward, with specific features and placements producing different outcomes depending on whether the site itself appears in the feature 8. A page can hold position 2, see impressions grow, and watch click volume stall because the SERP above it changed shape. Rank reports that ignore this effect produce false positives: the position line goes up, the click line does not, and the team has no explanation.
Click quality is the second stage of the chain and the first place where a VP should stop reporting a single number. The useful view pairs position and CTR for the qualified-query set, segmented by whether the query triggered AI Overviews, local packs, or other features. Google itself tells publishers to focus on meaningful outcomes such as time spent and conversions rather than click counts alone, precisely because feature-driven CTR shifts are now routine 6. Position earns the impression. The SERP shape and the snippet decide whether the click is worth having.
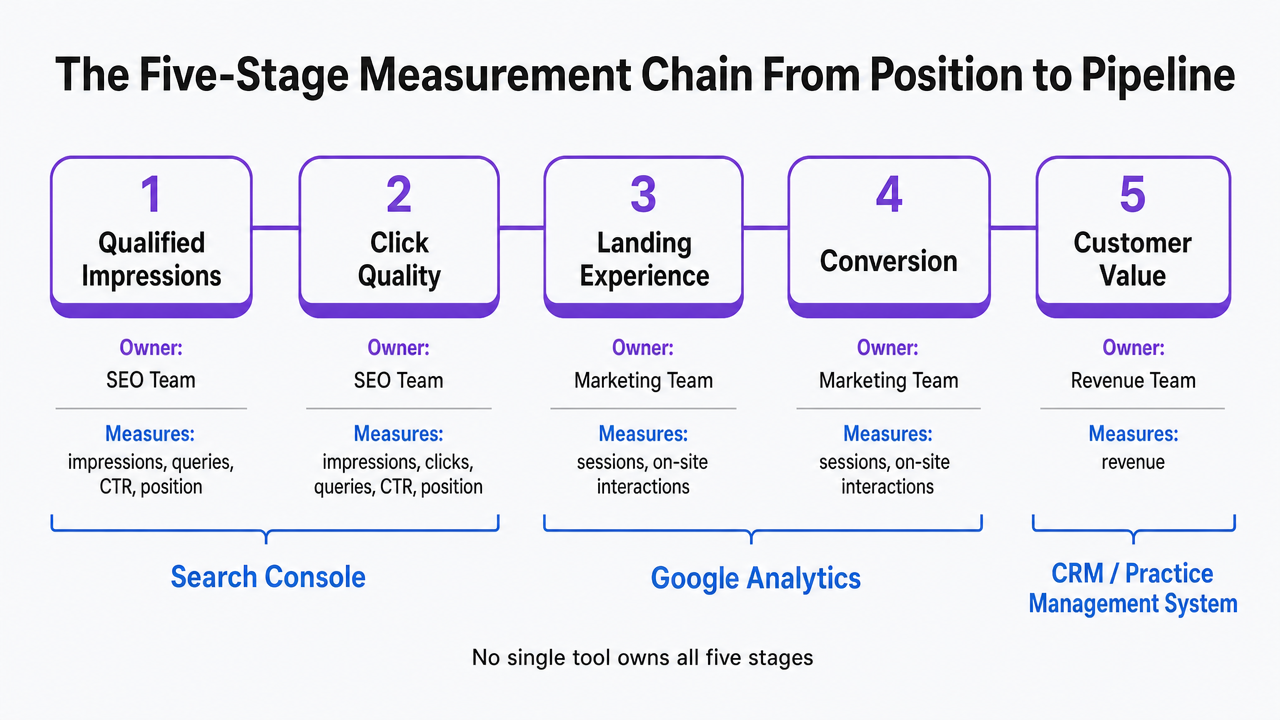 Visualize the five-stage chain from search position to revenue, mapping each stage to the tool that owns it, which is the operational backbone of the entire article
Landing Experience as the Hidden Conversion Lever
Stage three is where most organic programs quietly leak revenue. The click arrives. The page loads slowly, shifts under the user's thumb, or stalls on a form field, and the session ends before it ever reaches a booking widget or an intake form. Rank held. CTR held. Pipeline did not move. The failure sits in the landing experience, which almost never appears in a rank report and rarely appears in an SEO deck at all.
Google's Core Web Vitals define the measurable floor for that experience. The recommended thresholds are LCP within 2.5 seconds, INP below 200 milliseconds, and CLS below 0.1 9. LCP governs how fast the main content paints, INP governs how quickly the page responds to a tap or click, and CLS governs whether elements jump around while the user is trying to act. A legal intake form that fails INP during the moment a prospect taps the phone-number field is not a design problem. It is a conversion problem that happens to be measured in milliseconds.
Two cautions keep this honest. Google does not claim that meeting the thresholds guarantees higher rankings or more revenue; relevance and page quality still carry the weight 9. And the thresholds are a floor, not a ceiling. A page that clears all three can still convert poorly if the offer is weak, the form is long, or the trust signals a prospect expects (clinician bios for behavioral health, bar admissions for a law firm, licensing for home services) are missing above the fold.
What a VP should extract from this stage is a short, enforceable checklist tied to the queries that actually feed pipeline. Pull the qualified-query landing pages from Search Console's Performance report 2. Run each through the Core Web Vitals thresholds. Measure the on-page conversion rate in Analytics for the same set 1. When a page misses a threshold and underperforms the cohort conversion rate, it moves to the top of the engineering backlog ahead of any new content commission. The lever is not more traffic. It is less lost traffic.
Test Real-Time Search Rank Impact Yourself
See how targeted optimizations affect your website’s search visibility and revenue metrics in just one week.
AI Overviews as a Measurement Problem, Not a Traffic Story
What Google Claims and Why VPs Should Treat It as a Vendor Position
Google's public line on AI Search is that total organic click volume has stayed relatively stable year over year and that average click quality has improved 5. That is a vendor claim about a vendor product, published on a Google-owned blog, without the independent browsing dataset that would let an outside analyst replicate the result. It belongs in the evidence file as Google's position, not as settled fact.
The more useful signal sits in Google's own developer documentation, which is operational rather than promotional. AI-feature appearances are folded into overall Search Console Web reporting, and Google tells publishers to focus on meaningful outcomes such as time spent and conversions rather than click counts alone 6. The May 2025 AI Search guidance repeats the point: measure sales, signups, and engaged audiences on the site itself 7.
Read together, those two postures tell a VP what to do and what to ignore. Ignore the aggregate stability narrative when defending a specific program; it does not describe any single site. Treat the measurement guidance as the operating instruction: the only way to know whether AI Overviews are helping or hurting a particular pipeline is to segment the data inside the chain the team already runs.
Isolating AI-Feature Traffic Inside Web Reporting
Because AI Overview impressions and clicks are bundled into Search Console's Web search type 6, a VP cannot pull a clean "AI Overviews" filter from the standard interface. Isolation has to be built, not toggled.
The practical approach uses the segmentation Search Console already supports. The Performance report breaks impressions, clicks, CTR, and position down by query, page, and country 2. Three segmentation moves do most of the work.
- Identify the query set known to trigger AI Overviews for the business (typically informational and comparative queries, with increasing commercial-query coverage) and tag them as a separate cohort.
- Pull the landing pages that serve those queries into their own group.
- Track CTR and position for the cohort over time against a matched non-AI cohort of similar intent and length.
A sustained CTR divergence at stable position is the AI-feature signal.
That segmentation only answers the click-quality question. The conversion question lives downstream. Analytics sessions from the AI-cohort landing pages should be measured against the same on-site events the rest of the chain uses: form submissions, scheduled calls, booked consultations 1. Google's own framing is that clicks arriving via AI features may be higher quality 6. The segmentation is what lets a VP confirm or disprove that claim for a specific site, rather than inheriting it from a blog post. If the AI cohort converts at or above the matched cohort, lower click volume at the top of the chain is tolerable. If it converts below, the position gain is a loss.
Total Search Presence: Reading Organic Alongside Paid
Organic and paid are usually reported by different owners, in different decks, on different cadences. That split makes revenue analysis harder than it needs to be. Users do not experience two channels. They experience one SERP, and the presence or absence of a brand on either side of it changes click behavior on both.
The clearest academic read on this interaction comes from an NYU study that modeled search volume, rankings, CTR, conversion rate, cost per click, and revenue for a single advertiser's data. In that dataset, mean paid CTR reached 6.6% while mean organic CTR sat at 2.77%, and simultaneous paid and organic presence produced higher combined click-through, conversion, and revenue outcomes than either channel alone 10. The study is historical and reflects one advertiser's SERP environment; current pages with AI Overviews, local packs, and shopping modules will not reproduce those exact numbers. The directional finding, that combined presence lifts the total, is what belongs in the model.
Two operational moves follow. First, pull the qualified-query set from the Performance report 2and tag each query by whether the brand holds organic position, a paid placement, both, or neither. Second, track downstream conversions in Analytics against those four states 1. When paid is paused on a query where organic already ranks, the combined click and conversion volume often falls further than the paid share alone would predict. That is the assisted effect, and it only appears when organic and paid share a reporting view instead of two.
If You Manage Multiple Locations: Consolidating Rank Reporting Across the Portfolio
Why Fragmented Location Reports Hide the Revenue Signal
This section shifts scope from single-site teams to VPs running organic across a portfolio: a DSO with 40 practices, a home services franchisor with 120 branches, a behavioral health network with 25 facilities, a senior living operator with 60 communities. The measurement problem changes shape when the chain has to run that many times in parallel.
The default reporting pattern is one rank tracker per location, exported into one tab per market, reviewed by one regional manager at a time. Each location looks either fine or not fine on its own line. The portfolio-level signal, the one the CRO actually wants, never surfaces. A 1.5-position average improvement across 40 practices on commercial queries can hide inside the noise of individual market reports and never make it into a board deck as a pipeline number.
Fragmentation also distorts prioritization. Search Console's Performance report supports segmentation by query, page, and country 2, but if each location is treated as a sealed account, the team cannot compare qualified-impression growth across the portfolio or spot which markets are leaking at the landing stage versus the conversion stage. Revenue signal lives in the comparison. The spreadsheet-per-market format kills it.
A Consolidation Model: Variables That Compound Across Locations
The fix is a single portfolio model that runs the same five-stage chain for every location and reports the compounded result. Each row is a location. Each column is a stage variable. The math is deliberately kept in ratios and counts, not fabricated dollar benchmarks, so the model works for a DSO, a law firm network, or a home services franchisor without pretending to know their economics.
| Variable | Definition | Source |
|---|---|---|
| Locations (L) | Count of markets in the portfolio | Operations |
| Qualified Impressions / Location (QI) | Impressions on the commercial-intent query set, per market | Search Console Performance report 2 |
| Click Quality Rate (CQR) | CTR on the qualified-query set, segmented by AI-feature vs non-AI cohort | Search Console 1 |
| Landing Conversion Rate (LCR) | On-page conversion rate, filtered to pages meeting Core Web Vitals thresholds | Analytics 1, CWV 9 |
| Booked Rate (BR) | Share of conversions that become booked appointments or qualified calls | CRM / scheduling / call tracking |
| Revenue per Booking (RpB) | Average revenue per booked event | Finance |
Portfolio pipeline value equals L × QI × CQR × LCR × BR × RpB. Each stage is a multiplier, which is why small improvements compound. A 0.5-point lift in LCR, from 3.0% to 3.5%, is a 16.7% increase at that stage. Applied across 40 locations holding every other variable constant, the booked-event total moves by the same proportion. That is the number the CRO cares about, and it only exists when the stages are consolidated into one row-per-location view rather than scattered across 40 separate rank reports.
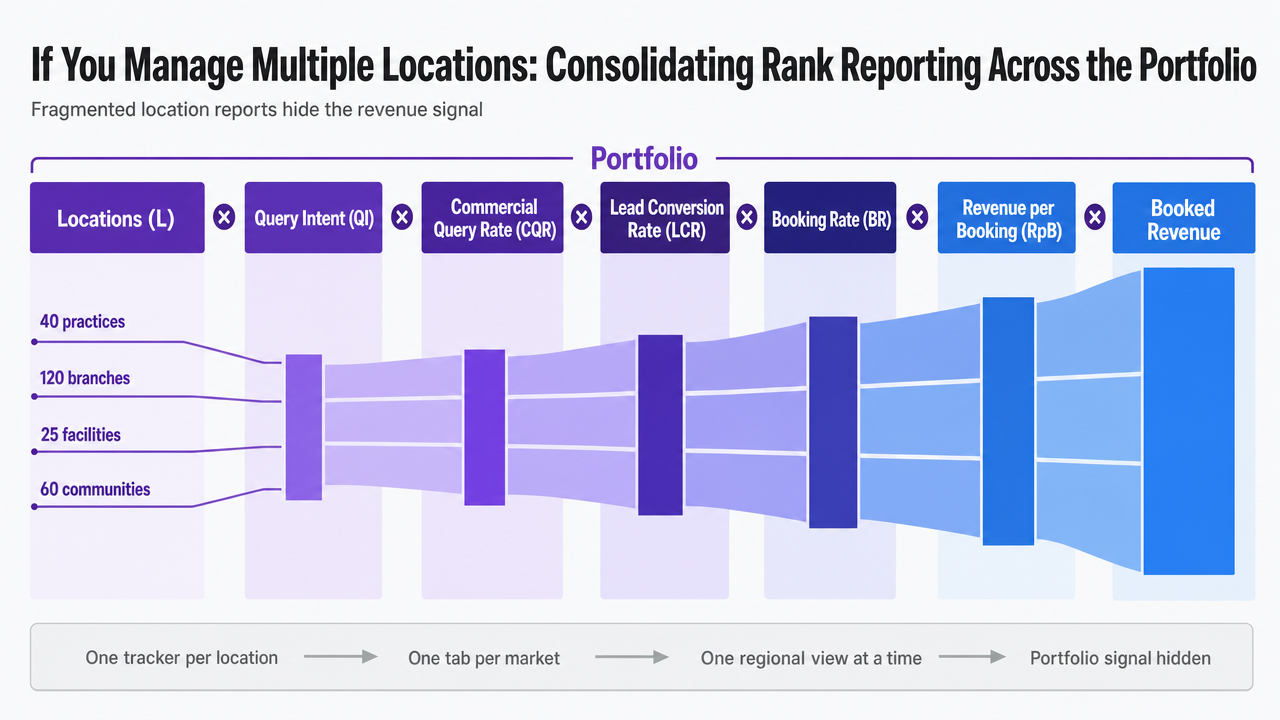 Visualize the portfolio consolidation model (L × QI × CQR × LCR × BR × RpB) described in the section's table, showing how stage multipliers compound into booked revenue across locations
See How Search Rank Directly Impacts Your Revenue Pipeline
Request a tailored analysis connecting your website’s search position to tracked pipeline metrics—benchmark against peers, identify gaps, and quantify the revenue upside from targeted SEO improvements.
Faster Feedback Loops Without Faster Overreactions
Search Console now exposes a 24-hour view with hourly granularity across clicks, impressions, average CTR, and average position, broken down by query, page, and country 3. The 2025 Insights report sits alongside it, flagging pages trending up or down and queries that may signal new demand 4. The reporting cadence has compressed from weeks to hours. The decision cadence should not.
Hourly data is useful for two things: catching indexation breaks and spotting demand shocks on a specific query cluster before they show up in sessions. It is not useful for judging whether a content refresh worked, whether an AI Overview appearance helped or hurt conversion, or whether a position swing on a commercial query will hold. Short-window data carries normal volatility, seasonality, and reporting latency that look like signal and are not 3.
A workable rule separates monitoring from measurement. Monitor at 24-hour resolution for anomalies on the qualified-query set defined earlier. Measure at a cadence long enough for the downstream stages to speak: typically two to four weeks for landing-experience and conversion effects, longer for customer-value shifts that depend on sales cycles. Google's own guidance is to anchor decisions in conversions, sales, and signups rather than click movement 7. Faster dashboards are a diagnostic tool, not a license to redirect strategy every Tuesday.
What the VP Reports to the CRO on Monday
The deck is one page. Not a rank screenshot. A revenue chain.
- Qualified impressions on the commercial-intent query set, pulled from the Performance report and reported against the prior four-week window 2.
- Click quality: CTR and average position for the same cohort, split by AI-feature versus non-AI queries so a shift in SERP shape does not read as a content failure 6.
- Landing experience, expressed as the share of qualified-query landing pages meeting the LCP, INP, and CLS thresholds 9.
- On-page conversion rate from Analytics for that same page set 1.
- Booked events and revenue per booking from the CRM or scheduling system.
Each row carries a direction, a variance, and the next action the team will take before the following Monday. Google's own guidance anchors the format: measure sales, signups, and engaged audiences, not clicks in isolation 7. A CRO who sees pipeline modeled this way stops asking about position 3 and starts asking which stage to fund. That is the conversation worth having.
Frequently Asked Questions
References
- 1.Using Search Console and Google Analytics Data for SEO.
- 2.How To Use Search Console.
- 3.An improved way to view your recent performance data in Search Console.
- 4.The new Search Console Insights report is here.
- 5.AI in Search: Driving more queries and higher quality clicks.
- 6.AI Features and Your Website.
- 7.Top ways to ensure your content performs well in Google's AI.
- 8.Exploring the Impact of SERP Features on Organic Click-Through Rate.
- 9.Understanding Core Web Vitals and Google search results.
- 10.Analyzing the Relationship Between Organic and Sponsored Search Advertising: Positive, Negative or Zero Interdependence?.