
Key Takeaways
- Rankings and sessions have decoupled from pipeline as AI summaries resolve roughly half of Google searches, so SEO reporting must shift from visibility proxies to qualified actions and attributed revenue 10.
- Build the scorecard in the federal sequence—objectives, calls to action, KPIs, then supporting metrics—across visibility, engagement, and revenue tiers, with form-submission conversion rate and qualified-action rate as the anchors 1, 2.
- Treat content structure, technical performance, and FTC-aligned testimonial and review compliance as conversion infrastructure on the same templates, not as separate workstreams measured by crawler or legal checklists 8, 11.
- For multi-location portfolios, consolidate execution and name a single marketing leader empowered to act weekly on engagement and monthly on revenue, so one attributable number per location actually exists 3.
The Attribution Break Between Rankings and Revenue
Organic search still ranks, but the clicks it produces no longer convert as they did eighteen months ago. This gap is crucial for marketing leaders to acknowledge before approving further SEO spend. Traditional metrics like position tracking, impression share, and session counts have decoupled from pipeline generation because search resolution has moved beyond traditional blue links.
McKinsey's October 2025 analysis of AI search behavior reports that approximately 50% of Google searches now return AI-generated summaries. Among consumers using AI-powered search, 44% identified it as their preferred source of insight, compared with 31% for traditional search 10. This survey-based study measures stated preference across the decision journey, indicating a significant shift. Research, comparison, and shortlisting now occur within the AI answer, meaning clicks to owned properties arrive later in the journey with different intent.
Operationally, this creates a complex scenario. A page ranking third for a commercial query might lose direct clicks to an AI summary that cites it, yet still contribute to the pipeline through a branded search a week later. Conversely, a page ranking first could attract many sessions but convert nothing if the query was informational and the answer engine already provided the useful part. Treating these two pages identically in a monthly SEO report obscures the true economics of the channel.
Revenue-focused SEO rejects this false equivalence. The focus shifts from "what ranks" to identifying which organic entries generate qualified actions, how far down the funnel those actions progress, and the cost associated with each.
What a Revenue-Accountable SEO Program Actually Measures
Goals, Calls to Action, KPIs, Metrics: The Order That Matters
Most SEO reports are structured incorrectly. Teams often begin with metrics their tools provide, designate some as KPIs, and then retroactively formulate a goal. This inverted approach results in dashboards that fail to answer critical financial questions.
Federal digital-measurement guidance outlines the correct sequence:
- Define website objectives.
- Identify calls to action that support these objectives.
- Select KPIs to measure the success of those actions.
- Only then choose supporting metrics for each KPI 1.
KPIs specifically measure the success or failure of calls to action; isolated pageviews, session counts, or time-on-page are not sufficient success measures on their own 1. Adhering to this rule eliminates much of what typically appears on a conventional SEO scorecard.
Applied to organic search, this sequence yields a clearer reporting line. For a multi-location service business, the objective might be signed matters, booked consultations, admissions, or qualified estimates. Calls to action are the specific on-page commitments leading to these outcomes, such as a consultation request form, a tracked phone number, or a chat intake. KPIs are ratios tied to these actions, not just visit counts. Supporting metrics then serve to diagnose changes in KPIs, rather than merely populating a report.
Starting with the goal also necessitates a crucial decision often deferred by SEO programs: distinguishing between revenue-contributing organic entries and informational traffic. This distinction must be integrated into the measurement model from the outset, not addressed in a quarterly review after budget allocation.
The Revenue SEO Scorecard
A scorecard built on the goal-first sequence organizes KPIs into three tiers: visibility, engagement, and revenue. Each tier addresses a distinct question, and together they form a comprehensive report.
Visibility tier. : This tier assesses the site's presence where qualified demand searches. Relevant KPIs include impression share for commercially intentful queries, click-through rate for those queries, and share of citations in AI-generated answers for the same query set. Rankings can be included but are demoted to a leading indicator, not a primary reporting outcome. Federal guidance recommends collecting referring search keywords and search analytics to evaluate visibility against relevant queries, rather than aggregating all impressions 3.
Engagement tier. : This tier measures the actions of qualified sessions upon landing. The standard formula is the form-submission conversion rate: form submissions divided by sessions entering the site, as defined in federal analytics training material 2. This ratio also applies to tracked calls, chat completions, and scheduling events. Engagement KPIs should be calculated per landing template (e.g., service page, location page, resource page) to diagnose which content drives conversions versus merely accumulating sessions.
Revenue tier. : This tier links engagement actions to pipeline and booked business. For e-commerce, the Department of Commerce emphasizes including site sales alongside visitors, as sales are the business reference point for evaluating digital strategy 7. Service businesses apply this logic to qualified calls, booked consultations, signed matters, admissions, or won estimates, each priced against its generation cost. Revenue-tier KPIs typically include qualified-action rate (qualified actions divided by total actions), cost per qualified action by acquisition source, and attributed pipeline value by landing template.
Two formulas are foundational: conversion rate (form submissions divided by entering sessions) forms the engagement core 2, and qualified-action rate acts as the revenue filter. Without the latter, a template with a 6% form conversion might appear superior to one with 3%, even if the lower-converting template generates twice the signed business due to better-qualified traffic.
The scorecard should be read sequentially. Visibility indicates query reach. Engagement shows how landing templates convert sessions. Revenue reveals which conversions translate into business. A program strong in all three tiers is effective; weakness in any tier signals a potential budget issue.
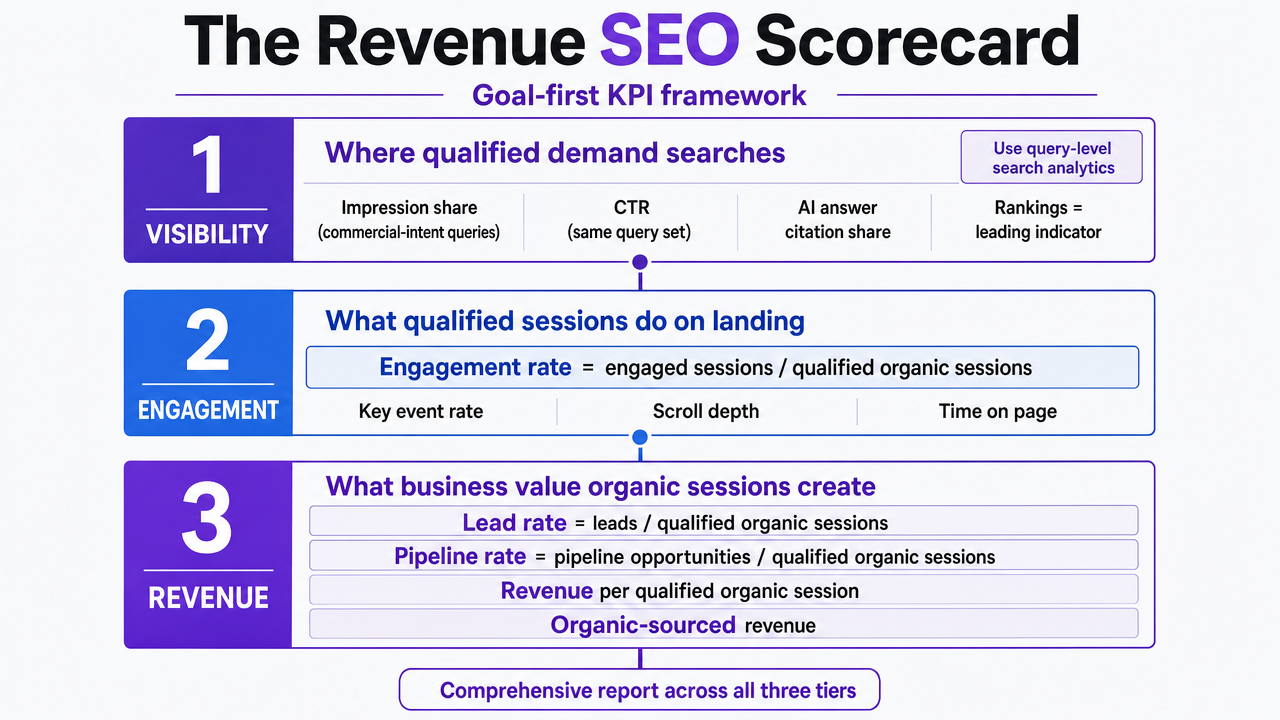 Visualize the three-tier scorecard framework (Visibility, Engagement, Revenue) that structures the entire measurement model described in this section, including the specific KPIs and formulas cited in the prose
Dimensional Analysis: Why Aggregate Organic Traffic Lies
A single aggregate organic sessions number for an entire site is a reporting artifact, not a diagnostic tool. It averages queries with vastly different conversion rates, landing templates serving various funnel stages, diverse device behaviors, and distinct competitive dynamics across locations. This average obscures the mix shift that truly impacts revenue.
Federal measurement guidance directly addresses this by recommending analysis of digital performance metrics across dimensions such as time, content, marketing, technology, and demographics 3. For a revenue-focused SEO program, this translates into practical segmentation: performance by query intent (branded, commercial, informational), landing template, acquisition source and medium, device, location, and day-of-week. Each segment can reveal a different failure point. For instance, a site might appear flat quarter-over-quarter, while mobile sessions on commercial queries from its top three metros plummeted, and informational desktop traffic from unrelated geographies expanded to compensate.
Applying the scorecard across these dimensions transforms a monthly report into a decision-making document. The visibility tier identifies query classes with lost impression share. The engagement tier pinpoints templates on specific devices with declining conversion rates. The revenue tier reveals locations or service lines experiencing reduced qualified actions and attributed pipeline. Aggregate organic traffic cannot provide this level of insight, leading to executive reports that consistently generate confusion without clear decisions.
Content Built to Be Cited, Not Just Crawled
The traditional content brief focused on crawlers and ranking positions. The new brief must produce a page that an answer engine will quote and that a qualified prospect will still click through to.
These distinct objectives guide content structure. Answer engines favor pages that resolve a specific question with a defensible, source-anchored passage near the top, surrounded by verifying context. This means a lead paragraph stating the answer clearly, followed by supporting specifics: formulas, thresholds, regulatory citations, dated figures, or methodology notes. Pages that bury the answer under extensive brand messaging will lose citations to competitors who present it prominently.
Three structural elements differentiate cite-ready pages from crawl-only pages:
- Every citable claim must be attributable on the page itself, with a date, source, and scope note. Federal measurement guidance similarly emphasizes that metrics are only useful when tied to defined objectives and methods 1. Content built for citation applies this discipline publicly.
- The page should answer one primary question and a few related questions, each with its own heading, enabling engines to extract passages easily.
- The page should include entities that help answer engines disambiguate, such as named methodologies, specific jurisdictions, service categories, locations, and credentials, presented in prose rather than solely in schema.
Improved conversion quality is a byproduct. A visitor arriving from an AI summary that cited the page is already pre-qualified on the specific claim. The page's role is then to confirm the answer, add details the summary couldn't include, and guide the visitor to the next action, measured by the engagement and revenue tiers of the scorecard, not just raw session count.
Test data-driven SEO execution on your site now
Experience measurable impact by publishing and tracking real content performance during your risk-free trial.
Technical Quality as a Conversion Lever
Technical SEO work is often justified by crawler-centric metrics like index coverage, Core Web Vitals, and structured data validation. However, these arguments understate its true impact. The same technical quality that aids crawling also determines whether a qualified session completes a form or abandons a half-rendered page on a slow connection.
The GSA case study on website value explicitly connects technical quality to conversion by asking whether teams can measure the impact of improvements, rather than relying on blanket analytics averages. It scores sites across accessibility, performance, SEO, and user behavior as an integrated system 4. Performance.gov applies similar logic, treating technical quality, usability, analytics, and customer experience as interconnected performance categories 6. For a revenue-focused program, this integration is key. A page loading one second slower on mobile doesn't just lose a ranking signal; it loses qualified visitors who might have completed an intake form before the hero image stabilized.
Three technical areas significantly impact conversion:
- Page performance on the specific devices and networks used by the qualified audience, measured per landing template, not as a site-wide score.
- Form and scheduler reliability on those same devices, instrumented to the engagement-tier conversion rate, rather than assumed to work based on desktop QA.
- Accessibility, viewed as a conversion constraint rather than a legal checkbox. WCAG's four principles—perceivable, operable, understandable, and robust—describe the minimum conditions for a visitor to complete a desired action 5. Barriers in any of these areas suppress revenue before generating complaints.
The operational discipline is straightforward: every technical fix should be evaluated against the engagement and revenue tiers of the scorecard, not just isolated Lighthouse scores. If a performance improvement doesn't move template-level conversion rate or qualified-action rate within a defined timeframe, the program needs to know, and subsequent priorities should shift to actions that will.
Compliance as Revenue Infrastructure
Testimonial walls, review widgets, outcome claims, and before-after assets are typically part of the SEO content budget. However, they should also be considered within the compliance budget, as these conversion-lifting elements are often subject to explicit regulatory scrutiny.
The FTC requires advertisers to have adequate substantiation for objective claims before publication, and for health-related claims, the standard is competent and reliable scientific evidence; testimonials alone are insufficient 8. The Endorsement Guides further clarify that testimonials cannot imply results an advertiser couldn't legally claim directly, must be truthful, and may require disclosure of material connections between the endorser and the business 9. The Consumer Reviews and Testimonials Rule, effective October 21, 2024, addresses deceptive practices across review surfaces, including fabricated reviews, undisclosed incentives, suppressed negative reviews, and controlled sites presented as independent 11. Since each of these surfaces is also a conversion lever, consolidating them under one operating standard is more effective than treating them as separate legal checklists.
For a revenue-focused program, three practical consequences emerge:
- Service-page outcome language must align with what the business can substantiate, often requiring the replacement of superlative claims with dated, scoped statements citing underlying evidence.
- Review and testimonial modules need disclosure logic, verification of material connections, and a policy that doesn't filter unfavorable reviews, ensuring that widgets boosting form-submission rates don't create legal exposure.
- Case studies and client stories require an evidence file for each quantified claim, as the FTC regulates the implied general result, not just the individual story 9.
Approaching compliance this way frames it as revenue infrastructure rather than a cost. Pages feature defensible claims, review surfaces convert due to visitor trust, and engagement-tier KPIs improve for sustainable reasons, avoiding tactics that future enforcement cycles might eliminate.
See How Top Brands Align SEO Strategy Directly to Revenue Impact
Request a walkthrough of unified AI workflows that connect SEO performance, pipeline metrics, and revenue attribution—designed for agencies and enterprise teams aiming to drive measurable business outcomes.
If Marketing Owns Multiple Locations: The Consolidation Economics
While the preceding analysis applies to any revenue-focused SEO program, the economics shift significantly when marketing manages a portfolio of locations, practices, branches, or franchise units. This change warrants attention before renewing vendor contracts.
Fragmented vendor stacks were acceptable when SEO reports focused solely on rankings. They become problematic when the objective is to determine which organic entries generated qualified calls, booked consultations, or signed matters at specific locations. Attribution becomes complex, requiring reconstruction across a general SEO agency, a separate content studio, a technical SEO contractor, a reporting dashboard tool, and a review management vendor, each with its own definitions, data pulls, and approval cycles. Federal measurement guidance recommends analyzing performance across dimensions including content, acquisition source, location, and device 3. A stack that provides only partial views of these dimensions cannot support the required analysis.
The following table serves as a planning scaffold, not a benchmark. Marketing leaders can directly input variables relevant to their portfolio.
| Function | Fragmented vendor stack | Unified execution model |
|---|---|---|
| Typical vendor count | 4–6 relationships (SEO, content, technical, reporting, reviews, sometimes local) | 1 execution surface |
| Attribution ownership | Shared across vendors; reconciled in-house, usually monthly | Single source of record across visibility, engagement, and revenue tiers |
| Approval latency | Days to weeks per asset, multiplied by brief cycles with each vendor | Approval-first workflow in a single queue |
| Cost variability per location | High; retainers scale per vendor and per market, add-ons priced ad hoc | Low; execution capacity scales as a planning variable, not a procurement cycle |
| Dimensional reporting (per ref_3) | Partial; each vendor cuts the data its own way | Native segmentation by location, template, device, and acquisition source |
This comparison highlights three operational consequences for portfolio operators:
- Attribution ownership defaults to in-house, as no single vendor in a fragmented stack can report revenue-tier KPIs across all locations without data controlled by others.
- Approval latency becomes the primary throughput constraint; a service page revision involving content, technical, and compliance can spend weeks in queues across multiple vendor relationships before publishing to numerous locations.
- Cost variability per location will eventually be audited by the CFO, as fragmented retainers rarely scale linearly with the portfolio, and unpredictable add-on charges fill the gaps.
The consolidation question isn't about buying fewer tools, but whether the operating model can produce one attributable number per location per month that satisfies the revenue tier of the scorecard. If the current stack cannot, reducing the vendor count is the initial problem to address.
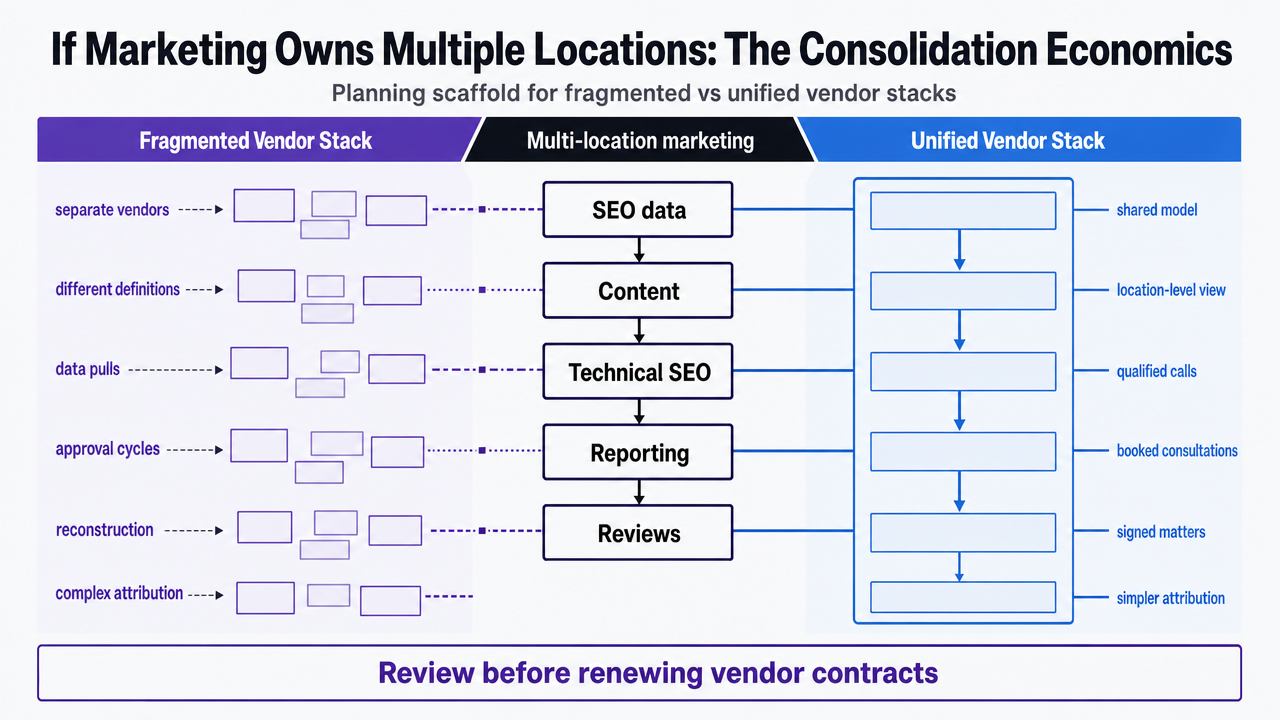 Translate the comparison table in this section into a visual side-by-side operating-model comparison, which the article explicitly presents as a planning scaffold for fragmented vs unified vendor stacks
Operating Model: Who Owns the Revenue Number
Measurement models fail when no single individual is accountable for the numbers they produce. A revenue-focused SEO program requires a named owner for the revenue tier of the scorecard, not a committee.
This role is not the SEO manager, content lead, or agency account director. It is the marketing leader empowered to decide, within a week, whether to pull a template, rewrite a service page, pause a location rollout, or implement a compliance change across the portfolio. This decision-making authority transforms a scorecard from a reporting artifact into an operational instrument. Federal measurement guidance similarly notes that metrics are useful only when tied to defined objectives and the calls to action that advance them, implying that someone must be empowered to act on the insights 1.
Three operating conditions ensure the owner's effectiveness:
- The visibility, engagement, and revenue tiers must report into a single interface, eliminating the need for the owner to reconcile definitions across multiple vendor dashboards.
- The owner must have approval authority for anything impacting templates that drive qualified actions, preventing execution delays in brief cycles.
- A weekly review cadence for engagement and a monthly cadence for revenue ensure corrections occur within the quarter they are needed, rather than retrospectively.
Teams seeking this operating model without increasing headcount often consolidate execution onto a single approval-first platform; Vectoron is designed for this approach.
Frequently Asked Questions
References
- 1.An introduction to analytics.
- 2.DAP Learning Series: Site Analysis, Live!.
- 3.DAP: Digital Metrics Guidance and Best Practices.
- 4.Determining the true value of a website: A GSA case study.
- 5.An advanced approach to accessibility.
- 6.Federal Website Performance.
- 7.eCommerce Key Performance Indicators.
- 8.Health Products Compliance Guidance.
- 9.Guides Concerning the Use of Endorsements and Testimonials in Advertising.
- 10.New front door to the internet: Winning in the age of AI search.
- 11.The Consumer Reviews and Testimonials Rule: Questions and Answers.