
Key Takeaways
- Share of voice is not one metric but a family of ratios—spend, impression, mention, and search—that share a formula but answer different competitive questions and require different data pipelines.
- Every SOV number is undefined without three attached labels: the variant used, the competitor set that defines the denominator, and the time window bounding the calculation.
- Excess share of voice, the gap between SOV and share of market, functions as a directional forecasting layer: positive ESOV correlates with share growth, negative with decline 1.
- SOV should never carry a QBR alone; Forrester's brand-health framing situates it inside a composite scorecard with sentiment, engagement, and reach to avoid misreading divergent signals 6.
SOV is a family of ratios, not a single metric
Most agency SEO leads inherit share of voice as a single line on a client dashboard: one percentage, one competitor set, one story. That framing collapses under any serious portfolio review. The metric the classical advertising literature describes as a proportion of category ad spend 4 is not the same metric a PR platform reports as a proportion of media mentions 7, and neither maps cleanly to the search visibility index a strategist actually uses to defend content investment. They share a formula. They do not share a meaning.
The cleanest way to operate SOV across a book of clients is to treat it as a family of ratios. Each variant answers a different competitive question, draws from a different data source, and carries a different confidence interval. Spend SOV describes media investment concentration. Impression SOV describes attention delivered. Mention SOV describes conversational presence. Search SOV describes organic real estate on the SERPs and, increasingly, in AI answer surfaces 11. The same brand can hold a 4% spend SOV, a 12% mention SOV, and a 22% search SOV in the same quarter, and every one of those numbers can be correct.
The rest of this piece treats SOV as that tiered system: a generalizable formula 8, four operational variants, one forecasting layer on top, and a set of failure modes that show up when strategists blur the distinctions.
The formula that unifies four different SOV variants
The base equation is trivial. SOV equals the brand's target metric divided by the total category metric, multiplied by 100 8. A brand spending $2M in a category with $20M in total advertising spend holds a 10% share of voice 2. That is the calculation most agency onboarding decks use, and it works cleanly when the numerator and denominator come from the same measurement system.
The complication starts with what gets plugged into the numerator. The same formula produces spend SOV when the input is media dollars 4, impression SOV when the input is delivered impressions 2, mention SOV when the input is tracked brand mentions across earned and social media 7, 9, and search SOV when the input is a weighted visibility index across ranked queries 11. Four numerators, four data pipelines, four operational meanings, one arithmetic identity.
The generalized framing — target metric divided by total, times 100 — is what allows a strategist to move between variants without rewriting the reporting logic 8. It is also what causes the confusion agency leads spend QBRs untangling. A client who hears "our share of voice went from 8% to 14%" cannot evaluate that claim without knowing which numerator produced it, which competitor set defined the denominator, and which time window bounded the calculation. Two of those inputs are analyst choices, not observed facts.
The practical implication for portfolio reporting is that SOV should never appear on a dashboard as a bare percentage. It should carry three attached labels: the variant (spend, impression, mention, or search), the competitor set, and the window. Without those, the number is undefined. With them, the same underlying formula produces four disciplined metrics that answer four different competitive questions, which the next section works through variant by variant.
The four SOV variants and when each one applies
Spend SOV: media investment planning
Spend SOV is the original definition and still the cleanest one to defend when a client is deciding how to allocate a paid media budget. The numerator is the brand's media investment in a defined category and window; the denominator is total category spend across the tracked competitor set 4. The output tells a planner one thing: how concentrated the brand's paid presence is relative to the money competitors are putting into the same auction or the same category buys.
Its strength is comparability. Spend is denominated in dollars, sourced from measured media databases or client-reported buys, and does not require normalization across ad formats. Its weakness is that spend does not equal attention. Two brands can spend identically and deliver very different reach depending on inventory quality, dayparting, and creative rotation 5. Spend SOV is the right variant when the strategic question is investment concentration — is the brand under- or over-indexed against category peers on paid dollars — and the wrong variant when the question is whether audiences actually saw the work. For agency leads defending a paid budget line in a QBR, spend SOV is the number the CFO will accept without a footnote.
Impression SOV: brand awareness campaigns
Impression SOV replaces the dollar numerator with delivered impressions 2. It answers a different question than spend SOV: not how much money the brand committed, but how much attention the market actually received on the brand's behalf. Two brands with identical spend can post very different impression SOV figures once inventory efficiency, targeting, and negotiated rates are accounted for.
This is the variant to run when the campaign objective is awareness lift and the measurement conversation is about attention delivered. Channel decomposition matters here — mobile impressions behave differently from desktop or CTV impressions, and the Mobile Marketing Association has documented that mobile SOV is most predictive when paired with frequency and creative-quality measures rather than reported in isolation 3. Strategists should also mark impression SOV as viewable-adjusted where possible, since raw served-impression counts overstate presence in programmatic environments. Reported without those adjustments, impression SOV inflates confidence in campaigns that never actually reached the intended audience.
Mention SOV: PR and communications mandates
Mention SOV is the variant that dominates the PR and communications discipline. The formula is unchanged — brand mentions divided by total industry mentions across the tracked media set, multiplied by 100 7, 9. The numerator shifts from paid dollars or delivered impressions to earned coverage: press articles, social posts, podcast transcripts, and any conversational surface a listening tool can index.
Two operational choices define whether mention SOV is defensible or noise. The first is the corpus. A mention SOV drawn from top-tier trade press tells a different story than one drawn from unfiltered social listening, and mixing the two produces a number no one can act on. The second is deduplication. Syndicated coverage, retweets, and near-identical reprints inflate mention counts asymmetrically across competitors depending on which brands have larger owned audiences amplifying their own coverage. Cision and Onclusive both frame mention SOV as a benchmark for media relations performance and messaging traction 7, 9, which is the correct scope. It is the variant to run when the mandate is PR or comms, when the KPI is share of conversation, and when the deliverable is a competitive coverage report — not when the client wants a proxy for revenue.
Search SOV: organic growth mandates
Search SOV is the variant most agency SEO teams already operate, whether or not they label it that way. The numerator is a weighted visibility index across a tracked keyword set — typically ranked position multiplied by search volume, with SERP feature ownership layered on top. The denominator is the total visibility available across that same keyword set to the competitor cohort. Modern practice extends the calculation to AI answer surfaces and generative results, where citation share increasingly matters alongside classic blue-link position 11.
This is the variant to run when the mandate is organic growth, when the deliverable is a content roadmap, and when the QBR narrative needs to connect visibility gains to pipeline. Its precision depends on keyword-set discipline. A search SOV calculated across a brand's entire tracked universe smooths over the categories that actually convert; the same calculation restricted to commercial-intent queries reveals where content and link equity should move next quarter. Agency leads should report search SOV at two altitudes: a portfolio-wide index for trend tracking, and a segmented view by intent cluster for allocation decisions.
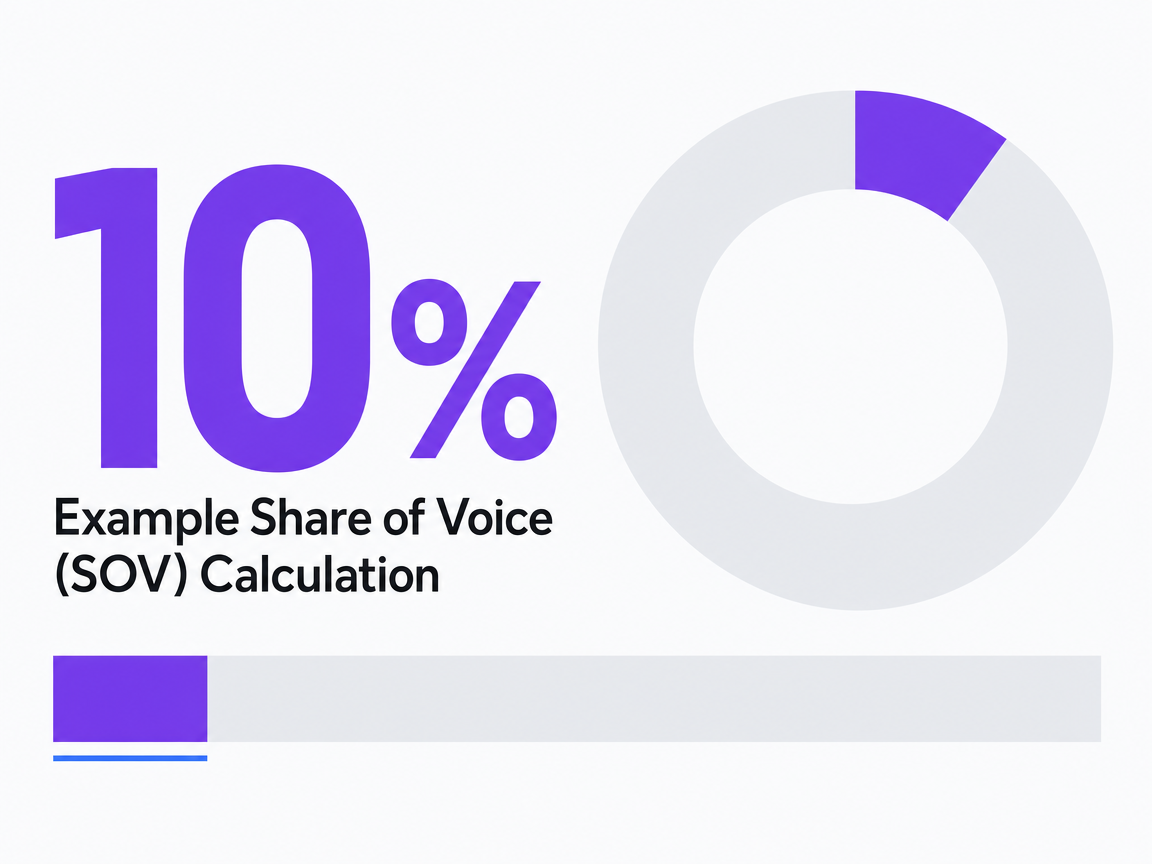 Example Share of Voice (SOV) Calculation
Example Share of Voice (SOV) Calculation
Measure and grow your true share of voice
Test-drive live share of voice insights and publish real results in your own campaigns during your trial.
ESOV as the forecasting layer above descriptive SOV
Descriptive SOV tells a strategist where a brand stands right now. It does not tell them where the brand is going. That forecasting layer sits one level up, in the relationship between share of voice and share of market — the delta most planners call excess share of voice, or ESOV.
The mechanic is simple to state and harder to operate. When a brand's SOV exceeds its share of market, ESOV is positive, and research across brand studies has found that positive-ESOV brands tend to grow their market share over subsequent periods; when SOV runs below SOM, ESOV is negative and the same body of work associates that position with share decline 1. The relationship is directional, not deterministic. It is a correlational finding drawn from aggregated brand-tracking studies, not a causal law, and it does not promise a specific growth rate from a specific ESOV point. It tells agency leads which side of the line a client is standing on.
That distinction matters for how the metric gets reported. ESOV plotted against SOM produces a two-axis geometry with a diagonal ESOV-zero line: brands above the line sit in the growth zone, brands below it sit in the decline zone, and distance from the line indicates the size of the imbalance rather than a guaranteed outcome 1. Agency strategists using ESOV as a forecasting layer should read it as a leading indicator that flags directional risk quarters before revenue moves, not as a substitute for a media-mix model.
Two scope conditions bound the finding. First, ESOV's predictive value degrades in cluttered categories where marginal spend delivers diminishing returns; simply pushing SOV higher does not guarantee proportional share gain when creative effectiveness and category noise are ignored 5. Second, the SOM half of the calculation has to come from a credible source — reported revenue share, unit share, or a syndicated category read — because pairing a rigorous SOV with a soft SOM estimate produces an ESOV number that looks precise and behaves like noise.
Operationally, ESOV is the one number an agency lead can put in front of a client CMO to reframe a QBR from descriptive to predictive. A brand holding a 12% search SOV against an 8% category share is running a positive ESOV of four points, which supports a growth thesis for the next planning cycle. The same brand at 12% SOV against a 16% share is running a negative ESOV, and the recommendation shifts from optimization to investment defense. Descriptive SOV alone cannot make that call.
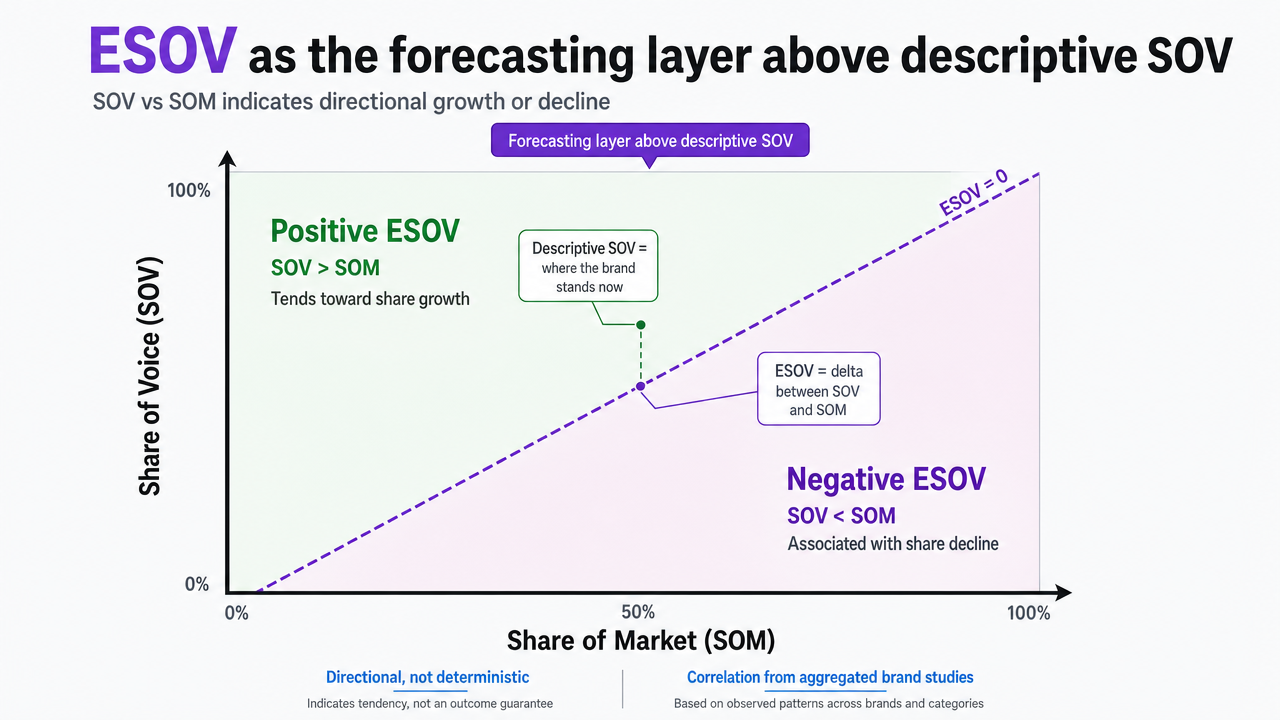 Illustrate the ESOV geometry described in the section — the two-axis SOV vs SOM plot with a diagonal zero line separating growth and decline zones — which is explicitly described in the article prose
Failure modes: cluttered categories, diminishing returns, metric substitution
Three failure modes show up repeatedly when SOV moves from a slide in an onboarding deck to a recurring line in a QBR. Each one distorts the number in a different direction, and each one has a specific tell that strategists can flag before a client conversation goes sideways.
The first is category clutter. In densely contested categories where every competitor is running sustained paid and content pressure, the marginal impact of an additional SOV point compresses. WARC's best-practice work is direct on this: sustained SOV leadership correlates with brand growth, but simply spending SOV higher without accounting for creative effectiveness and category noise produces diminishing returns 5. Agency leads reporting SOV in a cluttered category should pair the number with a saturation read — a flat SOV trend against rising category spend often tells a more honest story than a headline percentage.
The second is metric substitution. Because the base formula accepts any numerator 8, strategists under reporting pressure sometimes swap variants mid-engagement — reporting mention SOV one quarter and search SOV the next, or blending mentions and impressions into a composite that no downstream reader can decompose. QuestionPro's expansion of SOV to "every measurable form of brand awareness" 10 is descriptively accurate and operationally dangerous: the more surfaces the metric absorbs, the less any single trendline means. The fix is disciplinary. Lock the variant at engagement kickoff, name it on every report, and treat cross-variant comparisons as separate analyses rather than continuations of the same series.
The third is denominator drift. Competitor sets change quietly — a new entrant enters the tracked cohort, a legacy competitor exits, a listening tool updates its media corpus — and SOV moves without any change in the brand's actual presence. Every SOV report should timestamp the competitor set and flag denominator changes explicitly, or the trendline becomes an artifact of measurement rather than a signal.
See How Leading Agencies Quantify and Scale Share of Voice
Connect with our team to discover data-backed frameworks for tracking, benchmarking, and expanding your clients’ share of voice—without increasing overhead or losing strategic control.
SOV inside a composite brand-health scorecard
SOV should not carry a QBR narrative alone. Forrester's brand-health work places share of voice among the leading indicators of awareness and consideration, but it sits alongside sentiment, engagement, and reach in a composite scorecard rather than standing in for any of them 6. A rising SOV paired with declining sentiment tells a different story than a rising SOV paired with rising engagement, and neither conclusion is available from the SOV line by itself.
The operational implication for agency leads is that every SOV report should be shipped inside a four-input frame: SOV for competitive visibility, sentiment for the valence of that visibility, engagement for behavioral response, and reach for audience delivery. When those inputs move in the same direction, the brand-health thesis is consistent and the recommendation follows the trend. When they diverge — SOV up, sentiment down, or SOV flat while engagement climbs — the divergence is the finding. Forrester's framing is explicit that single metrics like SOV are insufficient for holistic brand-health assessment, which is why composite indices exist 6. Strategists who report SOV as a standalone KPI are handing clients an incomplete picture and inviting the wrong next-quarter decision.
If the account is a portfolio: standardizing SOV across client engagements
Normalizing data sources across accounts
The scope shifts here from single-brand reporting to portfolio-scale delivery. An agency SEO lead managing 40 client accounts is not measuring SOV for one brand — they are running 40 parallel measurement systems that need to produce comparable outputs at QBR time. The moment two accounts define their competitor sets differently, or pull mentions from different listening corpora, portfolio-wide rollups become apples to oranges.
Normalization starts at three layers:
- The variant layer locks each account to one primary SOV type — spend, impression, mention, or search — chosen from the client's mandate rather than from whichever data source is easiest to query.
- The corpus layer standardizes the data pipeline: one listening tool for mention SOV across every PR account, one ranking data provider for search SOV across every organic account, one impression source per media platform.
- The competitor-set layer requires explicit rules for cohort selection — typically top five by category revenue, top five by paid presence, or a client-nominated set — and forbids silent additions mid-engagement.
Study.com's generalized framing that SOV is any target metric divided by its total 8 is what makes portfolio normalization possible at all. The formula travels; the inputs have to be governed. Without written rules on all three layers, a portfolio-wide SOV rollup describes analyst choices more than brand performance.
Portfolio measurement economics: analyst hours per reporting cycle
The economics of manual SOV reporting scale non-linearly with account count and channel count. Each account requires competitor-set maintenance, corpus checks, pull-and-clean work, and narrative writeup. Each additional channel — search, social, PR mentions, paid impressions — multiplies the pull-and-reconcile time rather than adding to it, because cross-channel consistency checks compound.
The table below uses illustrative agency planning variables, not sourced benchmarks. It is meant as a structure for capacity modeling, not as a market rate.
| Accounts | 1-channel SOV (analyst hrs/cycle) | 2-channel SOV (analyst hrs/cycle) | 4-channel SOV (analyst hrs/cycle) |
|---|---|---|---|
| 10 | ~15 | ~35 | ~80 |
| 25 | ~40 | ~90 | ~200 |
| 50 | ~80 | ~180 | ~400 |
| 100 | ~160 | ~360 | ~800 |
The pattern the variables illustrate is the operational trap. An agency that moves from single-channel search SOV reporting to a four-channel composite — search, social, mention, paid impression — does not double or triple analyst load. It multiplies it by roughly five, because every additional channel adds its own corpus governance, competitor-set reconciliation, and narrative synthesis. QuestionPro's expansion of SOV to "every measurable form of brand awareness" 10 is descriptively accurate, and this table shows the labor cost of taking that expansion literally at portfolio scale. Agency leads facing that cost curve typically choose one of three responses: cap channel breadth per account, cut reporting cadence from monthly to quarterly, or move the pull-and-clean layer out of analyst hands entirely. The third option is where the operating model changes.
Where AI-driven competitive intelligence changes the math
The labor curve in the previous table is what makes multi-channel SOV reporting a headcount problem rather than a measurement problem. Adding channels adds analysts. Adding accounts adds analysts. That is the constraint AI-driven competitive intelligence is built to break.
The mechanism is narrow and specific. Automation absorbs the pull, clean, dedupe, and normalize layer — the parts of SOV reporting that consume analyst hours without requiring strategic judgment. Competitor-set governance, corpus rules, and variant selection remain analyst decisions, because those are the choices that make the number defensible. What changes is the ratio of judgment work to production work per report. An agency running mention SOV across 50 PR accounts no longer scales linearly with analyst count; it scales with the sophistication of its governance rules and the exception rate the automation surfaces for human review.
Forrester's framing that SOV belongs in a composite scorecard alongside sentiment, engagement, and reach 6 becomes operationally tractable at portfolio scale only when the underlying pull is automated. Composite reporting across 40 accounts on manual pipelines is a capacity question the table above already answers. Platforms like Vectoron sit in that automation layer — extracting brand memory, competitor sets, and channel signals as governed inputs so agency strategists spend their hours on the interpretation the client is actually paying for.
Frequently Asked Questions
References
- 1.Share of Voice Statistics for 2026: Advertising Spend, Market Impact.
- 2.Share of Voice Advertising: 2026 Formula + 6 Tools.
- 3.The Value of Brand Share of Voice in Mobile Marketing.
- 4.Share of voice.
- 5.Effective use of share of voice - WARC Best Practice.
- 6.Measuring Brand Health In The Digital Age - Forrester.
- 7.What is Share of Voice? How to Measure & Increase Brand Share of Voice.
- 8.Share of Voice | Definition, Calculation & Examples.
- 9.What Is Share of Voice? Definition, Formula & How to Guide.
- 10.Share of Voice: What It Is, Importance + How to Measure.
- 11.What Is Share Of Voice? How To Measure And Increase Brand SOV.