
Key Takeaways
- Replace the informational/commercial/transactional taxonomy with a five-tier pipeline-proximity model that scores each query on how close the searcher is to a booked opportunity.
- Score every candidate query on tier, SERP retention flag, and closed-won contribution, since AI Overviews compress click yield on question-shaped and long queries 2.
- Apply a mechanical keep, cut, or consolidate rule against two sales cycles of CRM data so portfolio decisions become arithmetic rather than editorial preference.
- Spend the next quarter building the query-to-page map, wiring GA4-to-CRM first-touch capture, and reporting pipeline contribution rate as the header metric 11.
Why keyword lists stopped producing pipeline
The keyword lists that fed B2B pipeline three years ago are quietly failing. Rankings hold. Impressions in Search Console look healthy. Sessions arrive. What has thinned out is the connection between those sessions and CRM opportunities that close.
Two forces are compressing that connection. The first is a change in what the search engine result page actually returns. Pew Research analyzed 68,879 Google searches from 900 U.S. adults in March 2025 and found that 18% of those searches produced an AI-generated summary at the top of the page. When a summary appeared, users clicked a traditional link in only 8% of visits 2. This is one month of U.S. consumer behavior, not a B2B panel. However, the mechanism is not consumer-specific. Question-shaped queries and longer, more specific queries are the exact formats demand generation teams have spent a decade optimizing against, and those are the formats most likely to be intercepted by an AI answer.
The second force is internal. Most keyword strategies still sort queries by search volume and keyword difficulty, then group them into informational, commercial, and transactional buckets. That taxonomy predates AI Overviews and the pipeline-attribution tooling most teams now use. It cannot answer the question a revenue leader actually asks: which queries produced opportunities, and which produced traffic that never advanced a stage.
Google's own guidance reinforces the shift. Its helpful-content framework judges pages on whether they satisfy a user's task, not whether they match a string 1. A keyword list built on volume alone will index against tasks that AI summaries now complete without a click.
What follows is a different construction: a portfolio scored on buyer proximity, click retention, and traceable contribution to booked revenue. The rest of the article builds that model and the audit method behind it.
The pipeline-proximity scoring model
Five tiers mapped to CRM stages
A pipeline-proximity model replaces the informational/commercial/transactional taxonomy with five tiers that mirror how a CRM actually tracks a buyer. Each tier gets a score from 1 to 5. The score answers a single question: how close is the person typing this query to being a booked opportunity?
Tier 1 — Unaware (score: 1). : The searcher does not yet recognize the problem the product solves. Queries are broad category or trend questions. These are the queries most exposed to AI Overview interception and the least likely to produce a same-session opportunity. Example shape: "why is [industry metric] declining."
Tier 2 — Problem-aware (score: 2). : The searcher can name a symptom but not a category of solution. Queries describe pain in the buyer's own language. Example shape: "[team] cannot forecast [outcome]." These queries feed nurture, not pipeline, and should be retained only when downstream tracking proves they later convert.
Tier 3 — Solution-aware (score: 3). : The searcher knows a category of solution exists and is evaluating approaches. Queries include "how to," "framework," "vs," and comparison patterns without specific vendor names. Google's own consumer-insights reporting notes that 40% of shoppers say Search helps them make informed decisions, which is directional evidence that evaluative queries still carry weight even where the analog is consumer, not B2B 10.
Tier 4 — Vendor-aware (score: 4). : The searcher has a shortlist. Queries include vendor names, "[category] pricing," "[category] alternatives," and review-shaped patterns. Click retention on these SERPs remains high because the searcher needs specific pages, not summaries.
Tier 5 — Decision (score: 5). : The searcher is ready to act. Queries are branded, integration-specific, or transactional ("[vendor] demo," "[vendor] login," "[vendor] contract terms"). Conversion is same-session or next-session. These queries fund the pipeline.
The five-tier matrix pairs each score with expected CRM stage, expected conversion behavior, and whether the SERP layout typically preserves clicks. A team that scores every target query on this scale before writing a single brief has already made the portfolio decision explicit.
Scoring a query on buyer proximity
Scoring is not intuition. It is a short checklist the team applies to each candidate query before it enters the editorial queue.
- Examine the query language itself. Does the phrase contain a category name, a vendor name, or a pricing/demo modifier? Each modifier raises the tier. A query with none of these usually sits at Tier 1 or 2.
- Inspect the live SERP. Pages that rank on page one are the market's answer to what the query means. If nine of the top ten results are definitional blog posts, the query is problem-aware regardless of what the team hoped it was. If the top ten include pricing pages, comparison tables, and vendor documentation, the query is Tier 4 or 5.
- Check whether an AI Overview is currently rendered. When one appears, the tier does not change but the click-retention score drops. That score becomes a multiplier in the portfolio allocation, not a disqualifier.
- Look at existing CRM data if the query already brings traffic. Pull the landing page from Search Console, then trace which opportunities cite that page as a first or assisting touch. A Tier 3 score with zero opportunity association after two quarters is a scoring error, not a slow bloomer.
The output of this exercise is a spreadsheet with one row per query and columns for tier score, SERP retention flag, and current opportunity association. That spreadsheet is the input to every downstream decision: what to write, what to consolidate, and what to retire.
SERP capture economics under AI Overviews
The click economics of Google search changed faster than most keyword strategies did. A Pew Research analysis found that 60% of question-shaped queries (who, what, why) generated an AI summary, and 53% of long queries of 10 or more words did the same 2. The sample is U.S. consumer behavior over one month, not a B2B panel, but the query patterns most affected are the exact patterns demand generation teams have spent years producing content against.
That matters for keyword economics because click retention is now a variable that must be scored per query, not assumed. A Tier 2 problem-aware query written as a full question ("why is [metric] declining for [team]") sits directly inside the 60% trigger zone. Even if the page ranks first, the expected click rate on that position is no longer the historical 25% to 30%. It compresses toward the 8% floor whenever a summary is present. A Tier 4 vendor-aware query like "[category] pricing" or "[competitor] alternatives" is far less likely to trigger a summary because the SERP is dominated by product pages, comparison tables, and review sites that AI summaries do not replicate cleanly.
The operational rule follows directly. Every candidate query gets a SERP retention flag alongside its tier score. The flag has three states:
- Retained — no summary observed in repeated checks.
- Partial — summary appears intermittently or only for some geographies.
- Intercepted — summary appears consistently and answers the query.
Intercepted queries at Tier 1 or Tier 2 are the lowest-value slots in the portfolio. They still consume production capacity but return a fraction of the historical click yield.
This is not an argument to abandon informational content. It is an argument to price it correctly. If problem-aware content historically produced 100 sessions per published page and now produces 30 because of interception, the cost per opportunity from that tier has more than tripled. The portfolio must either compensate with volume, shift capacity toward retained tiers, or accept a lower absolute ceiling on organic-sourced pipeline. There is no fourth option that involves ignoring the arithmetic. The next section walks through how to run that arithmetic against ranked queries the team already owns.
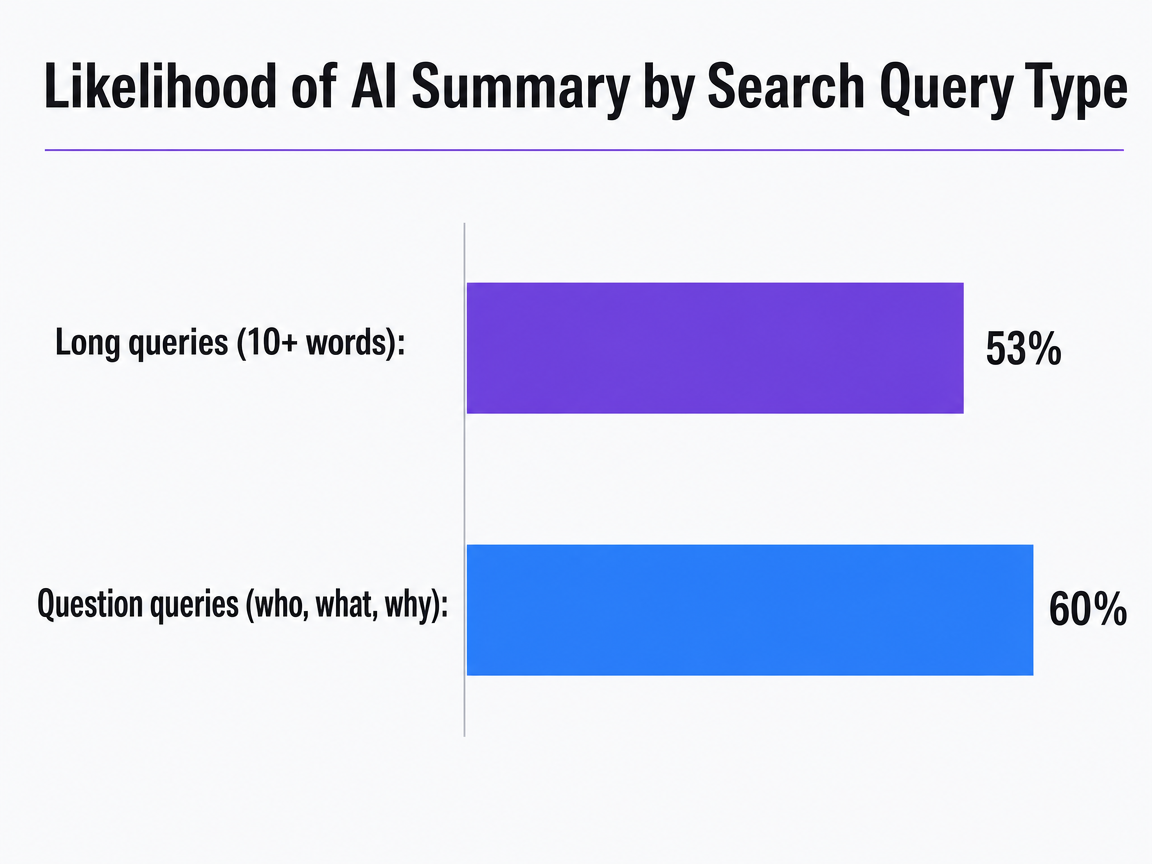 Likelihood of AI Summary by Search Query Type
A comparison showing the percentage of time an AI summary was generated for different types of search queries, based on Pew Research data. Long queries (10+ words) triggered summaries 53% of the time, while question-based queries did so 60% of the time.
Test keyword-driven pipeline growth strategies instantly
Experiment with live SEO keyword optimizations and measure qualified pipeline impact before committing.
The keyword contribution audit
From Search Console query to closed-won revenue
Most demand generation teams already have every data point required to score keywords on revenue contribution. The failure is in stitching those points together. The audit chain has four links: Search Console query, GA4 landing page, CRM opportunity, and closed-won revenue. Each link breaks in a predictable place, and each break can be fixed without new tooling.
The first link is Search Console to GA4. Search Console reports the query. GA4 reports the landing page. The join happens at the URL. Teams lose fidelity here when a single landing page ranks for dozens of queries, because GA4 cannot see which specific query drove which specific session. The fix is a query-to-page map maintained manually: each target keyword is assigned a single primary landing page, and pages that rank for multiple target keywords are flagged for consolidation review.
The second link is GA4 to CRM. This is where most audits collapse. A session becomes an opportunity only if the form fill, demo request, or account creation carries the landing page and referring source into the CRM record. UTM parameters on internal CTAs, hidden form fields capturing the first-touch page, and a CRM field for organic first-touch URL are the minimum wiring. Without those three, the audit stops at sessions and cannot advance to pipeline.
The third link is opportunity to closed-won. This one is usually clean because the CRM already tracks stage progression. The task is to filter opportunities by organic first-touch URL, group by the primary keyword mapped to that URL, and sum closed-won revenue over a trailing window that matches the sales cycle.
Practitioner guidance on B2B measurement identifies pipeline contribution rate as the core revenue metric marketing should be judged on, not session volume or MQL counts 11. That framing is what makes the audit defensible. When a keyword's row shows zero opportunities across two sales cycles, the argument to retire it is arithmetic, not opinion.
The keep, cut, or consolidate rule
Once the audit produces a row per keyword with tier score, SERP retention flag, and closed-won contribution, the decision rule is mechanical. Three outcomes exist: keep, cut, or consolidate. Each has a quantitative threshold, not a qualitative judgment.
Keep. : A keyword stays in the portfolio when it meets one of two conditions. Either it produced at least one closed-won opportunity in the trailing two sales cycles, or it sits at Tier 4 or Tier 5 with a retained SERP flag and is less than two quarters old. The second condition protects decision-stage queries that have not yet accumulated enough history to prove revenue contribution but occupy click-retained SERP real estate.
Cut. : A keyword is retired when it has ranked in the top ten for two full sales cycles, produced zero opportunities, and carries an intercepted SERP flag. The intercepted flag is the tiebreaker. A Tier 2 problem-aware query with zero opportunities but a retained SERP might still feed brand recall; the same query with an AI summary interception loses that consolation and becomes pure production cost.
Consolidate. : A keyword is merged into another page when it shares a primary landing page with a higher-scoring query, or when its SERP results overlap by 60% or more with a keyword already in the portfolio. Consolidation reduces the number of pages competing against each other and concentrates authority on a single URL. The merged page inherits the tier score of the highest-tier query in the group.
The rule works because it removes the debate. Executives do not ask why a specific blog post was retired when the audit sheet shows two sales cycles, zero opportunities, and an intercepted SERP. They ask what replaced it.
Portfolio allocation against a pipeline target
Allocation is where the scoring model turns into a production plan. The inputs are the ones a demand generation manager already knows: the pipeline target for the year, the percentage of that pipeline organic search is expected to source, the average deal size, and the blended organic conversion rate from session to opportunity. The output is a count of pages the team must produce or maintain across each tier, weighted by SERP retention.
The arithmetic runs in four steps:
- Translate the pipeline target into opportunities. If the goal is $X in organic-sourced pipeline and the average deal size is $D, the portfolio must produce X/D qualified opportunities in the trailing sales cycle.
- Translate opportunities into sessions using the blended conversion rate the CRM already reports. A 1.5% session-to-opportunity rate means each opportunity requires roughly 67 organic sessions.
- Allocate those sessions across tiers according to observed contribution history, not aspiration.
- Adjust each tier's session target upward when its SERP retention flag is partial or intercepted, because published pages in those tiers now yield fewer clicks per ranked position.
A defensible starting allocation weights production capacity toward the tiers that fund pipeline:
- Roughly 40% of capacity goes to Tier 4 and Tier 5 pages, where click retention holds and conversion is measurable within one sales cycle.
- Around 30% goes to Tier 3 solution-aware pages, which carry evaluative weight and typically retain clicks because comparison and framework SERPs resist clean AI summarization.
- The remaining 30% is split between Tier 2 problem-aware and Tier 1 unaware content, with Tier 1 receiving the smallest share because it sits inside the query zone most exposed to AI summary interception 2.
Those percentages are a starting point, not a rule. The audit sheet dictates the actual split. A team whose Tier 3 pages produced 60% of organic-sourced opportunities last year should not cap that tier at 30% next year. A team whose Tier 2 pages produced zero opportunities across two cycles should not fund them at 15%.
The allocation must also account for maintenance versus new production. Ranked pages that meet the keep threshold still require updates, and each update consumes capacity that would otherwise go to new briefs. A useful split is 60% new production, 40% refresh, adjusted quarterly based on which tier is closest to its session target. When Tier 5 sessions run 20% below target, capacity shifts to decision-stage refresh before any new Tier 2 brief is approved.
The portfolio decision that results is defensible in a single sentence: capacity is allocated where contribution history and SERP retention justify it, and every quarter the audit sheet reweights the split. That framing is what a revenue leader can sign off on, because it ties keyword production to the same pipeline math the sales team already runs.
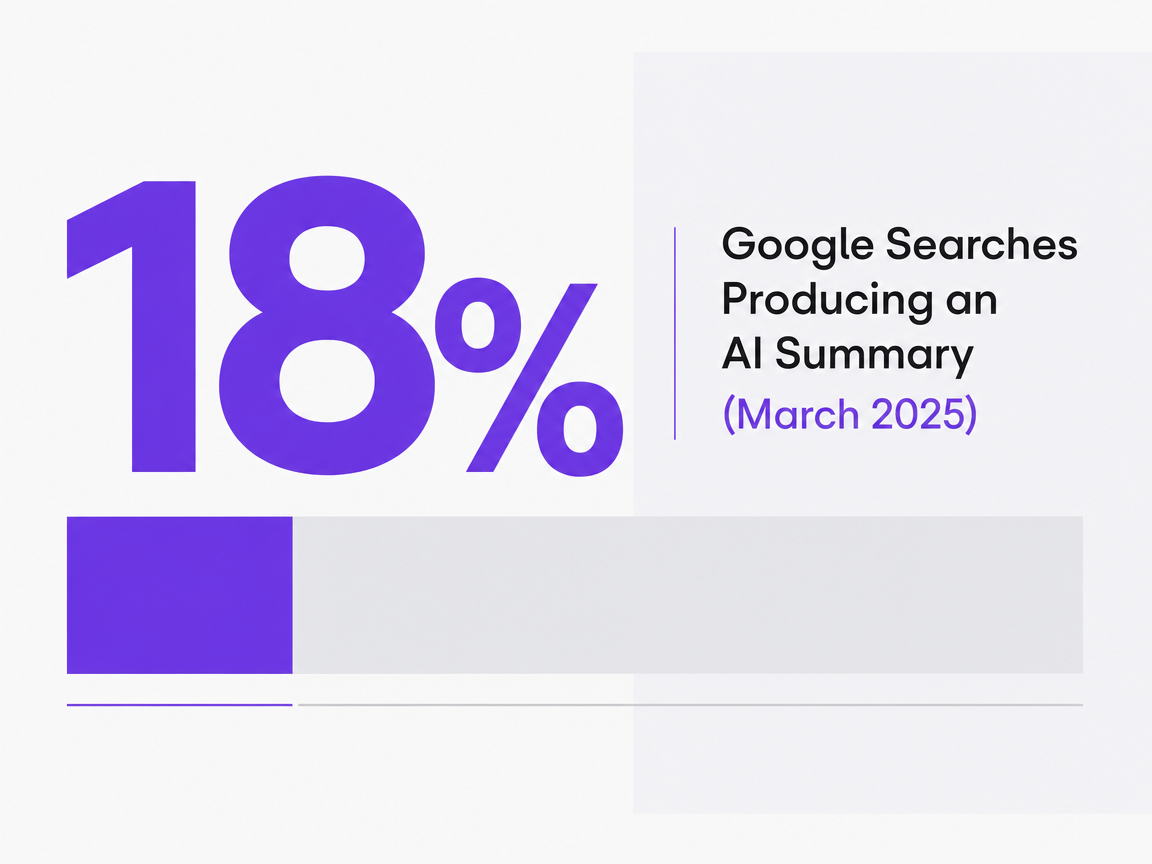 Google Searches Producing an AI Summary (March 2025)
Google Searches Producing an AI Summary (March 2025)
See How Leading Teams Operationalize SEO Keyword Strategy for Predictable Pipeline
Request a walkthrough of the data-first workflow for selecting, approving, and executing pipeline-driving keywords—purpose-built for agencies and enterprise marketing teams seeking measurable, repeatable lead outcomes.
Defending the portfolio to executives
The audit sheet is the defense. When a VP of marketing or a CFO questions why the team retired 40 problem-aware posts or shifted capacity toward vendor comparison pages, the answer is not a strategy narrative. It is a row-level record showing tier score, SERP retention flag, and closed-won contribution across two sales cycles. The conversation moves from taste to arithmetic.
Three talking points hold up in a revenue review:
- Pipeline contribution rate as the header metric, not sessions or MQL counts. B2B measurement guidance now treats pipeline contribution as the core marketing KPI because it survives the translation from marketing dashboards to board slides 11.
- Click retention as an external variable the team does not control. Pew's finding that 18% of Google searches produced an AI summary in March 2025, and that traditional-link clicks fell to 8% when one appeared, is not a marketing failure but a change in the operating environment 2. Executives accept environmental variables when they are quantified.
- The keep/cut/consolidate rule itself. A rule that removes editorial preference from the decision makes the portfolio auditable in the same way a sales pipeline is auditable.
One caution matters. Search remains the demand backbone for most B2B categories, and Google's own research shows search sits inside 70% of consumer journeys 3. Cutting production capacity should never mean abandoning organic. The portfolio shrinks or shifts; it does not close. That distinction is what turns a defensive review into a funding conversation about where the next quarter's capacity goes.
What to do this quarter
The next 90 days do not require a new tool purchase or a rewrite of the content calendar. They require the audit sheet to exist and the scoring model to run against every query the team already owns.
- Week one through three: build the query-to-page map for the top 200 ranked keywords in Search Console, score each on the five-tier scale, and flag SERP retention by checking whether an AI Overview renders on a desktop query in an incognito session.
- Week four through six: wire the GA4-to-CRM chain if it is not already wired, then pull closed-won revenue by organic first-touch URL across the last two sales cycles.
- Week seven through nine: apply the keep, cut, or consolidate rule row by row. Expect 20% to 35% of the ranked portfolio to fail the keep threshold. That freed capacity is the budget for the next quarter's Tier 4 and Tier 5 briefs.
- Week ten through twelve: present the audit sheet in the next revenue review with pipeline contribution rate as the header metric 11. The portfolio decision follows the arithmetic, and the arithmetic gets rerun every quarter.
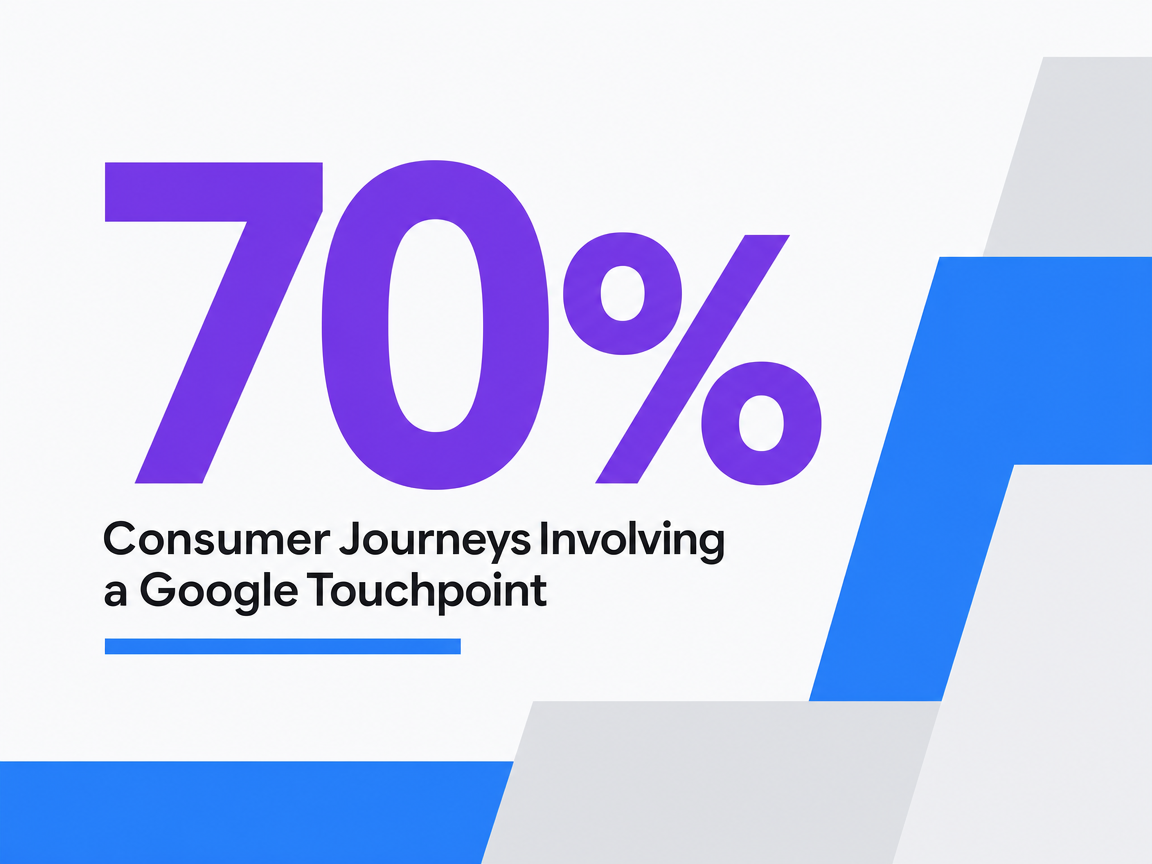 Consumer Journeys Involving a Google Touchpoint
Consumer Journeys Involving a Google Touchpoint
Frequently Asked Questions
References
- 1.Creating Helpful, Reliable, People-First Content.
- 2.Do people click on links in Google AI summaries?.
- 3.70% of all consumer journeys involve a Google touchpoint such as Search, YouTube, or Maps.
- 4.Innovative new research sheds light on Search’s role in consumer journey.
- 5.Beyond last click: Understanding your consumers' online path to purchase.
- 6.Main findings.
- 7.Search Engines.
- 8.Search Engine Users.
- 9.Search Engine Optimization (SEO) Starter Guide.
- 10.Connect with customers to drive profits.
- 11.B2B Marketing Metrics: What They Are, How to Measure Them ....