
Key Takeaways
- Ranking reports no longer close the loop with CFOs; a two-layer model separating traditional GSC diagnostics from AI answer metrics like citation share, prompt coverage, source inclusion, and sentiment is what defends the retainer.
- Share of voice holds up under finance scrutiny only when built on a frozen, revenue-linked keyword corpus with transparent volume and CTR weighting, reported separately for SERP visibility and AI citation share.
- Attribution splits into hard signals—self-reported AI discovery on lead forms and GA4 AI referral channels—that feed the ROI formula, and directional indicators like branded search lift and citation rate labeled as leading signals.
- Scaling the tracker across a book of accounts, especially multi-location DSOs and franchises, requires an approval-first operating model where repeatable pulls and classifications run automatically and analysts inherit only judgment work.
The QBR Problem: When Ranking Reports Stop Persuading CFOs
A client CFO opens the quarterly business review deck, sees a slide showing average position moved from 7.2 to 4.8, and asks the question that ends the meeting early: what did that buy us? The Head of SEO reaches for click growth. The click line is flat. Impressions are up. Answer inclusions in AI Overviews are up. Revenue attributed to organic is ambiguous. The ranking report, once the centerpiece of the retainer conversation, no longer closes the loop.
That gap is where the AI search visibility tracker earns its budget line. Google Search Console now exposes generative AI impressions and page-level participation as a first-class metric, but has not defined how those impressions translate to downstream clicks or conversions 3. Agencies that keep reporting position and clicks as if AI Overviews did not exist are answering a question the CFO stopped asking.
The zero-click environment shifts the burden of proof. Visibility-first measurement, including impressions, answer inclusion, and share of voice across prompt sets, has to carry weight even when the click line stays flat 12. And SEO ROI still resolves to a formula the finance team recognizes: revenue attributed to SEO minus SEO cost, divided by SEO cost 10. The visibility tracker's job is to feed that formula with signals defensible enough to survive the CFO's next question.
The rest of this article lays out how to build one that does: a two-layer measurement model, share of voice math that holds up under scrutiny, a hard-versus-directional attribution framework, and an operating model that scales the work across a book of accounts without adding analysts.
The Two-Layer Visibility Model
Traditional Layer: The GSC Diagnostic Chain
The traditional layer runs on four metrics from Search Console, and they only report a coherent story when read as a chain, not a scoreboard. Impressions measure coverage: how often Google served one of the site's URLs in results. Clicks measure response. CTR captures the ratio of the two and functions as a snippet-quality signal, not a traffic signal. Average position locates where those impressions appeared, which sets the realistic ceiling for any CTR benchmark comparison 14.
Read in that order, the chain diagnoses where a client is losing money:
- Low impressions on commercial queries means the coverage problem sits upstream in indexing, topical depth, or entity signals.
- Strong impressions with weak CTR at a competitive position points to the SERP snippet, not the ranking.
- Strong CTR at position eight means the ceiling is the constraint, and additional CTR optimization returns little without a ranking improvement.
Agencies pipe this data through the Search Analytics API using the searchanalytics.query() method, which exposes clicks, impressions, CTR, and position across dimensions like date, query, page, country, and device 1. For multi-client dashboards, the pull runs one day at a time with pagination and grouping decisions made deliberately, because dimension choices affect completeness 2.
The reframe matters for QBRs. When CTR drops but position holds, the tracker should route the client conversation to snippet testing and structured data, not to a ranking sprint. When impressions climb but clicks do not, the diagnostic is AI Overview compression or SERP feature crowding, not underperforming content. The four metrics stop being a report card and start being a decision tree the Head of SEO can defend line by line.
AI Answer Layer: Citation Share, Prompt Coverage, Source Inclusion, Sentiment
The AI answer layer sits on a different substrate. Rankings do not exist. There is no position four. What exists is a prompt set, a set of AI-generated responses, and a question of whether the client's brand or URLs appear inside them. Four metrics carry the layer: citation share of voice, prompt coverage, source URL inclusion, and sentiment 16.
Citation share of voice : Measures the fraction of AI-generated answers, across a defined prompt set, where the client is cited or mentioned relative to competitors.
Prompt coverage : Measures how many prompts in the corpus return any brand presence at all, which is the AI-era analog of indexed coverage.
Source URL inclusion : Tracks which specific pages get cited, giving the content team a direct line back to what earned the citation.
Sentiment : Classifies whether the mention frames the brand favorably, neutrally, or negatively, which matters more in AI answers than in blue-link SERPs because the model editorializes.
Google's June 2026 release of generative AI performance reports inside Search Console added a native impressions dimension for AI features: how often URLs from the site appeared in generative AI experiences in Search and Discover, broken down by page, country, and device 3. The tracker's AI layer should ingest that impressions data as a first-class field and pair it with citation-share tracking pulled from prompt monitoring across ChatGPT, Perplexity, Gemini, and Copilot 8.
In a zero-click environment, this layer earns its keep by valuing presence in AI answers even when the click line stays flat 12. The visibility-first argument is not that clicks stopped mattering. It is that being cited by the answer is now a measurable outcome, not a proxy for one.
Why Blending the Two Into One Number Fails
The temptation, once both layers are running, is to fuse them into a single visibility score for the client dashboard. That move breaks the tracker's credibility for a specific reason: SERP visibility and LLM answer inclusion behave differently on user behavior and conversion paths, and equating them in one blended metric is a disputed methodology 8.
A position-three ranking on a high-intent commercial query still drives clicks that hit a booking page. A citation in a ChatGPT answer for the same query may deliver zero direct sessions but shift branded search volume two weeks later. Averaging those into a single number obscures which lever the agency is pulling and which one is actually moving revenue.
Keep the layers separate on the dashboard. Report traditional visibility against the GSC diagnostic chain and share of voice against the weighted keyword corpus. Report AI visibility against citation share, prompt coverage, source URL inclusion, and sentiment. Let each layer feed the revenue attribution model on its own terms. The next section handles the share of voice math that makes the traditional layer defensible under CFO questioning.
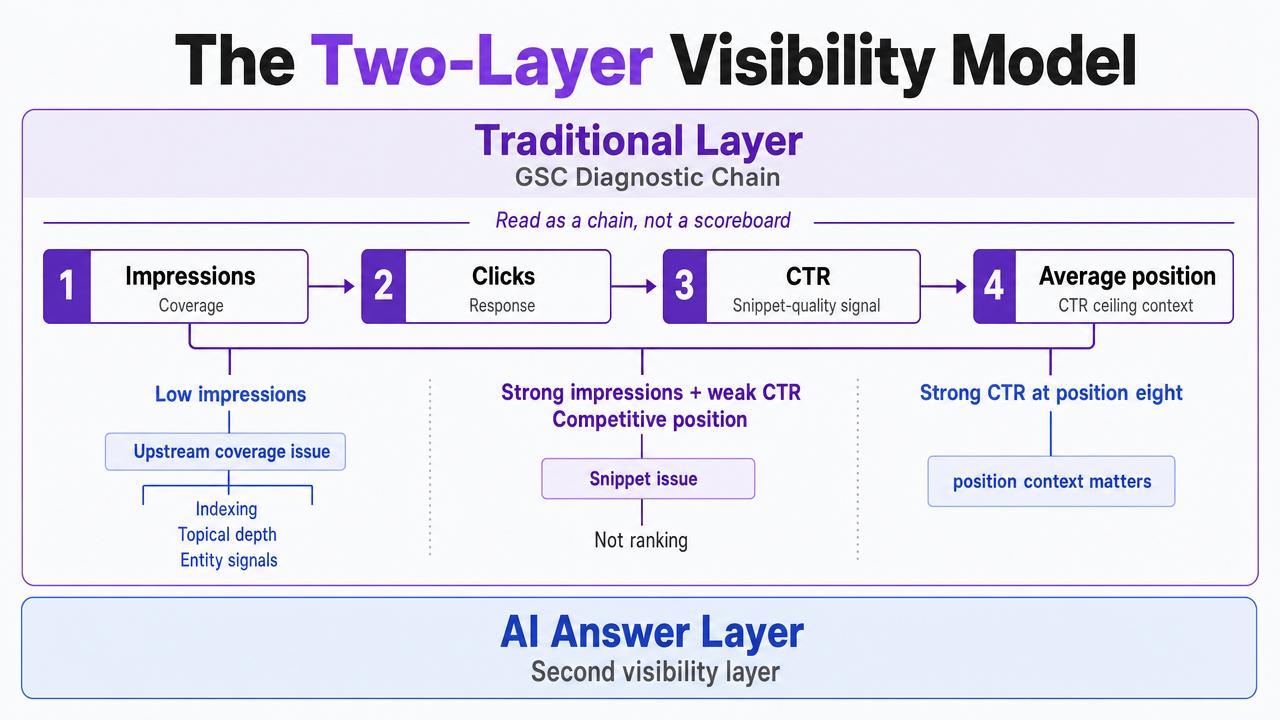 Visualize the two-layer measurement framework (Traditional GSC layer vs AI Answer layer) that structures the entire article's methodology
Building Share of Voice That Survives Client Scrutiny
Share of voice becomes indefensible the moment a client asks how it was calculated and the answer is a vendor's proprietary index. The math that holds up under CFO questioning is transparent and reproducible: a fixed keyword corpus, weighted by search volume and a CTR curve, with each competitor's estimated visibility divided by the total available visibility in the set 5. That construction gives what Metabase calls
"the closest thing SEO has to a market share,"
and it can be rebuilt from raw rank data in a warehouse without depending on a black-box score 5.
Keyword corpus construction is where most trackers quietly fail. A corpus built from a client's current rankings biases toward terms already won and hides coverage gaps. The corpus that survives scrutiny is built from revenue-linked query intent: commercial and informational clusters tied to services the client actually sells, sourced from CRM data where possible 6. Two hundred to two thousand keywords per client is a defensible range for service businesses; the exact size matters less than the discipline of freezing the set for a reporting period so quarter-over-quarter comparisons stay honest.
Weighting is the second defensibility question. Rankings alone overweight low-volume terms. Estimated clicks (impressions × CTR curve) understate visibility on queries where AI Overviews compress the click, but overweight top-of-funnel awareness terms if impressions alone are used. Search Engine Land's guidance is to weigh keywords by search volume and expected click potential, then divide estimated traffic by total possible monthly traffic across the competitive set 4. The tracker should expose both an impression-weighted SoV and a click-weighted SoV rather than blending them, because they answer different questions: exposure versus captured demand 6.
Two disclosures belong on the SoV slide itself. First, CTR curves used in weighting are usually pulled from global benchmarks and can misrepresent client-specific SERPs in vertical categories like legal or dental 7. Where the client's own Search Console CTR data is dense enough, the tracker should substitute it. Second, share of voice on the traditional layer measures SERP visibility only; AI answer inclusion is tracked separately on the AI layer and reported as citation share of voice, not folded into a blended number 8. Naming those two limits on the report itself is what turns SoV from a marketing metric into one a finance team accepts.
Test AI-driven visibility tracking on live campaigns
Measure actual search visibility impact across client projects with full publishing access during your trial.
From Visibility to Revenue: Hard Signals vs. Directional Indicators
Every visibility metric on the dashboard has to answer one question before it belongs in the ROI model: how directly does it prove a lead or a dollar? A practical AI visibility ROI framework sorts signals into two tiers, and conflating them is the fastest way to lose a client's finance team 11.
The hardest data sits in two places:
- First, a lead form field that asks how the prospect heard about the client, with an explicit "AI assistant like ChatGPT, Perplexity, or Google AI Overviews" option. Self-reported AI discovery on that form is the closest thing agencies get to first-party attribution for AI answer inclusion 11.
- Second, GA4 custom channel groupings that classify referral sessions from known AI domains as an AI referral channel, separating them from generic direct or referral traffic 11.
Both signals are traceable to a session or a lead record. Both hold up in a QBR because the finance team can join them to CRM data on their own.
Directional indicators sit one layer out. Branded search lift shows whether AI citations are moving people to type the client's name into Google two weeks later. Citation rate, pulled from prompt monitoring across the AI answer layer, shows whether the client is gaining or losing share of mentions in the prompt corpus 11. Neither ties cleanly to a specific lead, but both move measurably when AI visibility work lands. A stat-comparison view separating self-reported AI discovery and GA4 AI referral sessions on the hard-signal side from branded search lift and citation rate on the directional side gives the Head of SEO a defensible artifact to walk through in the QBR without overstating precision.
The rule for the revenue slide is simple. Hard signals feed the SEO ROI formula—revenue attributed to SEO minus SEO cost, divided by SEO cost 10—as line-item inputs. Directional indicators are reported alongside as leading signals that predict where hard-signal volume will move in the next two quarters. Labeling each metric with its tier on the dashboard itself prevents the mid-QBR moment where the CFO asks whether citation rate is a revenue number. It is not. Saying so on the slide is what buys credibility for the numbers that are.
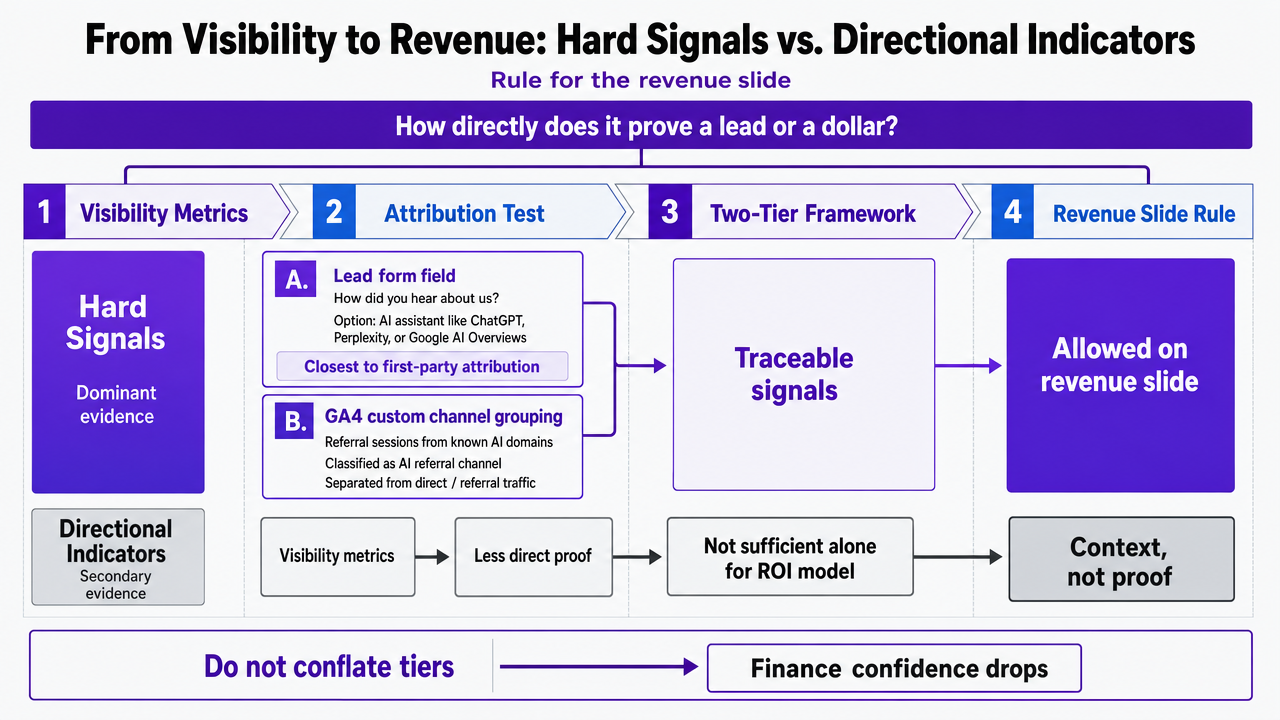 Show the two-tier attribution framework (hard signals vs directional indicators) explicitly described in the section as the rule for the revenue slide
The Honesty Section: Sampling, Row Limits, and Query Anonymization
Every visibility number on a client dashboard carries precision limits that the tracker either discloses or hides. Hiding them is the shorter path to a lost account when a client's in-house analyst reconciles GSC to GA4 and finds the totals disagree. The Search Analytics API exposes a maximum of 50,000 rows per day per search type, sorted by clicks, which means long-tail query data below that cutoff never enters the export 2. Agencies pulling multi-client data through searchanalytics.query() operate inside that ceiling whether they acknowledge it or not 1.
Query anonymization compounds the gap. Google withholds queries that are rare or contain personal information, and those omitted rows still contribute to aggregate impression and click totals in the UI—which is why API exports and interface totals often disagree 13. Grouping choices matter too: pulling data by page and query simultaneously produces more granular slices, but Google's system may drop some data to protect user privacy, so a granular pull will undercount a broader one 2.
Two disclosures belong on the tracker itself, not buried in an appendix. First, that GSC visibility totals reflect sampling and anonymization and are directionally accurate rather than exact. Second, that quarter-over-quarter comparisons use the same dimension groupings and date logic each period so the sampling behavior stays consistent. Surfacing those limits pre-empts the reconciliation conversation and reframes the tracker as a rigorous instrument, not a marketing artifact.
Tracking Volatility Around Algorithm Events
Core updates redraw the visibility floor overnight, and a tracker that treats impression swings as normal noise will miss the client conversation the swing requires. The March 2024 core update, paired with new spam policies, was engineered to reduce unhelpful content in results by roughly 40 percent, which produced sharp movement in impressions and clicks across sites that had scaled thin or AI-generated content without editorial guardrails 17.
The tracker's job during an event window is to isolate the algorithm signal from everything else moving on the client's site. That means holding the keyword corpus and dimension groupings fixed, annotating the timeline with the update's rollout dates, and separating impression volatility by page cluster so the Head of SEO can point to which sections of the site absorbed the change. Commercial pages moving differently from informational clusters is diagnostic; a uniform drop points to sitewide quality signals.
Reporting the volatility, rather than smoothing it out of the quarterly view, is what turns an unwelcome slide into a defensible client conversation about content quality and remediation priority.
See Real-Time Search Visibility Gains—Quantified by AI
Request a walkthrough of AI-powered search visibility tracking built for agencies managing multi-client portfolios. Get granular, client-level reporting and actionable benchmarks to demonstrate measurable SEO impact—without adding analyst hours.
The Analyst-Hours Problem: Scaling Tracker Operations Across a Book
Manual vs. AI-Coordinated Tracker Maintenance
The two-layer model works on paper. It breaks on a Head of SEO's calendar when a single analyst is expected to maintain it across 30 accounts. Every week the tracker requires:
- a GSC pull through
searchanalytics.query()with pagination logic that respects the 50,000-row daily ceiling 1, 2, - a rank refresh against the frozen keyword corpus,
- a prompt-monitoring run across ChatGPT, Perplexity, Gemini, and Copilot 8,
- a citation-share reconciliation against competitor mentions,
- a GA4 channel-grouping check for AI referral sessions 11,
- and a sentiment classification pass on the new mentions surfaced that week.
Done manually, that workload runs roughly six to twelve analyst hours per client per month once QBR narrative construction, dashboard QA, and algorithm-event annotations are folded in. At a blended senior analyst rate, the margin math turns hostile above 15 accounts per analyst. The tracker that was supposed to prove the retainer's value starts consuming it.
The AI-coordinated version compresses the same workload by handling the repeatable steps automatically and routing exceptions to human review. The data pulls, corpus refreshes, citation classifications, and dashboard updates run on schedule. The analyst inherits the parts of the job that actually require judgment: interpreting a volatility spike after a core update 17, deciding whether a citation-share drop in one prompt cluster warrants a content brief, and shaping the QBR narrative around what the numbers mean for the client's pipeline.
| Task | Manual (hrs/client/mo) | AI-coordinated (hrs/client/mo) |
|---|---|---|
| GSC pulls & reconciliation | 1.5–2.5 | 0.1–0.3 |
| Prompt monitoring & citation SoV | 2.0–3.5 | 0.2–0.5 |
| Corpus refresh & SoV math | 1.0–2.0 | 0.1–0.3 |
| Dashboard QA & QBR narrative | 1.5–3.0 | 0.8–1.5 |
| Total | 6.0–11.0 | 1.2–2.6 |
Cost per client per month resolves to analyst blended rate multiplied by hours. The variable that actually moves is how many accounts one Head of SEO can supervise without the tracker degrading into a screenshot exercise.
If You Manage Multi-Location Accounts: The DSO and Franchise Math
For agencies serving DSOs, multi-location dental groups, franchise home services brands, and behavioral health networks, the math changes before the tracker even starts. A 40-location DSO is not one account. It is 40 keyword corpora, 40 local prompt sets, 40 GA4 property configurations, and 40 sets of citation-share benchmarks against locally competing practices. Applying the per-client hour estimates from the prior section to a per-location basis makes the manual model economically indefensible above roughly a dozen locations under one retainer.
Budget is arriving to solve the problem. Annual investment in AI-powered SEO and visibility software by DSOs and multi-location health groups is projected to rise from $0.45 billion in 2024 to $2.1 billion in 2028, a CAGR of 46.8 percent 16. That capital is not chasing another rank-tracking dashboard. It is chasing per-location visibility measurement that a regional director can act on Monday morning without waiting for an agency slide deck.
The tracker built for this reader has to do three things the single-brand version does not:
- Roll up per-location visibility to the parent brand while preserving the location-level slice, because a regional VP will ask why Location 17 lost citation share in Perplexity while Locations 18 through 22 gained.
- Weight the keyword corpus against locally relevant volume rather than national volume, because a DSO's revenue does not care about national search totals.
- Expose per-location share of voice against local competitors, not the parent brand's national competitor set 5.
The agency that wins the multi-location retention battle is the one whose cost curve per additional location stays flat. That is an operations problem before it is a reporting problem.
The Delivery Model Shift Heads of SEO Should Plan For
The tracker is not the deliverable. The tracker is the artifact that reveals which delivery model an agency can actually afford to run. Enterprise adoption of AI visibility management tools is projected to climb from 18 percent in 2024 to 65 percent in 2027, a CAGR of 54.3 percent 16. That curve is not about clients buying dashboards. It is about the operating cost of proving value at the pace AI search now demands, and the agencies still routing every GSC pull and prompt-monitoring run through analyst calendars are the ones losing accounts to competitors who have moved the repeatable work off human hands.
Two changes to the retainer show up first. The reporting cadence compresses from monthly to continuous, because AI answer inclusion shifts on a rolling basis and clients notice a citation-share drop in Perplexity before the next scheduled QBR. And the scope of the tracker widens without adding hours, because the AI answer layer, the traditional layer, and the revenue attribution model each need their own live surface 11, 16. The Head of SEO who plans for that shift now defines the workflow: what runs automatically, what routes to human review, what triggers a client conversation. The Head of SEO who postpones it inherits whatever workflow the platform vendors ship by default.
The delivery model that scales is approval-first. Data pulls, corpus refreshes, citation classifications, and dashboard updates run on schedule. The Head of SEO reviews the exceptions, approves the client-facing narrative, and signs off on remediation briefs before anything ships. Platforms like Vectoron are built on that pattern, but the pattern matters more than any specific tool: the analyst hours saved on repeatable measurement work redirect to strategy, client conversations, and the judgment calls the tracker surfaces but cannot resolve. That reallocation is what keeps the retainer defensible when the CFO opens next quarter's deck.
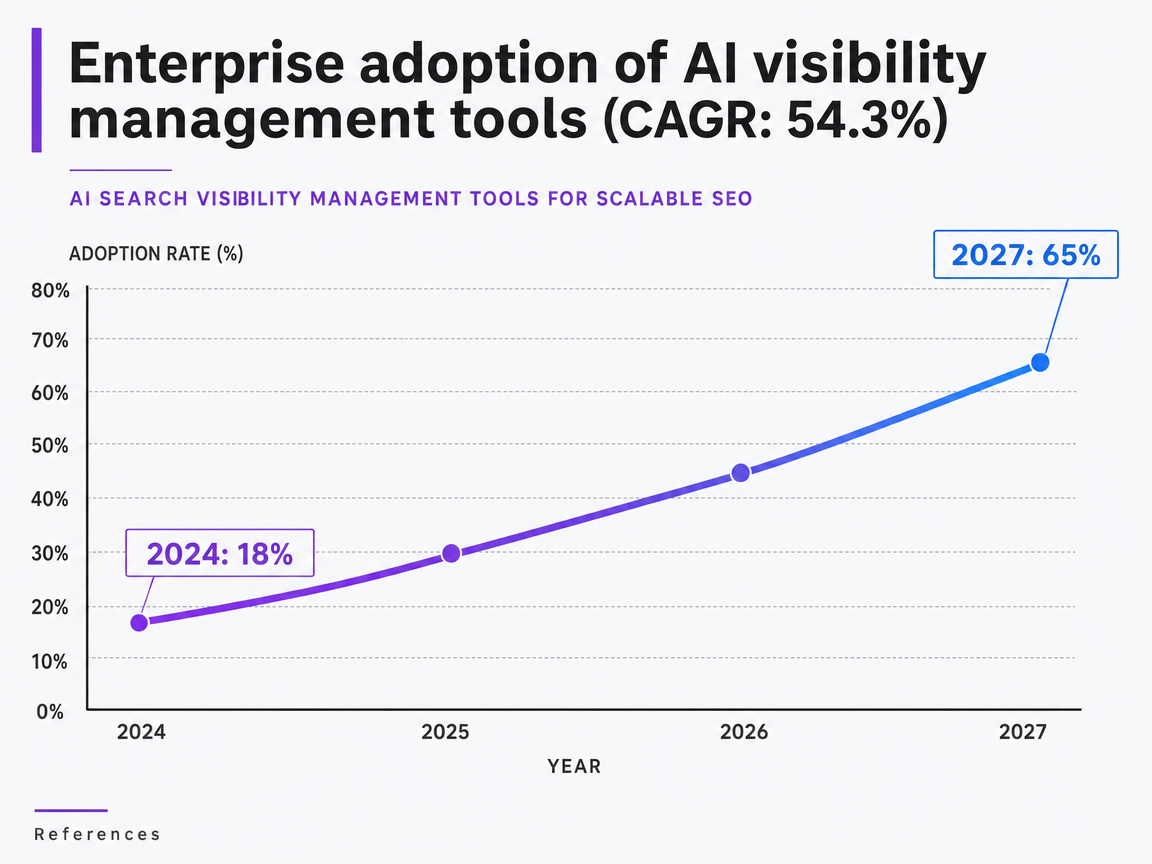 Enterprise adoption of AI visibility management tools (CAGR: 54.3%)
Source: AI Search Visibility Management Tools for Scalable SEO
Frequently Asked Questions
References
- 1.Query your Google Search analytics data | Search Console API How-To.
- 2.Getting your performance data | Search Console API.
- 3.Introducing Search Generative AI performance reports in Search Console.
- 4.What Is Share of Voice? Measure Visibility & Outrank Rivals.
- 5.Share of Voice: Definition, SQL & How to Track It in Metabase.
- 6.Share of Voice - SEO Visibility & Competitor Benchmarking - SEOJuice.
- 7.What is Share of Voice in SEO? The 2026 Guide to Measuring ....
- 8.SEO & LLM Share of Voice: Your Complete Guide to Digital ....
- 9.Share of voice definition: How to measure it.
- 10.How to Measure SEO ROI for Clients: Rankings to Revenue.
- 11.How to Measure AI Visibility ROI: A Practical Framework.
- 12.Measuring zero-click search: Visibility-first SEO for AI results.
- 13.A deep dive into Search Console performance data filtering and limits.
- 14.GSC Performance Report & Search Analytics (2026).
- 15.Google Search Console Guide for Publishers: Traffic, Indexing, and Ad Revenue.
- 16.AI Search Visibility Management Tools for Scalable SEO.
- 17.Understanding the March 2024 core update and new spam policies.