
Key Takeaways
- Rank tracking no longer explains client value because AI Overviews cut organic CTR from 3.97% to 0.64%, breaking the link between rankings, impressions, and the clicks that justify a retainer 3.
- A defensible ROI model runs three layers: citation share movement inside AI answers, assisted-session lift correlated with branded traffic, and pipeline contribution built on the client's own lead economics 8.
- Agency-fit evaluation depends on multi-client architecture, white-label export, analyst-hours-per-account compression, and NIST-aligned governance artifacts vendors can actually produce on request 10.
- Citation-share monitors cover Layer 1 well but leave assisted-session and pipeline evidence for the analyst to assemble, which is where hidden labor cost accumulates across a 40-account portfolio 4.
- Answer-engine trackers add Layer 2 correlation between citation movement and the impressions-up/clicks-down curve, but pipeline contribution still has to be modeled inside the agency's warehouse 3.
- Execution platforms with visibility layers collapse measurement and production into one workflow, bending portfolio economics when they match monitor-grade query-cluster granularity and export cleanly for Layer 3 modeling.
- Portfolio economics turn on analyst hours per client per month, and consolidation only pays off when hours fall without QBR output quality falling with them.
- Click-loss figures vary widely across studies, from a 20–42% range in one user survey to roughly 70% in some CTR cuts, so client exposure must be modeled against their own query mix 1, 5.
- The QBR narrative that survives CFO scrutiny sequences citation-share movement, correlated assisted-session lift with a stated attribution window, then pipeline math using the client's own conversion rate and deal value 8.
Why Rank Tracking Stopped Explaining Client Value
The reporting gap agency leaders are quietly absorbing shows up in a single Similarweb comparison: average organic click-through rate on queries without an AI Overview sits at 3.97%, but drops to 0.64% once an AI Overview appears above the results 3. Rankings often hold. Impressions climb. The clicks that used to justify a retainer stop arriving.
BrightEdge data from the same analysis captures the mismatch in year-over-year terms: impressions up roughly 49%, organic clicks down about 30% 3. A Head of SEO running 40 accounts now walks into QBRs where the rank tracker still shows green, Google Search Console shows more impressions than last quarter, and the client's revenue team is asking why sessions are flat or falling. The dashboard tells a story the P&L contradicts.
Behavioral data from Pew Research adds the demand-side view. Roughly 18% of Google searches in March 2025 surfaced an AI summary, and users clicked a traditional result in only 8% of those searches versus 15% when no summary appeared 9. Clicks to cited sources inside the summary occurred in about 1% of visits. The traffic did not vanish; the interface reallocated attention before the SERP could earn a click.
That reallocation is the reason LLM visibility analysis software exists as a category. Rank tracking measures a position on a page that increasingly is not the page the user reads. Citation share, mention rate inside answer engines, and assisted-session attribution measure what actually happens between query and pipeline. The rest of this shortlist evaluates which tools produce that evidence in a form a client's CFO will accept.
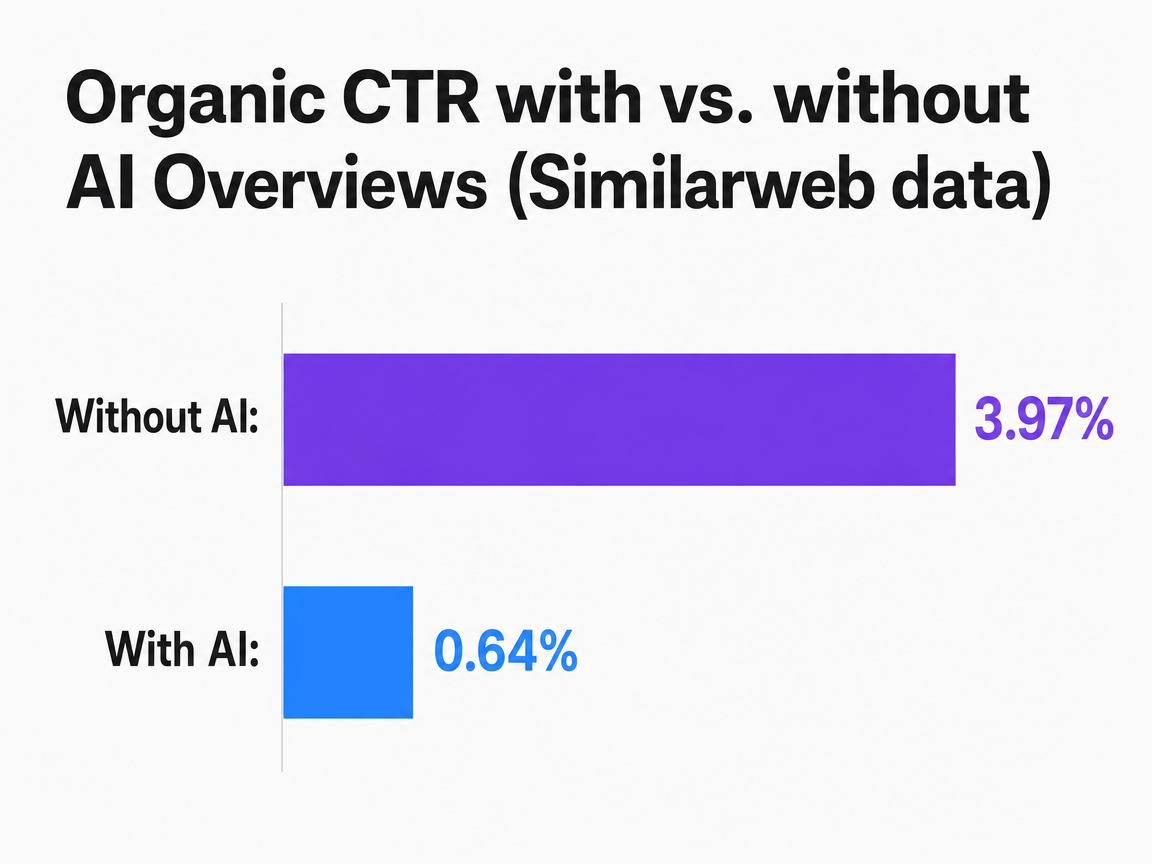 Organic CTR with vs. without AI Overviews (Similarweb data)
Comparison of average organic click-through rates for search queries with and without a Google AI Overview, based on Similarweb data.
The Three-Layer ROI Model This Shortlist Is Scored Against
Layer 1: Citation Share Movement
Citation share is the percentage of tracked queries where a client's domain appears inside an AI answer, whether that is a Google AI Overview, a ChatGPT response, a Gemini summary, or a Perplexity citation block. It is the closest AI-era analog to keyword rank, and it is the first metric a visibility tool needs to produce reliably at the account, cluster, and query level.
The economic case for tracking it comes from Seer Interactive's analysis of AI Overviews: brands cited inside the overview earn roughly 35% more organic clicks than uncited peers holding comparable positions, and cited advertisers pick up about 91% more paid clicks in the same query set 4. The delta is large enough that citation status now behaves like a distinct ranking factor with its own click economy.
For a Head of SEO, Layer 1 answers a specific client question: is the brand gaining or losing ground inside the answer surface itself? A tool that cannot report citation share by query cluster and track its movement week over week fails this layer regardless of what else it does well.
Layer 2: Assisted-Session Lift
Citation share explains presence. It does not explain what happens next. Layer 2 measures whether users who see a brand cited inside an AI answer eventually arrive on the client's site through a downstream session, whether that session is direct, branded organic, or a later non-branded return visit.
The behavioral case for isolating this layer is that click-through from AI surfaces is thin but not zero. Users click through to a cited source in roughly 1% of AI summary searches, compared to a traditional-result click rate of 8% inside those same summary sessions 9. Direct clicks understate the value; assisted sessions capture the branded return traffic that citation exposure quietly builds.
Credible LLM visibility platforms model this by correlating citation-share deltas with subsequent shifts in branded search volume, direct traffic, and multi-touch attributed sessions inside GA4 or the agency's warehouse. The output an agency needs is a defensible statement of the form: citation share in cluster X rose 14 points, and branded sessions from that cluster's topic set lifted 9% over the following four weeks.
Layer 3: Pipeline Contribution and the Forrester Caveat
Layer 3 is where the QBR either holds or falls apart. The Head of SEO has to convert citation share and assisted-session lift into a pipeline number the client's finance team can reconcile against booked revenue, qualified leads, or cost per acquisition. Anything less specific gets dismissed as vanity reporting.
The Forrester composite ROI model, referenced at 611% on a modeled SEO program, illustrates the shape of the argument: incremental sessions are converted at the client's known lead-to-close rate, multiplied by average deal value, and net of program cost 8. The framework transfers to LLM visibility work, but only when it is rebuilt on the specific client's lead economics rather than borrowed as a headline.
Tools that produce Layer 3 evidence expose the assumptions: conversion rate applied, deal value used, attribution window, and the share of pipeline credited to assisted versus last-click sessions. Tools that skip the assumptions and print a single ROI figure fail the CFO test. The rest of this shortlist evaluates each category against whether it can populate all three layers or only the first one.
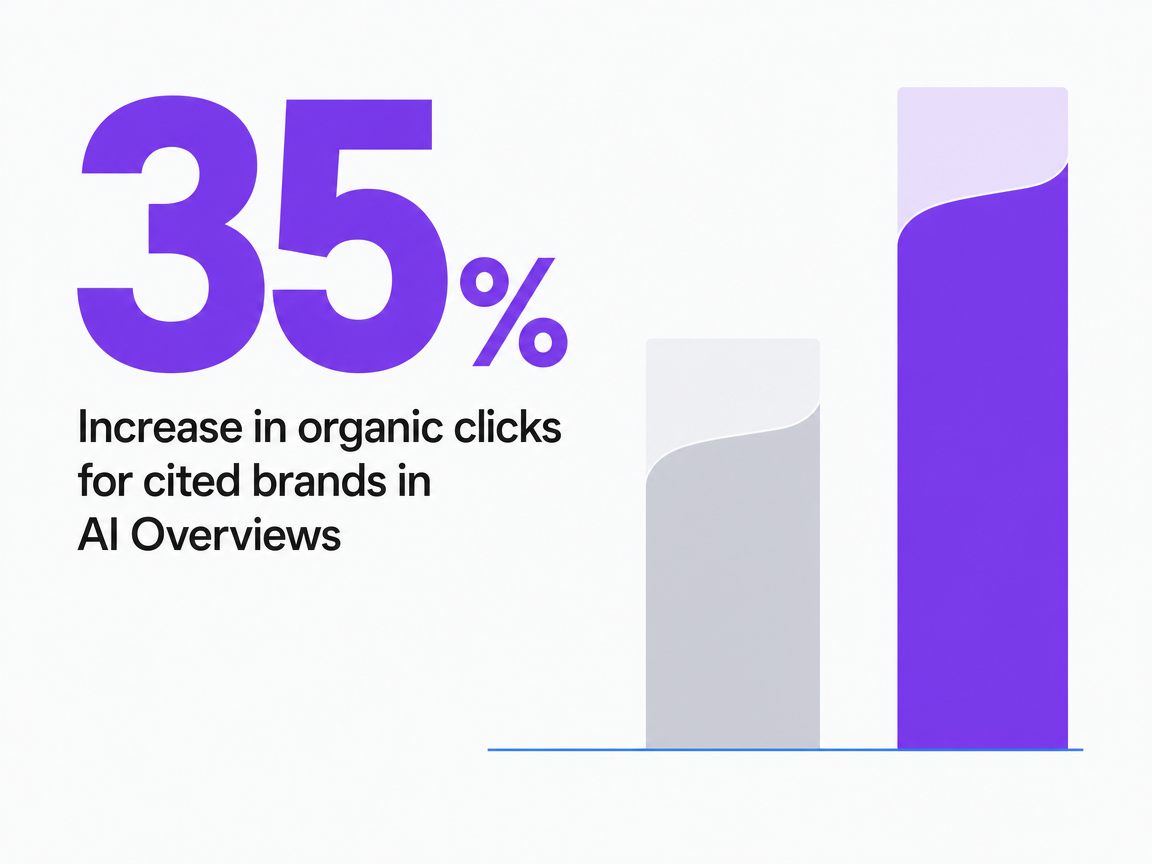 Increase in organic clicks for cited brands in AI Overviews
Increase in organic clicks for cited brands in AI Overviews
Evaluation Criteria Built for Agency Delivery
Multi-Client Architecture and White-Label Reporting
A visibility tool that ships with a single-workspace design forces the Head of SEO to reconstruct account boundaries every time an analyst opens the platform. That is not a small annoyance at 40 clients; it is the difference between a two-hour QBR prep and a two-day one. The first evaluation gate is whether the tool models an agency portfolio natively: parent-child workspaces, role-based access per client, tag inheritance across query sets, and export permissions that respect client data boundaries.
White-label output is the second gate. Citation-share deltas, assisted-session correlations, and cluster-level movement need to leave the platform as branded PDFs, Looker Studio connectors, or warehouse tables the agency already reports from. A tool that only renders inside its own dashboard adds a manual transcription step to every client review. Agencies scaling AI-era SEO reporting cannot absorb that step at portfolio volume, especially as citation tracking becomes a standard monthly reporting element alongside rank and impressions 4.
Analyst Hours Per Account and QBR Fit
The second criterion is measured in labor, not features. A credible LLM visibility platform should compress, not expand, the analyst hours required per client per month. Query set configuration, prompt library maintenance, and citation-share pull cycles all consume time; if the tool needs manual re-prompting across ChatGPT, Gemini, Perplexity, and Google AI Overviews on a weekly cadence, the analyst hour count balloons before any narrative work begins.
QBR fit is the second half of this criterion. The output must map cleanly onto the three-layer ROI structure a client CFO will accept: citation-share movement by cluster, correlated shifts in branded and assisted sessions, and a pipeline contribution figure built on the client's own conversion economics rather than a headline composite 8. Tools that require an analyst to reformat exports into a client-safe narrative every quarter are dashboards, not reporting systems. Agency leaders evaluating the category should run a timed pilot: measure hours-to-QBR-ready-output on a live account, not on the vendor's demo dataset.
Governance, TEVV, and What to Demand From Vendors
The third criterion sits outside the marketing stack and inside the client's risk register. Agencies handling client data through AI-driven measurement tools inherit the governance expectations that apply to any AI system in production. The NIST AI Risk Management Framework organizes those expectations into four functions—GOVERN, MAP, MEASURE, and MANAGE—and treats them as the baseline for responsible AI operations 11.
The companion Playbook translates that framework into operational actions: testing, evaluation, verification, and validation (TEVV), continuous monitoring, documented risk tolerances, and versioned records of model behavior 10. Applied to visibility vendors, the checklist is specific. Ask for documented evaluation of citation-detection accuracy, monitoring cadence for prompt drift across answer engines, data-handling documentation for client query sets, and a written statement of how the vendor validates that reported citation share reflects live LLM output. Vendors that cannot produce those artifacts should not hold client data at portfolio scale.
Test LLM visibility analysis on live campaigns
Assess real-time LLM visibility metrics and publish actionable insights directly to client projects during your trial.
The Shortlist, Organized by Stack Layer
Citation-Share Monitors
Citation-share monitors are the narrowest tier and the one most agencies encounter first. Tools in this category—AthenaHQ, Profound, Peec AI, Otterly, and the citation modules bolted onto established SEO suites like Semrush and Ahrefs—run scheduled prompts against ChatGPT, Gemini, Perplexity, and Google AI Overviews, then record whether a client's domain appears in the answer, in what position, and with what surrounding language.
The strength of the tier is depth on Layer 1. A well-configured monitor produces weekly citation-share reports at the query-cluster level, tracks competitor citation frequency inside the same prompts, and flags prompt drift when an answer engine changes its response pattern. That output maps directly onto the economic case for citation status: cited brands earn roughly 35% more organic clicks and 91% more paid clicks than uncited peers on the same query set 4.
The weakness is scope. Most citation monitors stop at presence detection. They do not correlate citation movement with branded search volume, direct traffic, or GA4 session data, which means Layer 2 and Layer 3 evidence has to be assembled by the analyst in a separate warehouse or reporting layer. For an agency running 40 accounts, that gap is where the labor cost hides. The category earns a slot in the stack, but it does not replace the assisted-session and pipeline work a QBR requires.
Answer-Engine Trackers
Answer-engine trackers sit one layer up. Platforms like BrightEdge Generative Parser, seoClarity's AI search module, and the enterprise-tier answer analytics inside Conductor extend citation detection with query-trigger analytics, sentiment scoring on the cited passage, and correlation views that tie citation-share deltas to impressions and clicks pulled from Search Console.
What separates this tier from pure monitors is the reporting geometry. Answer-engine trackers acknowledge that Layer 2 exists. They surface the classic mismatch a Head of SEO now has to explain in every QBR—impressions rising while clicks fall—and let the analyst overlay citation-share movement on top of that curve to see whether AI presence is buffering or accelerating the click loss 3. Some also expose share-of-voice inside the AI answer relative to named competitors, which converts cleanly into a slide a client's marketing lead can defend without a translation layer.
The trade-off is cost and configuration weight. Enterprise answer-engine trackers price against seat count and query volume, and their query-set setup for a 40-client portfolio consumes analyst hours that citation-tier tools do not. They also stop short of Layer 3. Pipeline contribution still has to be modeled in the agency's warehouse using client-specific lead economics, because the trackers do not hold the conversion rates or deal-value assumptions the Forrester-style ROI framework requires 8.
Execution Platforms With Visibility Layers
The third tier collapses measurement and production into one workflow. Platforms in this category—HubSpot's AI content and reporting stack, Conductor when paired with its content operations module, and integrated systems like Vectoron—pair citation-share tracking and assisted-session correlation with the content, briefs, and publishing cadence that respond to what the visibility layer surfaces.
The argument for this tier is throughput. Citation monitors and answer-engine trackers identify the gap; execution platforms close it. When a query cluster loses citation share to a competitor, an integrated system routes the finding to a content brief, produces the draft, runs it through human approval, and publishes on the client's stack without a separate vendor handoff. That compression is what agencies actually buy when they consolidate: fewer briefing cycles per client, fewer status meetings between measurement and production, and a shorter path from insight to shipped work.
The trade-off is category maturity. Execution platforms with visibility layers are newer than dedicated monitors, and their citation-detection depth varies. Agency leaders evaluating this tier should pressure-test whether the visibility layer produces query-cluster granularity comparable to a standalone monitor, whether it exports cleanly into the agency's warehouse for Layer 3 modeling, and whether the production side ships work at a quality bar clients will accept without an internal editorial pass. Where those three answers hold, this tier is where portfolio economics start to bend in the agency's favor 8.
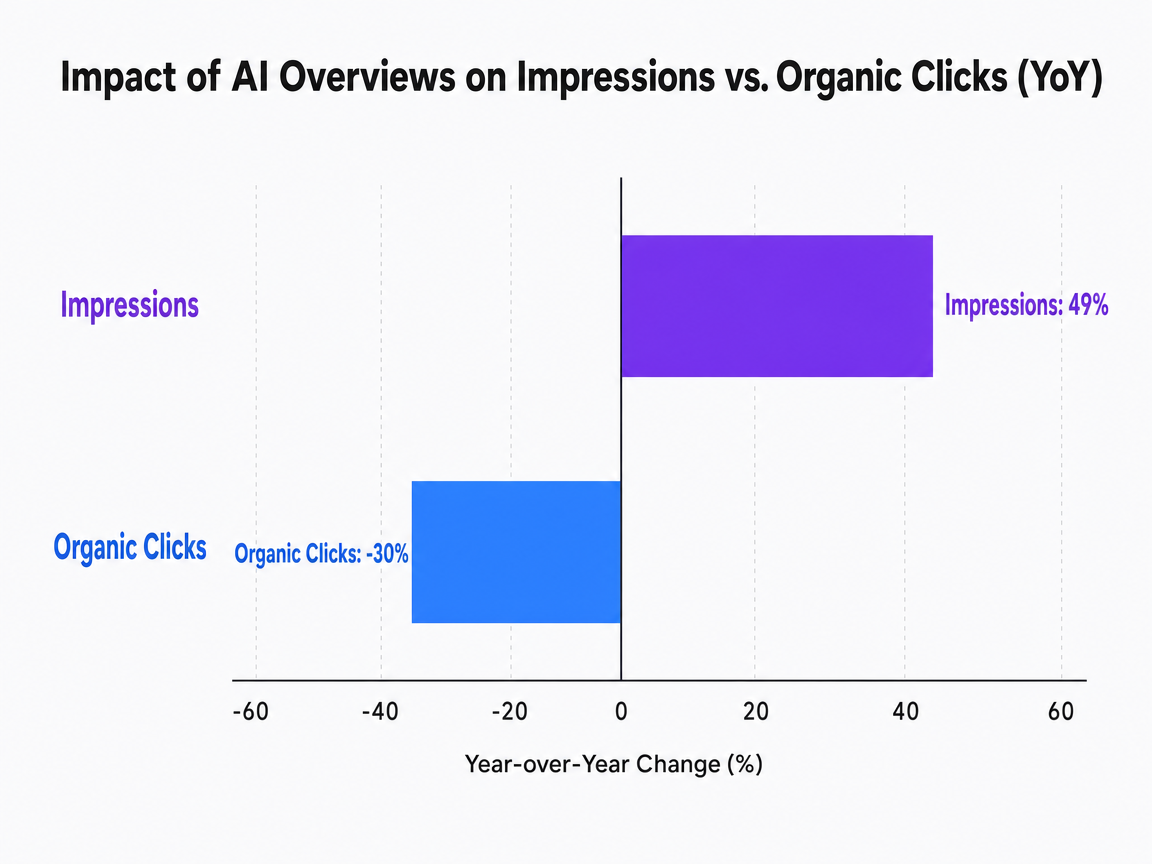 Impact of AI Overviews on Impressions vs. Organic Clicks (YoY)
Year-over-year change in total impressions and total organic clicks after the rollout of AI Overviews, based on BrightEdge data. Shows that visibility (impressions) increased while actual traffic (clicks) decreased.
Agency Portfolio Economics: Where the Hours Actually Go
This section shifts scope. The reader up to here has been a Head of SEO evaluating tools; the next few paragraphs address the same person as a portfolio operator managing 15 to 80 client accounts, where the choice of visibility layer is a labor decision, not a feature preference.
The underlying pressure is measurable. BrightEdge year-over-year data shows impressions climbing roughly 49% while organic clicks fall about 30% after the AI Overviews rollout 3. A traditional rank-tracking retainer priced against clicks now carries a widening gap between what the dashboard shows and what the client's revenue team feels. That gap is absorbed inside analyst hours: extra QBR preparation, deeper GSC forensics, and hand-built narratives explaining why green rankings coexist with flat sessions.
The table below uses variables, not invented dollars. Let H be analyst hours per client per month, R the blended analyst rate, and C the client count carried by one Head of SEO. Monthly delivery cost per client equals H × R; portfolio load equals H × C.
| Delivery model | Analyst hours per client per month (H) | QBR-ready output | Layer 3 modeling location |
|---|---|---|---|
| Rank tracking only | Baseline + 3–5 forensic hours to explain the impressions-up/clicks-down gap | Manual, narrative-heavy | Not produced |
| Rank tracking + dedicated LLM visibility tool | Baseline + 2–4 hours for query-set upkeep, prompt maintenance, and warehouse joins | Semi-automated; citation share exports, pipeline built in warehouse | Agency warehouse using client lead economics |
| Integrated execution platform with visibility layer | Baseline − 1 to − 3 hours as briefing cycles and vendor handoffs collapse into one workflow | Native, cluster-level, exportable | Inside the platform, with assumptions exposed |
The Forrester composite ROI of 611% on a modeled SEO program is instructive here as a framework, not a promise 8. The ratio only holds when incremental sessions are converted at the specific client's lead-to-close rate and priced against that client's deal value. What the table above quantifies is the input side of that equation: the hours a Head of SEO spends producing the evidence a CFO will accept. Portfolio economics bend when H falls without R or output quality falling with it, which is the case a consolidated stack has to prove on a live account, not a demo.
See How Top Agencies Quantify LLM Content Visibility at Scale
Request a walkthrough of AI-powered visibility analysis workflows proven to improve client reporting accuracy and ROI measurement for multi-location and enterprise SEO teams.
One Dataset Is Not a Market: Reading Click-Loss Studies Honestly
The category has a bad habit of quoting a single click-loss figure as if it settles the argument. It does not. A 2024 user study on Google's AI overlays found that 58% of respondents would click links inside SGE responses, 22% might, and 20% would not, putting roughly 20–42% of clicks at risk of being lost depending on how the range is interpreted 1. That is one dataset, drawn from stated behavior on a specific query mix, and it does not generalize evenly across informational, commercial, and branded intent.
The variance across studies makes the point. One analysis of roughly 10,000 informational queries measured organic CTR falling from 1.41% to 0.64% when an AI overview appeared; a separate cut of the data reported CTR dropping from 2.94% to 0.84%, a decline closer to 70% 5. Different query sets, different sectors, different answer engines, different numbers. A Head of SEO who cites the largest available drop as a portfolio-wide loss will lose credibility the first time a client's own GSC export tells a milder story.
The operational takeaway is to treat public click-loss figures as bounding ranges, not point estimates, and to model each client's exposure against that client's own query mix inside the visibility platform.
Building the QBR Narrative That Survives a CFO
The QBR that holds under CFO questioning follows a specific sequence, and the visibility tool has to feed it in that order. Layer 1 opens the slide: citation share moved from X% to Y% inside the client's tracked query clusters, benchmarked against named competitors on the same prompts. That single chart replaces the rank-tracker screenshot that no longer explains the client's session curve.
Layer 2 follows immediately, not later. Citation-share deltas correlate with subsequent shifts in branded search volume, direct traffic, and multi-touch attributed sessions inside GA4. The claim a Head of SEO can defend sounds like this: citation share in the cluster rose 12 points over eight weeks, and branded sessions from that topic set lifted 7% over the following four. The correlation window is stated, the attribution model is named, and the assisted-session count is separated from last-click.
Layer 3 is where the CFO leans forward. Incremental sessions convert at the client's actual lead-to-close rate, priced against the client's actual deal value, net of program cost. The Forrester composite figure of 611% ROI on a modeled SEO program is useful as a framework for how the arithmetic assembles, not as a number to quote back at the client 8. What the slide shows is the client's own conversion rate, the client's own deal size, and the assumption set that produced the pipeline figure.
Two disciplines separate this narrative from the vanity version. The first is exposing bounding ranges rather than point estimates: public click-loss figures span 30–60% in some studies and roughly 70% in others depending on query mix 7, so the client's exposure is modeled against the client's own GSC export, not a headline. The second is naming what the tool cannot see. Assisted sessions that never touch a tracked domain, private LLM conversations, and dark-social sharing sit outside the measurement surface, and the QBR that acknowledges those blind spots earns more credibility than the one that pretends the model is complete.
Frequently Asked Questions
References
- 1.Will People Click Links in Google's AI Overlays? | 2024 User Study.
- 2.How are AI Overviews Impacting Organic Traffic?.
- 3.Impact of Google AI Overviews on Organic SEO Traffic.
- 4.AI Overviews in 13% of Queries: SEO Traffic Impact.
- 5.Google's AI Search and the CTR Shake-Up Across Sectors.
- 6.AI SEO Statistics: 40 Statistics You Should Know for 2026.
- 7.Maximizing Your SGE Click Through Rate.
- 8.Best LLM SEO Tracking Software for Measuring ROI Effectively.
- 9.Do people click on links in Google AI summaries?.
- 10.AI RMF PLAYBOOK.
- 11.Artificial Intelligence Risk Management Framework (AI RMF 1.0).
- 12.AI Risk Management Framework | NIST.