
Key Takeaways
- Dashboard aggregators like Looker Studio and AgencyAnalytics excel at connector breadth but function as display layers, leaving analysts to manually construct the ROI narrative 18.
- SEO-native suites such as Semrush and Ahrefs provide credible page-level diagnostics but typically require pairing with a data warehouse to close the loop to revenue 8.
- Orchestration platforms compress the interval between report delivery and approved work by routing ranked recommendations into client sign-off workflows, directly protecting retainer margin 18.
- Forrester's TEI model grades reporting tools on benefits, costs, and risks tied to business outcomes, replacing feature checklists with a CFO-compatible evaluation rubric 5, 6.
- AI search visibility should be reported as a distribution across queries and sessions, not a single share-of-voice number, since generative outputs vary substantially 10.
- Rank tracking retains diagnostic value but loses evidentiary weight in ROI conversations because rankings are noisy signals that vary across engines and query sets 4, 11.
- Labor cost per account per cycle, calculated as hours multiplied by blended analyst rate, is the operational math that determines whether a reporting stack preserves margin.
- Page-level reporting should tie specific title-tag, keyword, and Core Web Vitals changes to measurable deltas, giving analysts concrete evidence rather than site-wide averages 1, 2.
- Portfolio operators managing 20 to 150 accounts need templating discipline, standardized data trust, and exception routing to identify at-risk accounts without reviewing every deck 7.
- Archetype selection should follow P&L pressure: paid-heavy retainers suit aggregators, technical programs suit SEO-native suites, and margin-eroded portfolios suit orchestration platforms 18.
Why Reporting Software Became a Retention Lever, Not a Dashboard Choice
Agency heads of SEO often face challenges in demonstrating the direct impact of organic search on pipeline growth, leading to potential client churn. While SEO implementation consistently drives gains in organic rankings and traffic, individual campaign variance is high and depends on execution quality 17. This variability makes robust reporting software essential for client retention.
Forrester's Total Economic Impact (TEI) model for SEO emphasizes framing SEO value in terms of benefits, costs, and risks tied to business outcomes, rather than just keyword positions 5, 6. Similarly, The Forrester Wave for SEO Platforms evaluates vendors on their ability to connect SEO performance to revenue, not just visibility 8.
Client services directors managing large portfolios experience margin compression when senior analysts spend excessive time assembling monthly reports instead of focusing on strategy. Reporting labor scales linearly with account count unless software automates the process. This makes tool selection a critical retention factor, influencing how the market archetypes are grouped in this analysis.
The Three Archetypes That Actually Matter
Dashboard Aggregators: Looker Studio, AgencyAnalytics, Databox, Whatagraph
Dashboard aggregators consolidate data from various sources. Tools like Looker Studio connect to platforms such as Search Console, GA4, and Ads. Others, including AgencyAnalytics, Databox, and Whatagraph, offer white-label templates and scheduled reporting, promising comprehensive KPI coverage through various widgets.
However, these aggregators often fall short in providing deep analytical insights. While they can display organic sessions alongside CRM revenue, they do not model causal links. The Forrester Wave for Marketing Measurement and Optimization Solutions highlights that capabilities like incrementality, cross-channel attribution, and actionable insights are crucial and typically reside beyond the connector layer 7. This means analysts still manually construct the narrative, interpreting data points like query-driven conversions or algorithm update impacts.
The primary benefit of aggregators is their broad connector library, allowing agencies to combine diverse data sources like Facebook Ads, HubSpot pipeline, and Search Console into a single report. However, relying on an aggregator as an ROI proof engine is problematic, as it's a display layer, not a measurement tool 18. They serve best as a complement to a core reporting strategy.
SEO-Native Suites with Reporting Layers: Semrush, Ahrefs, seoClarity, STAT
SEO-native suites, such as Semrush, Ahrefs, seoClarity, and STAT, were initially built for practitioners and later integrated client-facing reporting. These tools excel in providing granular data on keywords, backlinks, and technical SEO. For instance, a decision-model study weighted meta tags, keywords, and website design as significant on-page factors influencing ranking outcomes 1. A reporting layer that surfaces changes in these areas offers a defensible link between deliverables and measurable page-level improvements.
While these suites provide credible data for visibility and technical health, they often struggle to close the loop to revenue directly. Although they integrate with GA4 and Search Console, conversion attribution typically relies on the client's analytics stack. The Forrester Wave for SEO Platforms notes that top-scoring platforms push data into CRM and BI systems rather than attempting to be the sole system of record 8. Agencies often pair these suites with a data warehouse or BI layer to bridge the revenue gap, using the suite as the SEO instrument and the warehouse for the ROI narrative.
Orchestration Platforms: Tying Reporting to Approval Workflow
Orchestration platforms view reports as inputs for subsequent work orders, addressing the gap between data insights and actionable responses. While a meta-analysis shows a strong aggregate effect of SEO on rankings and traffic, individual campaign variance necessitates a reporting stack that translates this into a defensible narrative 17.
This archetype facilitates translation by integrating recommendations directly into an approval workflow. For example, a change in non-branded organic traffic might trigger a ranked recommendation for a title-tag rewrite or an internal-link adjustment, with a one-click path to client sign-off and production. Vectoron's evaluation guide highlights this "reporting-to-approval loop" as crucial for retention and margin, emphasizing the speed at which a client moves from seeing data to authorizing work 18.
Vectoron exemplifies this category with its Command Center, which processes live signals, prioritizes actions, and routes recommendations for human approval. Agencies evaluating these platforms should prioritize their ability to reduce the time between report delivery and approved work, as this interval directly impacts retainer margin.
The Evaluation Criteria That Replace Feature Checklists
TEI Benefits, Costs, Risks as the Grading Rubric
Instead of feature lists, the Total Economic Impact (TEI) model provides a robust framework for evaluating reporting tools. Forrester's TEI model for SEO categorizes value into three areas 5, 6:
- Benefits — e.g., organic traffic gains, conversion uplift, paid media cost savings
- Costs — e.g., technology licenses, agency fees, internal labor
- Risks — e.g., algorithm volatility, implementation difficulty
This framework aligns with how finance-side stakeholders assess value and should guide reporting-tool selection.
When assessing benefits, agencies should determine if a tool can link organic sessions to booked revenue without manual intervention. For costs, consider the analyst hours saved, not just the license fee. A more expensive platform that significantly reduces labor hours can be more cost-effective. Risk assessment, often overlooked, is critical. The Forrester Wave for Marketing Measurement and Optimization Solutions rewards platforms that surface incrementality and cross-channel attribution 7. A tool that cannot contextualize a Google update's impact or demonstrate the value of the retainer in a risk-adjusted manner fails to provide a complete story. Agencies should require vendors to demonstrate all three TEI columns on a live account.
AI Search Visibility as a Live Criterion, Not a Roadmap Item
Reporting tools that present AI overview presence as a simple binary or single percentage misrepresent the dynamic nature of AI search. A 2026 preprint on AI search visibility suggests that generative outputs vary across queries, sessions, and users, necessitating reporting visibility as a distribution rather than a single observation 10. A dashboard widget that queries an AI engine infrequently provides a number without a confidence interval, making it unreliable.
From a commercial perspective, click-based KPIs may undervalue instances where a brand appears in a generative answer without generating a direct referral session. Agencies need new attribution models when AI overviews cannibalize clicks 9. Reporting software must distinguish between an unclicked AI-answer citation and a lost impression to avoid false negatives.
Key evaluation criteria include measurement cadence and sampling design. Vendors should explain how often they query generative surfaces, how they vary prompts to capture output variance, and how they report the resulting distribution (e.g., median citation rate, share of prompts returning the brand, variance across sessions). Tools that provide a range for AI visibility are preferable to those offering a single share-of-voice number, as a range reflects the reality of AI search.
Rank Tracking's Diminishing Evidentiary Weight
While rank tracking remains a component of the reporting stack, its prominence in client reports should be reduced. Search result compositions vary significantly across engines and query sets, making cross-source rank comparisons complex 11, 12. A position-three ranking for one keyword set might coexist with a position-eleven for a paraphrased query, neither of which definitively proves ROI to a CFO.
The evidentiary limitations are compounded by manipulative activities and inflated signals within search-marketing ecosystems 13. Furthermore, rank movements can be rational even with noisy underlying signals, meaning ranks alone cannot sustain an ROI argument 4.
Reporting tools should still surface rank data for diagnostic purposes, such as identifying page movements or correlating technical fixes with recovery. However, leading client narratives with rank charts is counterproductive. Client services directors who prioritize rank tracking risk losing renewal conversations to competitors who emphasize revenue attribution.
Test Real SEO Reporting Workflows in One Week
Experience full-featured reporting and publish live SEO reports before making a long-term commitment.
Retainer Economics: Labor Cost Per Account Per Cycle
For portfolio account leadership, the primary metric for evaluating reporting stacks is the labor cost per account per monthly cycle, calculated by multiplying hours by the blended senior-analyst rate. Factors like connector count or aesthetics are secondary to this operational math.
Each archetype yields different labor profiles:
- Dashboard aggregators reduce layout time but not analysis.
- SEO-native suites streamline diagnostics but require analysts to construct the revenue narrative.
- Orchestration platforms, by integrating ranked recommendations with the reporting surface, compress the interval between report delivery and approved next steps 18.
| Archetype | Hours per account per cycle | Blended analyst rate | Monthly reporting cost per account |
|---|---|---|---|
| Dashboard Aggregator | H₁ | $R | H₁ × R |
| SEO-Native Suite | H₂ | $R | H₂ × R |
| Orchestration Platform | H₃ | $R | H₃ × R |
The client-visible ROI of reporting labor is measurable. For instance, a survey of search engine performance optimization noted precision improvements from 78% to 92% and recall improvements from 72% to 89% after optimization 2. These deltas justify analyst hours if the reporting stack effectively communicates them to the client in a revenue-tied format. Otherwise, analyst time is spent on layout, not retainer defense.
To select a tool, calculate the annual savings: multiply the per-account hour difference between the current and candidate stacks by the analyst rate, then by the portfolio account count, and finally by twelve. This figure determines if the platform's annual cost is justified. Agencies often find that archetypes rank differently on hour compression than on feature depth, with hour compression being key to preserving margin.
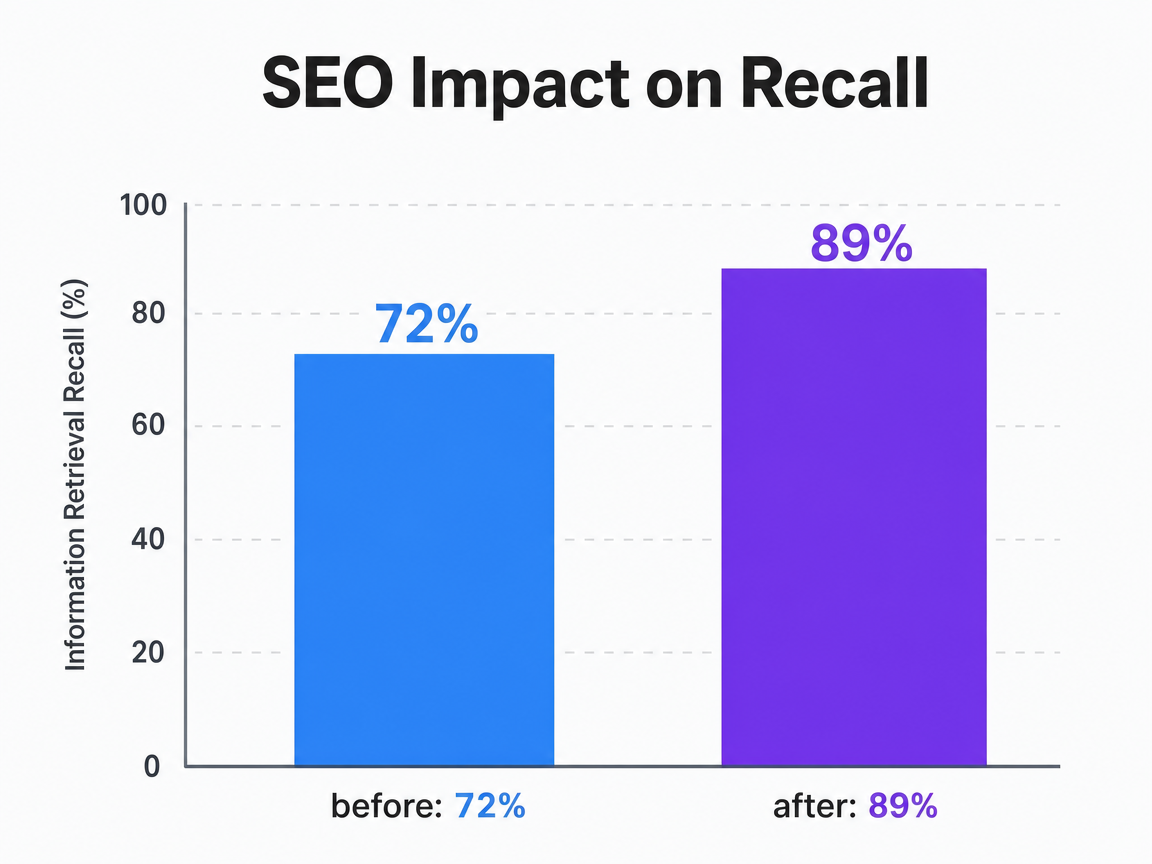
Comparison of information retrieval 'recall' metric before and after search engine optimization, showing an improvement from 72% to 89%.
What Page-Level Reporting Should Actually Surface
Effective page-level reporting provides diagnostic credibility by linking specific on-page changes to measurable performance deltas. This requires the reporting layer to prioritize key signals on the page view.
An MCDM decision model for SEO criteria identified meta tags (0.189), keywords (0.185), and website design (0.179) as the highest-influence on-page dimensions, with external optimization being the top overall priority 1. A reporting surface that tracks title-tag revisions, keyword coverage shifts, and Core Web Vitals against these weights offers concrete evidence for performance changes.
Technical performance also requires page-level detail. A peer-reviewed survey showed average server response times dropping from 3.2 to 1.4 seconds and usability scores climbing from 3.1 to 4.5 after optimization 2. Reporting tools that surface these deltas per URL, rather than as site-wide averages, enable agencies to attribute traffic recovery to specific engineering work.
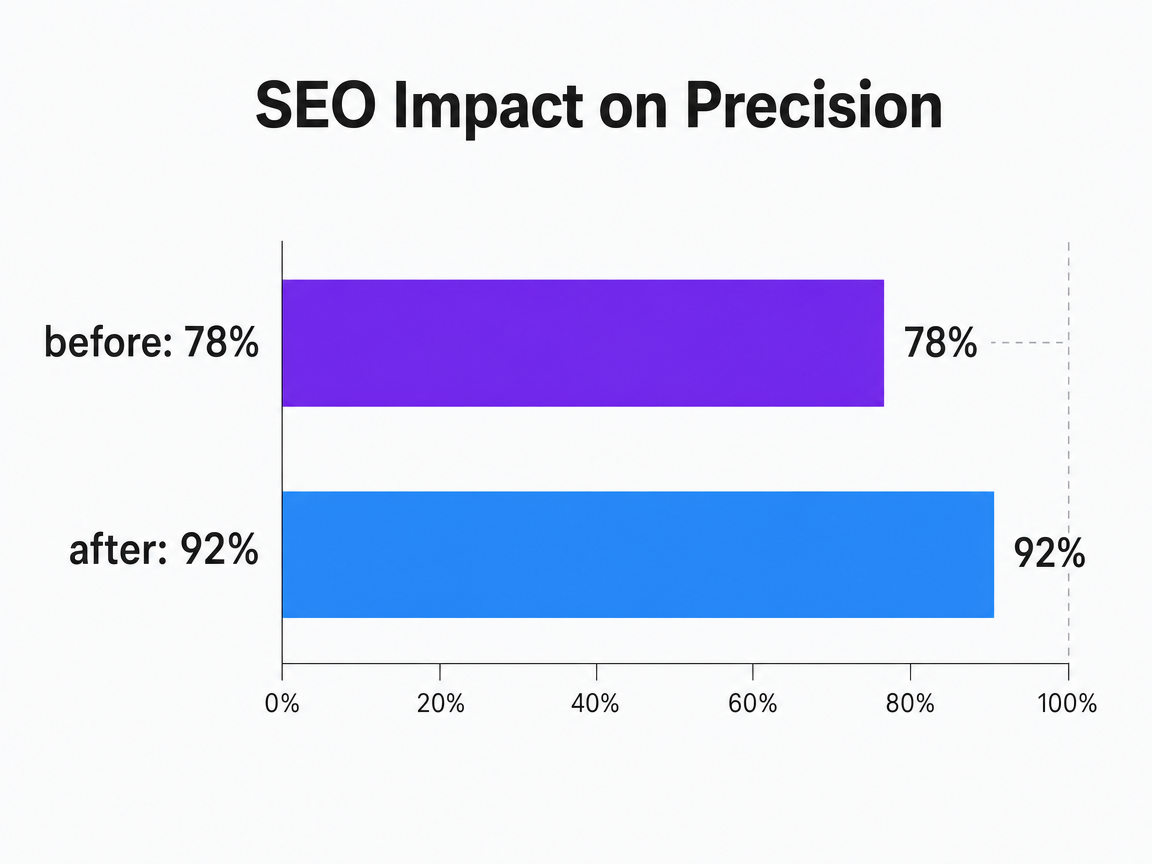
Comparison of information retrieval 'precision' metric before and after search engine optimization, showing an improvement from 78% to 92%.
See How Leading Agencies Quantify SEO ROI with Unified Reporting
Request a walkthrough of advanced reporting workflows—integrating channel metrics, attribution modeling, and client-ready dashboards—to streamline proof of SEO impact across all your accounts.
Portfolio Operators: Scaling Reporting Across 20+ Accounts
Portfolio leaders, such as client services directors and heads of SEO managing 20 to 150 accounts, face a coordination challenge that single-account approaches cannot solve. The goal is not merely the best individual client deck, but a reporting stack that can efficiently handle monthly cycles for dozens of accounts without extensive manual intervention.
At portfolio scale, three operational variables are critical:
- Templating discipline — avoiding bespoke report structures.
- Data-trust standardization — normalizing GA4 configurations, conversion definitions, and CRM handoffs.
- Exception routing — identifying accounts needing attention without reviewing all of them.
The Forrester Wave for Marketing Measurement and Optimization Solutions emphasizes incrementality measurement and actionable insight for portfolio-scale success 7. A stack that supports a reporting-to-approval loop is crucial for identifying at-risk accounts 18. Agencies should test how quickly a vendor's platform can identify at-risk accounts and facilitate approved work orders.
Selecting the Archetype That Matches the P&L
The choice of reporting platform should align with the agency's P&L pressures, not just feature comparisons:
- Agencies with paid-heavy retainers benefit most from dashboard aggregators paired with a data warehouse, leveraging broad connector breadth for cross-channel stories.
- Those focused on technical audits, content programs, and page-level defensibility gain from SEO-native suites, where diagnostic granularity is the core product 1.
- Agencies experiencing margin erosion due to reporting labor across many accounts will find orchestration platforms most beneficial, as they compress the interval between reporting and approved work, scaling without additional headcount 18.
A disciplined approach involves testing a single account with two different archetypes for a full cycle, then measuring hours saved and approvals secured. The archetype that shortens the reporting-to-approval loop for a live retainer is the appropriate choice. Vectoron, as an orchestration platform, serves agency heads who prioritize this efficiency and find aggregator limitations too restrictive.
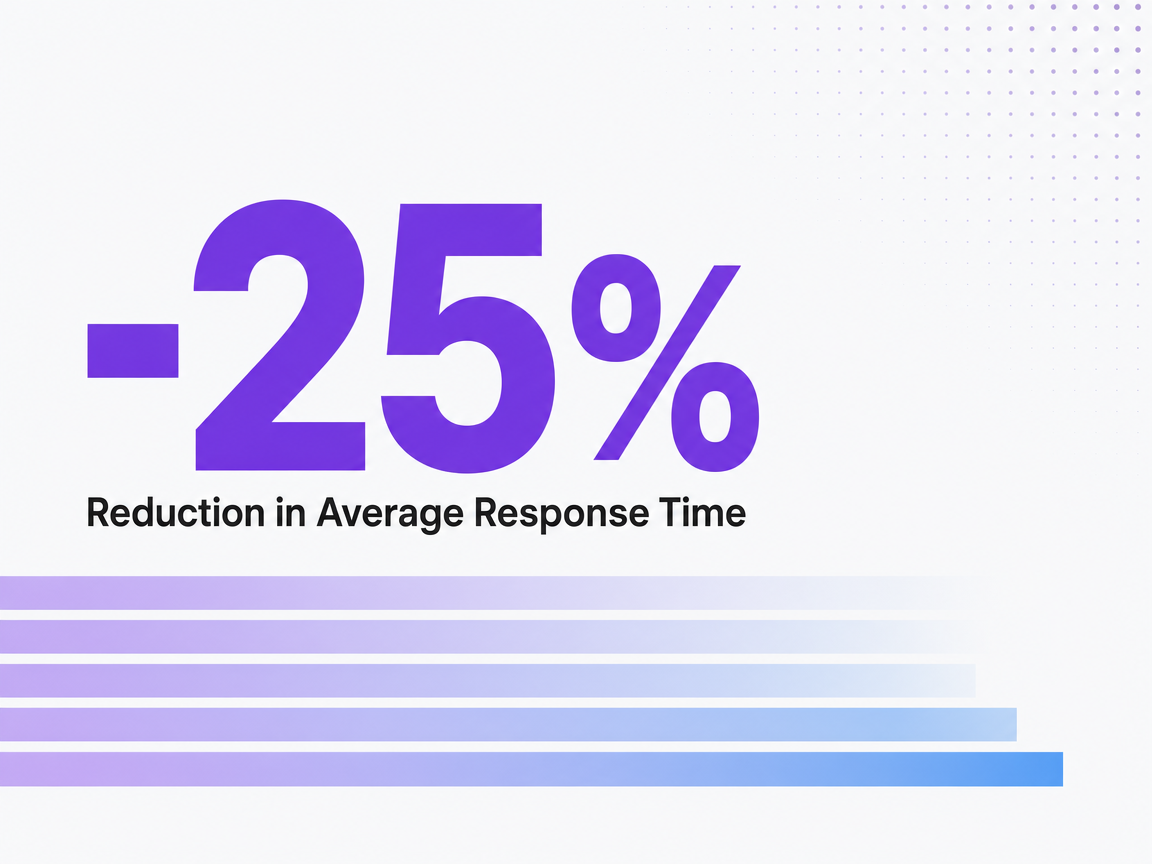 Reduction in Average Response Time
Reduction in Average Response Time
Frequently Asked Questions
References
- 1.Improving search engine optimization (SEO) by using hybrid modified MCDM models.
- 2.Search engine Performance optimization: methods and techniques.
- 3.The influence of search engine optimization on Google's results.
- 4.The Role of Search Engine Optimization in Search Rankings.
- 5.You Can Quantify The ROI Of SEO.
- 6.The ROI Of SEO.
- 7.The Forrester Wave™: Marketing Measurement and Optimization Solutions, Q3 2023.
- 8.The Forrester Wave™: SEO Platforms, Q3 2020.
- 9.Return On Generative Engine Optimization aka The ROI Of GEO.
- 10.Don't Measure Once: Measuring Visibility in AI Search (GEO).
- 11.A study of results overlap and uniqueness among major Web search engines.
- 12.Methods for comparing rankings of search engine results.
- 13.Search engine marketing is not all gold: Insights from Twitter and SEOClerks.
- 14.You are how (and where) you search? Comparative analysis of web search behavior using web tracking data.
- 15.Estimating Credibility of User Clicks with Mouse Movement and Eye-Tracking Information.
- 16.UsCoTc: Improved Collaborative Filtering (CFL) recommendation methodology using user confidence, time context with impact factors for performance enhancement.
- 17.The Effectiveness Of Search Engine Optimization (SEO) In Marketing: A Meta-Analysis Study.
- 18.SEO Reporting Software for Clients: Evaluation Guide with Key Workflow Criteria.