
Key Takeaways
- Treat rank tracking as a diagnostic sensor rather than a client KPI, with qualified traffic and conversions leading reports and position data annotating specific query, page, or device segments.
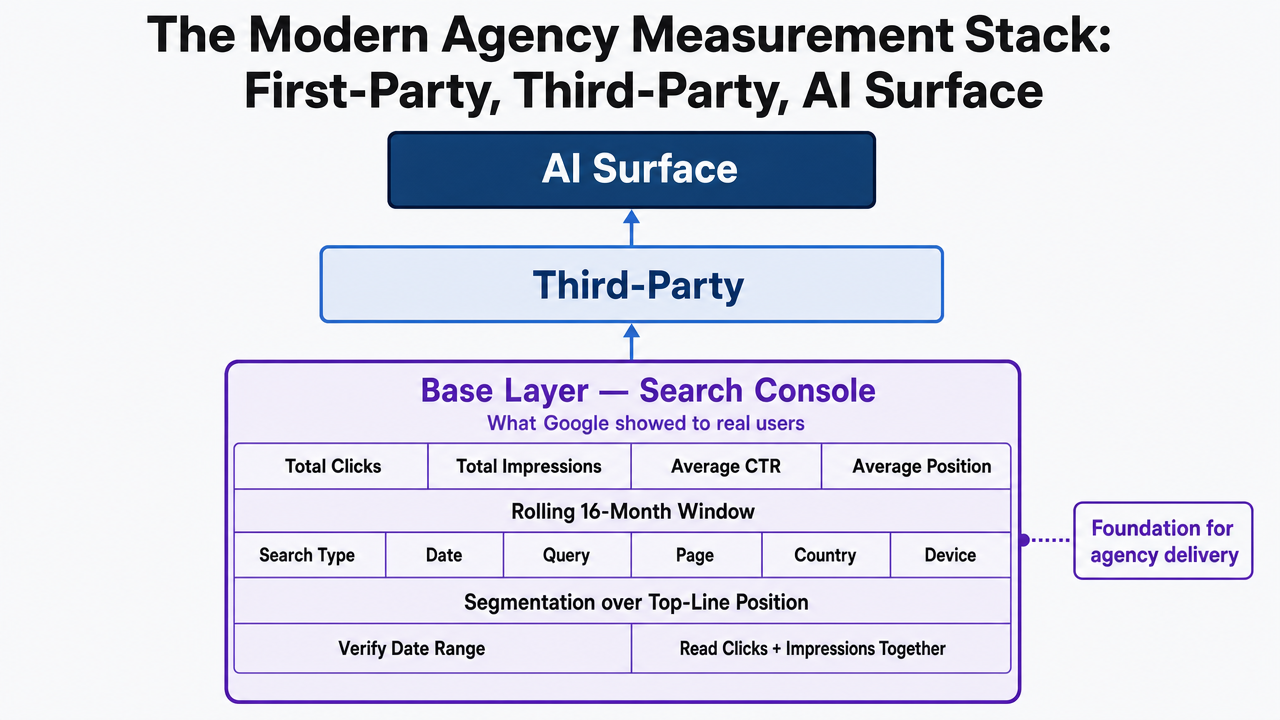
- Build a three-layer measurement stack: Search Console as the first-party base, third-party tools for competitor and SERP feature capture, and AI Overview impressions on a separate report line 3, 9.
- Prioritize the strike-zone queue of queries sitting at positions 8 to 20, where titles, metas, and intent refinements produce measurable click movement inside a single reporting cycle 11, 12.
- Standardize a five-column report, segment every alert by page group, intent, device, and country, and resolve every claim back to Search Console before it reaches the client 2, 9.
Rank Tracking Is a Diagnostic Input, Not a Client KPI
The fastest way to spot an agency stuck in 2018 practice is to open a client deck and see average position sitting at the top of page one. Position data still matters, but it belongs in the diagnostic layer of the reporting stack, not the executive summary. Google evaluates pages through automated ranking systems that weigh many factors and signals across hundreds of billions of pages, blending page-level systems with site-wide signals, and folding the Helpful Content system into core ranking in March 2024 1. A single number cannot summarize that.
Agency SEO leads running delivery across dozens or hundreds of accounts feel the consequences of the old framing every reporting cycle. Analysts spend hours reconciling rank tool exports with Search Console, clients ask why a query "moved to position 4" but sent no traffic, and account managers translate directional metrics into commitments the data was never built to support.
The reframe is straightforward. Rank tracking is a sensor. It signals where to look next: which query cluster, which page template, which device segment, which SERP feature. The client-facing KPI is qualified traffic, conversions, and pipeline. The internal KPI is the speed and accuracy of the diagnostic loop that turns a rank shift into a prioritized action. The sections that follow describe how to build that pipeline against a measurement surface that now spans first-party clicks, third-party SERP capture, and AI Overview impressions.
Why Single-Number Rank Reports Mislead Agency Clients
Consider the classic client email: "We're ranking #3 for [head term] — why did organic traffic drop 12%?" The agency scrambles to reconcile a rank tool that scraped a single SERP snapshot against a Search Console report that shows impressions up, clicks flat, and CTR compressed. Nothing is broken. The report is misleading because it collapsed a multi-signal, per-query, per-device, per-country outcome into one integer.
Google's own documentation makes the frame explicit. Its automated ranking systems evaluate many factors and signals across hundreds of billions of pages, combining page-level systems with site-wide signals, and the Helpful Content system was folded into core ranking in March 2024 1. That means a query's position on any given SERP is the output of interacting systems — content quality, page-level relevance signals, site-wide reputation, and a growing set of generative surfaces layered on top. A single-number report treats the output as the input.
Three failure modes recur in agency decks that lean on one position figure:
- First, the number is a personalized, cached, or geo-averaged snapshot that does not match what any real user sees.
- Second, it hides the query mix: one high-impression tail term at position 40 can swing the average more than the money keyword at position 3.
- Third, it ignores SERP composition — an AI Overview, a featured snippet, or a local pack sitting above the classic result changes the click economics regardless of position.
Agency delivery leads running 20 to 200 accounts pay for this framing in analyst hours and client trust. Every reporting cycle produces reconciliation calls between a rank tool and Search Console, because the two systems answer different questions. A rank tool asks where a URL appeared in a scripted SERP; Search Console reports where URLs appeared across real impressions 9. Neither is wrong. Both are partial.
The correction is not more tools. It is a report structure that treats position as a diagnostic input feeding a segmented view of clicks, impressions, CTR, and — increasingly — AI Overview impressions 3. The next section describes the measurement stack that supports that structure.
The Modern Agency Measurement Stack: First-Party, Third-Party, AI Surface
Search Console as the Base Layer
Search Console sits at the base of the stack because it is the only source that reports what Google actually showed to real users. The Performance › Search results report exposes total clicks, total impressions, average CTR, and average position across a rolling 16-month window, filterable by search type, date, query, page, country, and device 9. That segmentation set — not the top-line position number — is what makes the report useful for agency delivery.
Two disciplines separate strong analysts from average ones when reading it. The first is date-range verification before drawing any conclusion, because a suspicious drop is often a comparison against an unusually strong prior period or a filter left on from a previous session 10. The second is reading clicks and impressions together before glancing at CTR or position, since position is the mean ranking across all impressions for a query or page and moves for reasons that have nothing to do with the page itself 10.
Layered on top, the integrated Search Console Insights view shows clicks and impressions from Google Search and how they are trending compared to the previous period, which is the right surface for account managers doing weekly trend reads without pulling raw exports 5. Insights is not a replacement for the Performance report — it is a triage lens that keeps analysts focused on segmentation work.
Third-Party SERP Capture and the Honest Limits of Authority Scores
Third-party rank trackers and authority tools answer a question Search Console cannot: what does the SERP look like right now, and how does it compare across competitors and locations? Scripted SERP capture gives agencies a controlled snapshot — same device, same locale, same query set — which is useful for competitive tracking, local pack visibility, and detecting SERP feature changes that Search Console reports only through impression side effects.
Two limits deserve honest client framing. First, a scripted capture is not what any given user sees; personalization, geography, and session context all shift the actual result. Second, third-party authority scores are heuristics, not ground truth. A 2023 reliability study of Moz, Semrush, Ahrefs, and Majestic domain authority scores reported a Spearman rho of 0.9 in the global analysis — high inter-tool correlation — while still treating those scores as estimations rather than direct measures of ranking outcomes 8. Agencies that quote authority movement as proof of SEO progress are reporting on the tool, not on Google.
The practical rule for the third-party layer: use it for competitor SERP monitoring, SERP feature detection, and local pack tracking, and route every performance claim back through Search Console before it lands in a client report.
AI Overview Impressions as a Separate Report Line
The third layer is generative visibility, and it belongs on its own report line rather than mixed into classic organic totals. Google's Search Generative AI performance reports surface impressions for URLs appearing in AI Overviews and other generative features, with dimensions for pages, countries, and devices, and date granularity available at hourly, daily, weekly, and monthly levels 3. That is a distinct visibility signal, measured separately, and it should be reported separately.
Mixing AI Overview impressions into the same line as classic Search impressions destroys interpretability. An agency dashboard for a modern client account should carry five columns mapped to their Search Console source:
- Clicks (Performance › Search results)
- Impressions (Performance › Search results)
- CTR (Performance › Search results)
- Average Position (Performance › Search results)
- AI Overview Impressions (Search Generative AI performance report) 3, 9
Each column answers a different question, and each moves for different reasons.
CTR falls naturally as AI Overviews absorb clicks, which means a client account can show rising impressions, rising AI Overview impressions, and flat or declining clicks all at once — with nothing broken on the page. Separating the columns lets the agency narrate that pattern honestly instead of defending a CTR drop that was never within the page's control. The Search Generative AI performance report is still rolling out to a subset of sites and Google is iterating on which insights and metrics to add, so agencies should treat this layer as a moving target and check for new dimensions each quarter 3.
 Visualize the three-layer measurement stack described in the section as a stacked framework diagram
Test AI-driven rank tracking with real campaigns
Validate rank tracking accuracy and workflow efficiency using your agency’s actual client data during the free trial.
The Average Position Trap and How to Correct It in Client Reports
Average position is the metric most agency dashboards over-weight, and the reason is structural: it fits in a single cell. That convenience hides how the number is actually computed. Search Console reports average position as the mean ranking across all impressions for a query or page, which means one long-tail query at position 90 with heavy impressions will drag the whole account average down regardless of what the money pages are doing 11. The reverse is also true. A cluster of newly indexed pages that briefly surfaced at position 60 can pull the average into a scary red arrow that has nothing to do with the pages the client actually cares about.
The correction has three parts:
- First, verify the date range before drawing any conclusion. A large share of "traffic dropped" panics turn out to be comparisons against an unusually strong prior period, or a filter left on from the previous session 10.
- Second, read clicks and impressions together before glancing at CTR or position, because position is directional, not a precise rank of any single SERP 10.
- Third, never report account-level average position as a headline number. Report it segmented — by page group, by query intent, by device — or not at all.
For client-facing decks, the practical substitution is to lead with clicks and impressions on the money page group, show CTR against the site's own trailing baseline rather than an industry number, and relegate average position to a diagnostic annotation that explains why a segment moved. That reframe alone eliminates most of the reconciliation calls that consume analyst hours every reporting cycle.
The Strike-Zone Queue: Turning Position Data Into a Prioritized Backlog
Once average position is demoted to a diagnostic annotation, the question becomes what to do with the position data that remains. The answer is a queue, not a dashboard. The most productive filter agency delivery leads can apply to a tracked keyword set is the strike-zone band: queries currently sitting between positions 8 and 20. These are the URLs Google is already willing to surface on or near the first two pages, where a title rewrite, an intent match, or a supporting section can produce measurable click movement inside a reporting cycle 11.
The distribution logic matters. In a typical agency-managed account, tracked queries cluster into five bands with very different economics:
- Positions 1 to 3 are defense work — protect CTR, monitor SERP feature encroachment.
- Positions 4 to 7 are second-page-of-page-one territory where content depth and internal linking do the heavy lifting.
- Positions 8 to 20 are the strike zone: high impressions relative to clicks, low CTR against the site's trailing baseline, and the shortest distance between an edit and a result 11.
- Positions 21 to 50 are content-gap work with longer payback.
- Positions 51 and beyond are usually indexation, intent-mismatch, or ambition problems that do not belong in a weekly optimization queue at all.
Operationalizing the queue is a filter, not a spreadsheet exercise. The repeatable pattern is to export recent Performance data, filter for queries with below-baseline CTR at high impression volume, prioritize the ones sitting in the 8-to-20 band, and route them into a titles-and-metas edit cycle with a re-measure window attached 12. That loop closes in days, not quarters, and it produces the click deltas clients actually notice — without leaning on average position as a headline metric that CTR compression from AI Overviews would erode anyway 11.
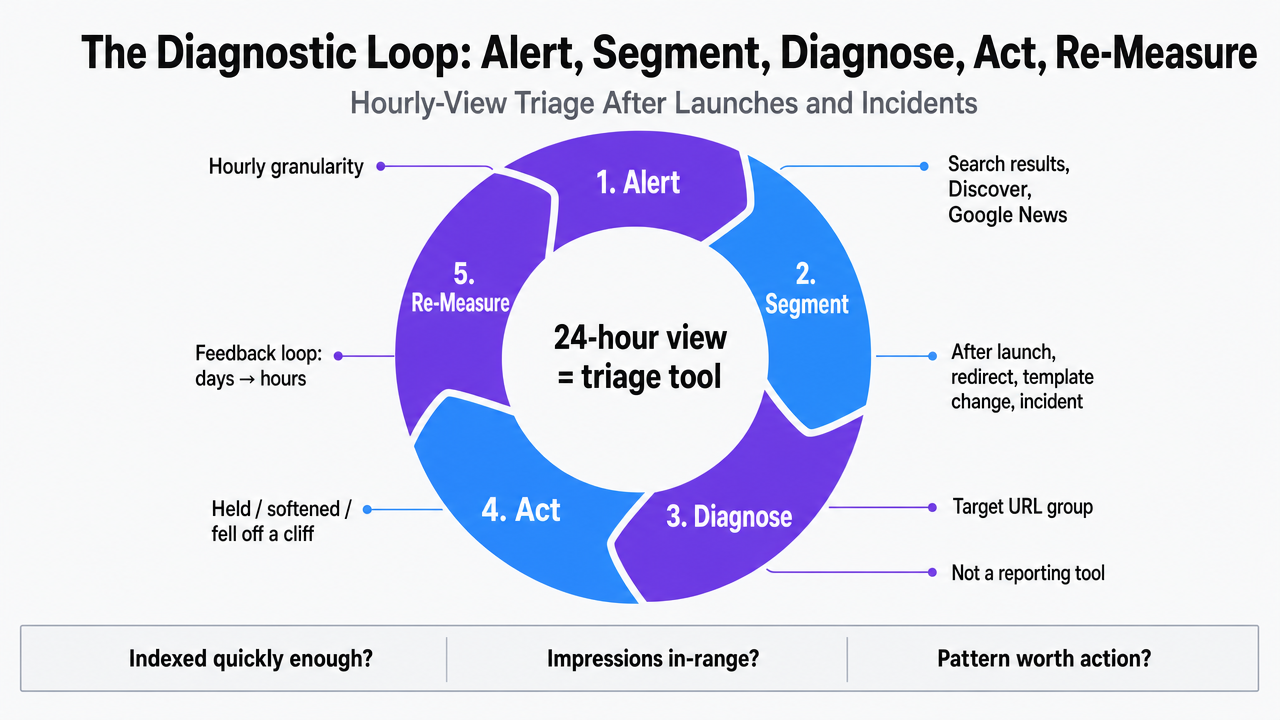
The Diagnostic Loop: Alert, Segment, Diagnose, Act, Re-Measure
Hourly-View Triage After Launches and Incidents
The 24-hour view in Search Console is the single most underused triage surface in agency delivery. It adds hourly granularity across Search results, Discover, and Google News performance reports, which collapses the feedback loop on any launch, redirect, template change, or suspected incident from days to hours 4. That matters when a client shipped a new product template Tuesday morning and the account lead needs to know by Tuesday afternoon whether impressions on the affected URL group held, softened, or fell off a cliff.
The rule for delivery teams is narrow. The hourly view is a triage tool, not a reporting tool. It answers three questions: did the change land in Google's index quickly enough to matter, are impressions on the target URLs behaving in-range against the prior 24-hour baseline, and is there a query-level anomaly worth escalating before the weekly report cycle. Anything longer than a 48-hour interpretation window belongs in the 16-month Performance view, not here. Analysts who lean on hourly data for trend claims will read noise as signal every time.
Segmenting by Query, Page, Country, and Device
Segmentation is where the Performance report earns its place at the base of the stack. The Performance › Search results report filters by search type, date, query, page, country, and device across a 16-month window, and the discipline that separates useful analysis from cosmetic dashboards is refusing to interpret a top-line number without at least two of those filters applied 9. A drop in average position at the account level almost always resolves into a specific slice: one country, one device class, one page template, or a query cluster that shifted intent.
The operational pattern is a fixed segmentation order that analysts run every time a diagnostic loop opens:
- Page group first, to isolate whether the movement is concentrated in a template or spread across the site.
- Query intent second, to separate branded from non-branded and informational from transactional.
- Device third, because mobile and desktop SERPs diverge sharply on SERP feature composition.
- Country last, to catch geographic anomalies that a global average would flatten.
Running the same four cuts on every alert turns segmentation into a repeatable SOP rather than an analyst's judgment call, which is what makes the loop scale across 20 to 200 accounts.
What to Actually Change When Rankings Move
Segmentation identifies where a movement lives. Diagnosis identifies why. And the answer to "what to change" almost never sits in the rank tracker. Google's own guidance frames the question the way it should be asked in an editorial review: is the content original, comprehensive, useful to an existing audience, and created primarily to help people rather than to attract search engine visits 2. That framing is the checklist for any page group that lost impressions on a segment where competitors held steady.
The action set falls into three lanes:
- Content-quality lane: intent match on the target query, coverage gaps against the SERP, and originality of the analysis on the page 2.
- Technical lane: index status of the affected URLs, SERP feature encroachment such as new AI Overviews or carousels, and Core Web Vitals field data for the URL group.
- Merchandising lane: titles and meta descriptions for queries with below-baseline CTR, which is the fastest edit-to-result loop in the diagnostic pipeline 12.
Each lane produces a work item with an owner and a re-measure window. Anything that cannot be assigned to one of those three lanes is a hypothesis, not an action, and belongs back in the segmentation step.
 Visualize the five-step diagnostic workflow named in the section heading as a circular process loop
See How Real-Time Rank Tracking Drives Consistent SEO Gains Across Client Portfolios
Connect with our team to discuss scalable, data-driven rank tracking systems that deliver measurable visibility improvements and unified reporting—purpose-built for agencies managing high-volume SEO delivery.
Analyst Hours: The Economics of a Segmented Pipeline
The margin question inside agency SEO delivery is not tool cost. It is analyst hours per 100 tracked keywords per reporting cycle. A manual pipeline burns those hours on reconciliation: pulling a rank tool export, pulling a Search Console Performance › Search results export for the same window, aligning query strings, resolving discrepancies between scripted SERP position and Search Console's mean ranking across impressions 9, then writing a narrative that explains what moved and why. Analysts inside that pipeline spend the majority of a reporting cycle assembling the report rather than acting on it.
A segmented pipeline reallocates those hours. Alerts are pre-classified by position band, so strike-zone queries at positions 8 to 20 land in an action queue instead of a discussion queue 11. AI Overview impressions arrive on their own report line from the Search Generative AI performance report rather than mixed into classic Search totals 3. Trend reads for account managers happen inside the integrated Search Console Insights view instead of in a bespoke export 5. The repeatable export-filter-optimize-monitor loop against low-CTR queries becomes an SOP the platform runs, not a task the analyst assembles 12.
A useful framing table for delivery leads, expressed in variables rather than invented dollars:
| Function per 100 tracked keywords | Manual reconciliation pipeline | Segmented diagnostic pipeline |
|---|---|---|
| Weekly data assembly | Analyst-hours: high | Analyst-hours: near zero |
| Strike-zone queue triage | Ad hoc, per analyst judgment | Pre-classified by position band |
| AI Overview visibility line | Not reported | Separate report column |
| Reports per analyst per month | Bounded by assembly time | Bounded by review capacity |
The economic shift is not fewer analysts. It is analysts spending their hours on diagnosis and client narrative rather than on data assembly, which is the only version of rank tracking that scales across 20 to 200 accounts without margin compression.
Reporting Standards That Survive the AI Overview Era
The reporting standard that holds up under AI Overview compression is boring on purpose: a fixed five-column layout, a segmented commentary block, and no headline average position. The five columns map directly to Search Console sources — Clicks, Impressions, CTR, and Average Position from Performance › Search results, plus AI Overview Impressions from the Search Generative AI performance report 3, 9. Each column carries its own trailing baseline for the account, not an industry benchmark, so a CTR softening from generative surfaces reads as expected behavior rather than a regression to defend.
The commentary block sits below the columns and follows a fixed structure: what moved, in which segment, and what was changed or is queued to change. Segments are page group, query intent, device, and country, in that order, because that is the segmentation sequence analysts already run during diagnosis 9. Action items reference the three lanes — content quality against Google's helpful-content criteria 2, technical status, and titles-and-metas edits on strike-zone queries 11, 12— with a re-measure window attached to each.
Two habits keep the standard durable. Trend reads for account managers happen inside Search Console Insights rather than in bespoke exports, which keeps the weekly cadence cheap 5. And every claim in the deck resolves back to a first-party Search Console figure before it ships, because that is the only surface reporting what Google actually served to real users. Platforms like Vectoron formalize this loop as an approval-gated pipeline, but the standard itself is source-agnostic and survives whatever generative surface Google ships next.
Frequently Asked Questions
References
- 1.A guide to Google Search ranking systems.
- 2.Creating Helpful, Reliable, People-First Content.
- 3.Introducing Search Generative AI performance reports in Search Console.
- 4.An improved way to view your recent performance data in ....
- 5.The new Search Console Insights report is here.
- 6.Best SEO Rank Tracking Software for Agencies and Teams.
- 7.Best SEO Rank Tracking Tools for Agencies in 2026 Guide.
- 8.Reliability of domain authority scores calculated by Moz, Semrush, Ahrefs and Majestic.
- 9.Google Search Console Guide: Every Report Explained.
- 10.Reading the Search Console Performance Report Correctly.
- 11.Google Search Console Guide 2026: Every Report Explained.
- 12.Google Search Console Performance Report Guide: CTR, Impressions and Average Position.