
Key Takeaways
- AccuRanker, Nozzle, and STAT own the high-frequency SERP monitor role, catching same-day position swings that weekly refresh cadences would force analysts to reconstruct manually past 20 accounts.
- Semrush and Ahrefs serve strategy-led practices as diagnostic graphs, joining rank to backlinks, content, and Search Console so analysts can answer why a drop happened without switching tools mid-investigation.
- SE Ranking consolidates rank tracking, audits, and white-label reporting at mid-market seat pricing, and uniquely logs AI Overview triggers, citations, and link position inside the answer block 11.
- Nightwatch, BrightLocal, and Local Falcon cover multi-location portfolios with geo-coordinate grid tracking that surfaces per-storefront pack positions the city-level averages of general trackers smooth away 15.
- An AI-surface detection workflow using a fixed 40-80 query panel and a 0-3 citation prominence score converts AI Overview presence into a defensible executive visibility index 3.
- Vectoron sits adjacent to rank tracking as the approval-workflow layer, consuming upstream signals and routing ranked, human-approved actions across content, SEO, PPC, backlinks, and social channels.
Why rank tracking became a measurement stack decision in 2026
In June 2026, Google Search Console added dedicated performance reports for generative AI features, exposing impressions, pages, countries, devices, and hourly-to-monthly granularity for AI Overviews and generative Discover 1. That single release changed what a rank tracking tool is for. Position data no longer sits at the center of the report; it sits inside a stack of measurements that includes AI surface citations, SERP feature presence, and first-party Google Search Console truth data.
Agencies feel the shift in the reporting layer first. A client asks why organic sessions dropped, and the answer now requires reconciling four data sources: the rank tracker's position history, the SERP feature snapshot from that week, the AI Overview citation log, and the GSC impression and CTR curve 16. Any one of those alone produces a wrong diagnosis.
The practical consequence for agency heads of SEO: tool selection stops being a comparison of accuracy and refresh speed and becomes a question of which layer of the stack each tool owns. A high-frequency SERP monitor answers a different question than a diagnostic graph, which answers a different question than a geo-coordinate local tracker or an AI-surface detector 15. Choosing three tools that all own the same layer wastes budget and leaves the other layers unanswered when a client escalates.
The six stack roles agencies actually need to fill
Before evaluating vendors, an agency head of SEO benefits from naming the roles the stack must cover. Six show up repeatedly across 2026 tool reviews and agency playbooks:
- a high-frequency SERP monitor that catches volatile position swings within hours,
- a diagnostic graph that joins rank to backlinks, content, and Google Search Console for competitive investigation,
- a mid-market consolidator that packages rank tracking, audits, and white-label reporting into one seat-priced platform,
- a local specialist that measures pack visibility at the geo-coordinate rather than city level,
- an AI-surface detector that logs AI Overview triggers, citations, and link position, and
- an execution loop that routes those signals into ranked, human-approved actions across channels 16, 15.
Each role answers a different question. The high-frequency monitor answers "did we move today?" The diagnostic graph answers "why did we move, and what did competitors do?" The consolidator answers "can one seat serve 40 clients without breaking margin?" The local specialist answers "did the pack shift at 500 Main Street, not just in the city average?" The AI-surface detector answers "are we cited in the Overview, and where in the answer block?" 11. The execution loop answers the question clients actually ask on the monthly call: "what did we do about it?"
Agencies that own three tools serving the same role — usually two diagnostic graphs and a consolidator — leave the local and AI-surface columns dark.
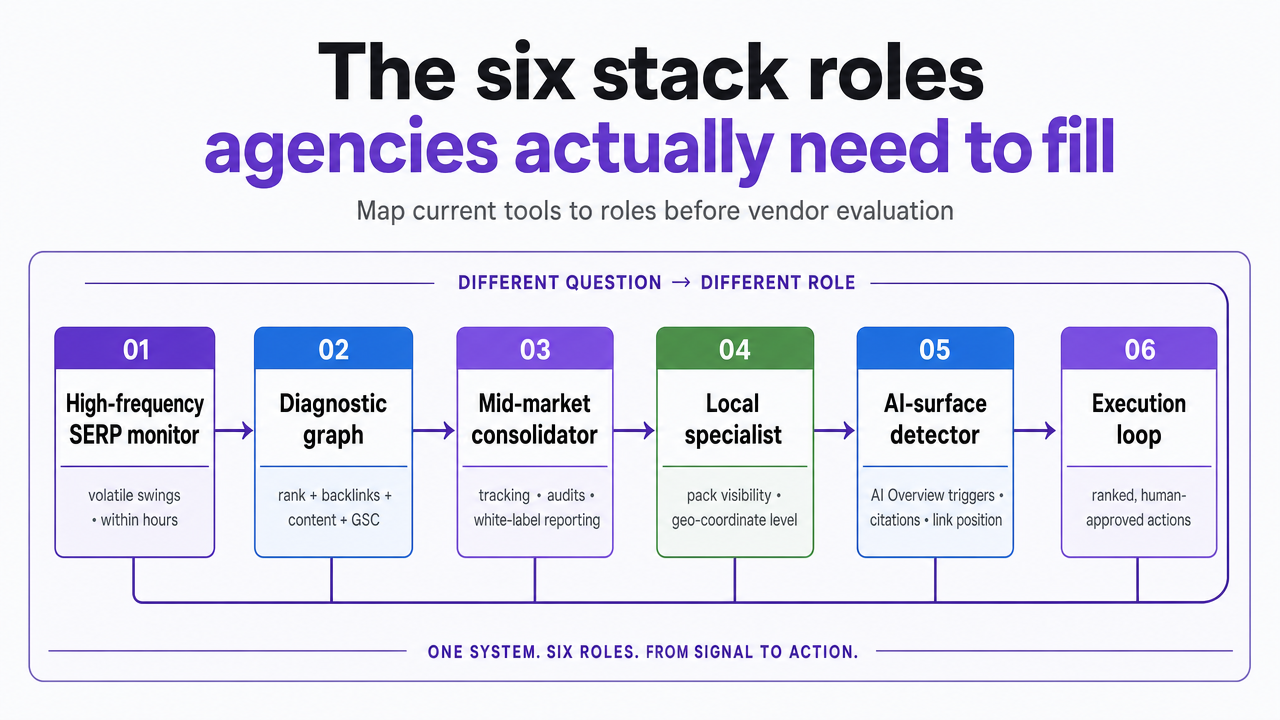 Visualize the six distinct stack roles named in this section as a framework diagram, so readers can map their current tools against each role before reading vendor-specific sections
How six rank tracking tools map to the agency measurement stack
The fastest way to see whether a stack has redundant coverage is to lay the candidates against the six roles and mark which columns each one actually owns. The matrix below draws from agency-focused tool comparisons and product documentation, not vendor marketing pages 14, 15, 16.
| Tool | Stack role | Agency archetype best fit | AI Overview detection | Local granularity | White-label & API | Notable limitation |
|---|---|---|---|---|---|---|
| AccuRanker / Nozzle / STAT | High-frequency SERP monitor | Reporting-heavy shop | Partial | City-level | Both, at agency tier 14 | Thin diagnostic layer around the position data 16 |
| Semrush / Ahrefs | Diagnostic graph | Strategy-led practice | Partial | City-level | Both 14 | Refresh cadence lags dedicated monitors 16 |
| SE Ranking | Mid-market consolidator | Mid-market generalist | Yes; detects triggers, citations, and link position in the answer block 11 | City-level | Both, priced below enterprise seats 15 | Enterprise-scale portfolios strain the seat model 14 |
| Nightwatch | Local specialist | Multi-location specialist | Partial | Geo-coordinate rather than city 15 | Both 14 | Not built for enterprise-wide diagnostic joins 15 |
| BrightLocal / Local Falcon | AI-surface and local pack detector | Enterprise diagnostician for local | Partial | Geo-coordinate grid 16 | White-label; limited API 14 | Narrow beyond local pack surfaces 16 |
| Vectoron | Execution and approval loop | AI-first execution team | Consumes signals from the layer above | Inherits from connected trackers | Approval workflow, not a reporting seat | Depends on an upstream tracker for raw position data |
Six tools, six stack roles. Reading across a row shows what a single seat actually delivers; reading down a column shows where the stack has two tools solving the same problem.
Two columns tend to expose the biggest gaps. AI Overview detection separates SE Ranking from the rest of the mid-market field because it records whether the domain is cited, whether the citation carries a link, and where it appears within the answer block on each triggered query 11. Local granularity separates Nightwatch and the local specialists from every general-purpose tracker: a geo-coordinate grid catches pack shifts at a specific address that a city-level average smooths away 15.
Read the matrix as a coverage check, not a scorecard. An agency running Semrush and Ahrefs side by side owns the diagnostic column twice and the local column zero times. Adding a third diagnostic tool will not change what the monthly client call sounds like.
AccuRanker, Nozzle, and STAT: the high-frequency SERP monitor
The first stack role belongs to tools built around one design constraint: catch position movement within hours, not days. AccuRanker, Nozzle, and STAT share that constraint, and it shapes every other choice their engineering teams have made 16. Refresh cadence is the headline feature, but the deeper value shows up when a client's competitor launches a new landing page on Tuesday morning and the agency has a rank delta screenshot in the Wednesday standup rather than the following Monday's report.
Reporting-heavy shops tend to build around one of these three. The workflow is straightforward: pipe the daily or on-demand refresh into a scheduled export, join it to Looker Studio or a similar BI layer, and let account managers pull competitive movement without pinging the SEO team 12. At 40 to 150 client portfolios, that automation is what protects margin. A tool that refreshes once a week forces the analyst to reconstruct volatility manually, which does not scale past 20 accounts.
The trade-off is thin diagnostic depth. AccuRanker, Nozzle, and STAT tell an agency what moved and, to a point, which SERP features shifted alongside the move 16. They do not join that position data to backlink acquisition, on-page content changes, or Google Search Console impressions in the same view. Analysts who try to answer "why did we drop from position three to position seven?" inside a high-frequency monitor end up exporting to a spreadsheet within the first hour.
AI Overview coverage in this category is partial. These tools detect that an AI Overview triggered on a query and often flag SERP feature presence, but they do not consistently record whether the client domain was cited inside the answer block or where the citation appeared 11. Agencies serving verticals where AI Overviews now dominate high-intent queries have to pair the monitor with a dedicated citation tracker or accept a blind spot in the report.
The operational takeaway: an agency owns this layer when speed of detection is a client-facing promise. If the reporting narrative is "we caught the drop the same day," a high-frequency monitor earns its seat. If the narrative is "we explained why," the diagnostic graph in the next section carries more weight.
Test real-time rank tracking on live campaigns
Experience agency-grade SERP monitoring and reporting using your own client projects during your free trial.
Semrush and Ahrefs: the diagnostic graph for strategy-led practices
The question a diagnostic graph is built to answer is not "did we move?" but "why did we move, and what has to change?" Semrush and Ahrefs treat rank as one field inside a broader intelligence graph that joins position data to backlinks, on-page content, and Google Search Console signals in a single investigation view 16. That join is the reason strategy-led practices — the ones whose monthly narrative is analysis, not screenshots — tend to build around one of these two platforms.
The workflow shows up in triage. An analyst opens a client dropping from position three to seven, layers the backlink delta over the past 30 days, pulls the content change log for the ranking URL, and compares the GSC impression curve against SERP feature presence in the same session. Two of those data sources live natively inside the graph; the other two arrive through connectors. The point is that the analyst does not switch tools mid-thought, which is what protects diagnostic quality when a senior strategist is reviewing 15 client escalations in a week.
Refresh cadence is the honest trade-off. Neither platform matches the intraday refresh that dedicated high-frequency monitors deliver, and agencies that need same-day drop detection pair the diagnostic graph with a monitor from the previous section 16. AI Overview coverage is partial in the same sense: the graph flags AI Overview presence on tracked queries but does not consistently record citation position within the answer block the way SE Ranking does 11.
The diagnostic graph also forces a healthier attribution habit. Ranking drops rarely map cleanly to a single cause, and one of the fields worth pulling into the same view is Core Web Vitals field data from CrUX. Google publishes threshold guidance of 2.5 seconds for Largest Contentful Paint and 0.1 for Cumulative Layout Shift as the boundary between good and needs-improvement user experience 17. When a client site sits above those thresholds for the URLs that lost position, the diagnosis is not a lost link or a competitor content refresh; it is a UX regression that the analyst has to reconcile before drafting the recovery plan.
| Core Web Vital | Good threshold 17 | Why it matters in a ranking-drop investigation |
|---|---|---|
| Largest Contentful Paint (LCP) | ≤ 2.5 seconds | Slow main-content render on the losing URL cluster often precedes position decay before backlink or content signals shift. |
| Cumulative Layout Shift (CLS) | ≤ 0.1 | Field-measured instability on template-level pages implicates a site-wide change, not the individual URL. |
CrUX thresholds an analyst should reconcile against inside the diagnostic graph before attributing a drop to lost links or lost content share.
Strategy-led practices earn their fee on the sentence that starts "the reason is," not the one that starts "the position is." Semrush and Ahrefs make that sentence defensible, provided the analyst treats CrUX and Google Search Console as inputs to the graph rather than adjacent tabs.
SE Ranking: the mid-market consolidator with AI Overview detection
Consider the agency running 60 client accounts on a seat-priced platform, where the head of SEO has to defend every added tool against margin per account. That constraint is the one SE Ranking is engineered around. It consolidates rank tracking, site audits, competitor research, and white-label reporting into a single mid-market seat, which is why practitioner reviews consistently name it as an agency default at portfolio scale 12, 15.
The differentiator that matters most in 2026 is not the consolidation itself; it is the AI Overview column. On every triggered query, SE Ranking records whether the client domain is cited, whether that citation carries a link, and where it appears within the answer block 11. That level of detection separates it from the general mid-market field, where AI Overview coverage stops at "an Overview appeared." For an agency defending AI visibility on the monthly call, the difference between "we were cited in position two of the answer block" and "an Overview triggered" is the difference between a narrative and a shrug.
The consolidator model earns its keep in the reporting layer. White-label dashboards and API access come at the agency tier, which lets account managers schedule branded exports without pulling analyst time 14. Mid-market generalists — the shops running 40 to 100 accounts across industries rather than one vertical — tend to build the client-facing report inside SE Ranking and reserve deeper diagnostic work for the graph tools in the previous section.
The trade-off is scale. Enterprise-scale portfolios strain the seat model, and agencies pushing past a few hundred accounts often find themselves paying for capacity they cannot fully absorb into one workspace 14. The refresh cadence also does not match a dedicated high-frequency monitor, so shops that promise same-day drop detection pair SE Ranking with AccuRanker, Nozzle, or STAT rather than replacing them.
The operational takeaway: an agency owns this layer when the reporting seat has to carry AI Overview citation data into the client deck without a second subscription. Below that threshold, a diagnostic graph plus GSC covers the same ground. Above it, the seat math stops working.
If you manage multiple locations: Nightwatch, BrightLocal, and Local Falcon
A note on scope: this section speaks to agencies serving multi-location and franchise operators, where the reporting unit is a single storefront, clinic, or branch address rather than a city market. The measurement problem changes shape at that level, and so does the tool decision.
City-level rank tracking flatters the underperformers. When a franchise brand averages pack positions across 40 locations in one metro, a storefront ranking eighth at its own address disappears inside a mean that sits at three. Nightwatch tracks by geo-coordinate rather than city, which surfaces the per-store pack position the average was hiding 15. That granularity is the point of the tool, not a feature list bullet, and it is the reason multi-location specialists tend to build the local layer of their stack around it rather than around a general-purpose tracker.
BrightLocal and Local Falcon occupy the adjacent role: geo-coordinate grid tracking for pack surfaces, with white-label reporting oriented toward location-level client decks 16, 14. Local Falcon in particular built its reputation on the grid view that shows how pack position varies as the search origin moves block by block around a storefront, which turns a single ranking number into a visibility heatmap the location manager can actually act on. API access in this category tends to be narrower than in the general trackers, so agencies stitching grid data into a broader BI layer plan the export path before committing 14.
The trade-off is scope. These tools are built for the local pack and its adjacent surfaces; they do not carry the diagnostic joins that a strategy-led practice runs on the organic side of the same client 16. Multi-location agencies that try to make a local specialist double as the whole rank tracking stack end up rebuilding the organic and AI Overview columns inside spreadsheets within a quarter.
The operational takeaway for a head of SEO running a franchise or multi-location portfolio: own the local column with a geo-coordinate tool and pair it with one of the earlier stack roles for organic and AI-surface coverage. Averaging pack positions at the metro level is what lets underperforming stores stay invisible on the monthly call.
The AI-surface detector: measuring citations, not just positions
The fifth stack role is the one most agencies are still improvising. AI Overview citation tracking sits outside the position-history model that classic rank trackers were built around, and the vendors that do detect Overview presence often stop at the trigger rather than the citation itself. Agencies that skip this layer end up defending AI visibility on the monthly call with anecdotes and screenshots rather than a metric.
The methodology that has consolidated across 2026 practitioner writeups is a fixed query panel. An analyst builds a set of 40 to 80 buyer-intent queries, splits them across awareness, consideration, and demand buckets, and holds the panel stable for at least 90 days so the trend line carries meaning 3. Sampling runs on a fixed weekly cadence with incognito sessions and controlled location parameters so week-over-week movement reflects Google's behavior, not the analyst's browser state 5.
The scoring model turns qualitative citation position into a defensible index. Each query in the panel earns:
- zero points when no AI Overview triggers,
- one point when an Overview appears without the client cited,
- two points when the client is cited among the supporting links, and
- three points when the client is cited prominently inside the answer block itself 3.
Rolling the panel average into a single number gives the head of SEO an executive AI visibility index that survives the monthly deck without a paragraph of explanation.
The share-of-voice layer sits on top of that panel. Citation-based AI Share of Voice divides the number of times the brand is cited by the total number of AI Overviews triggered across the panel, then multiplies by 100 7. That formula produces a competitive comparison a rank tracker can carry into the same report as classic position data, provided the panel stays fixed.
| Citation prominence | Score 3 | What it tells the analyst |
|---|---|---|
| No AI Overview triggered | 0 | Query is not an AI-surface risk this week; monitor only. |
| Overview appears, client not cited | 1 | Competitive citation gap; queue content or entity work. |
| Client cited among supporting links | 2 | Present but low prominence; test schema and passage targeting. |
| Client cited prominently in the answer block | 3 | Defensive posture; monitor for competitor displacement. |
The 0-3 citation prominence scoring model, rolled up as a panel average, converts AI Overview presence into an executive AI visibility index 3.
The operational takeaway: AI-surface detection is a workflow, not a vendor. An agency running SE Ranking already gets trigger, citation, and link position on every query in the tracked set 11. An agency running only a high-frequency monitor or a diagnostic graph builds the panel manually, scores it weekly, and stores the citation log alongside the position history. Either way, the citation column has to appear in the client deck by name. Position data alone no longer explains why a query that ranks second sends fewer clicks than it did last quarter.
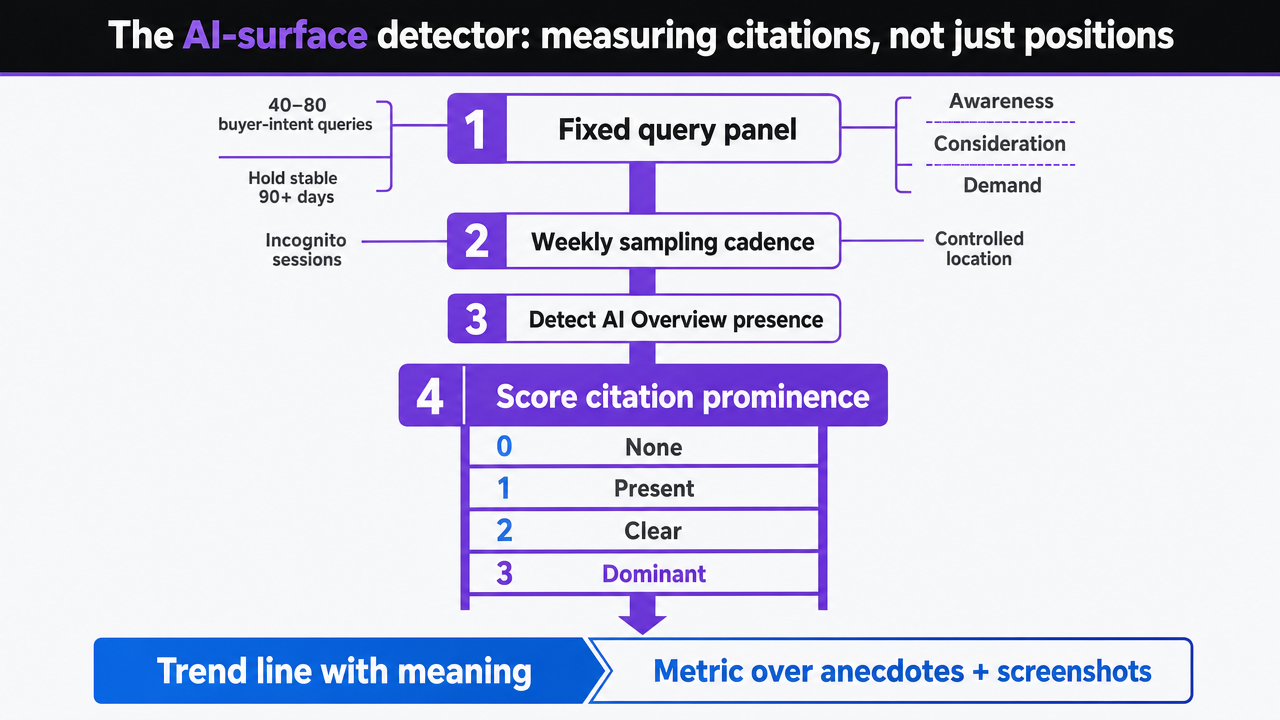 Visualize the 0-3 citation prominence scoring model described in this section as a process/scoring ladder, converting the cited framework into a scannable reference that matches the article's methodology
See How Leading Agencies Automate and Govern Rank Tracking at Scale
Request an in-depth walkthrough of unified rank tracking and reporting workflows built for agencies managing multiple client portfolios, including real-time data integration and approval-first automation.
Vectoron: the approval-workflow layer that routes ranking signals to action
The sixth stack role is the one that closes the loop between measurement and execution. Every tool above surfaces a signal — a position drop, a lost AI Overview citation, a pack shift at a specific storefront, a Core Web Vitals regression — and none of them ship the response. The work of turning a ranking signal into a ranked recommendation, routing it for human sign-off, and executing across content, SEO, PPC, backlinks, and social sits in a category adjacent to rank tracking rather than inside it.
Vectoron occupies that adjacent category. Rather than duplicating the position-history column that AccuRanker, Semrush, or SE Ranking already own, the platform consumes signals from the upstream tracker and produces ranked, human-approved actions on the other side. The approval gate is the operative design choice: ranking signals in, strategic recommendation with the reasoning attached out, human sign-off, then execution across the channels that would otherwise sit in six separate vendor queues.
The reason this layer matters for an agency head of SEO is margin per account. A shop running 60 clients on a strong measurement stack can still lose the monthly call if the answer to "what did we do about it?" is a status update rather than a shipped change. AI-first execution teams — the archetype this role fits — treat the tracker as the sensor and the approval workflow as the actuator, which is what lets one strategist absorb the escalation load that used to require three.
The trade-off is dependency. The approval loop inherits its raw position and citation data from whichever tracker sits above it in the stack, so an agency without a diagnostic graph or an AI-surface detector will not close the loop faster by adding the execution layer alone. Paired with the earlier five roles, it converts the measurement stack from a reporting artifact into an operating system for delivery.
Reconciling every tool against Google Search Console
Every tool named so far produces its own version of the truth. Google Search Console produces Google's version, and that is the one the client's revenue actually responds to. The reconciliation step is what separates a defensible monthly report from a room full of dashboards that disagree with each other by 15%.
The mechanics are unglamorous. An analyst pulls the tracker's position history for a query cluster, then pulls the matching GSC impression, click, and CTR curve for the same URLs over the same window, then reconciles the two before drafting the narrative. When the tracker shows position four and GSC shows an impression collapse, the position is not the story; a SERP feature or an AI Overview absorbed the click yield 16. When the tracker shows a drop and GSC shows stable impressions, the tracker is sampling from a locale the client does not serve.
The AI Overview column now sits inside GSC as its own search type, which changes the reconciliation cadence. Practitioner guidance treats a 20% week-over-week impression swing on the AI Overviews search type as the threshold that justifies a full investigation rather than a note in the log 6. Below that, noise. Above it, the tracker, the citation panel, and the GSC export all have to agree before the recommendation ships.
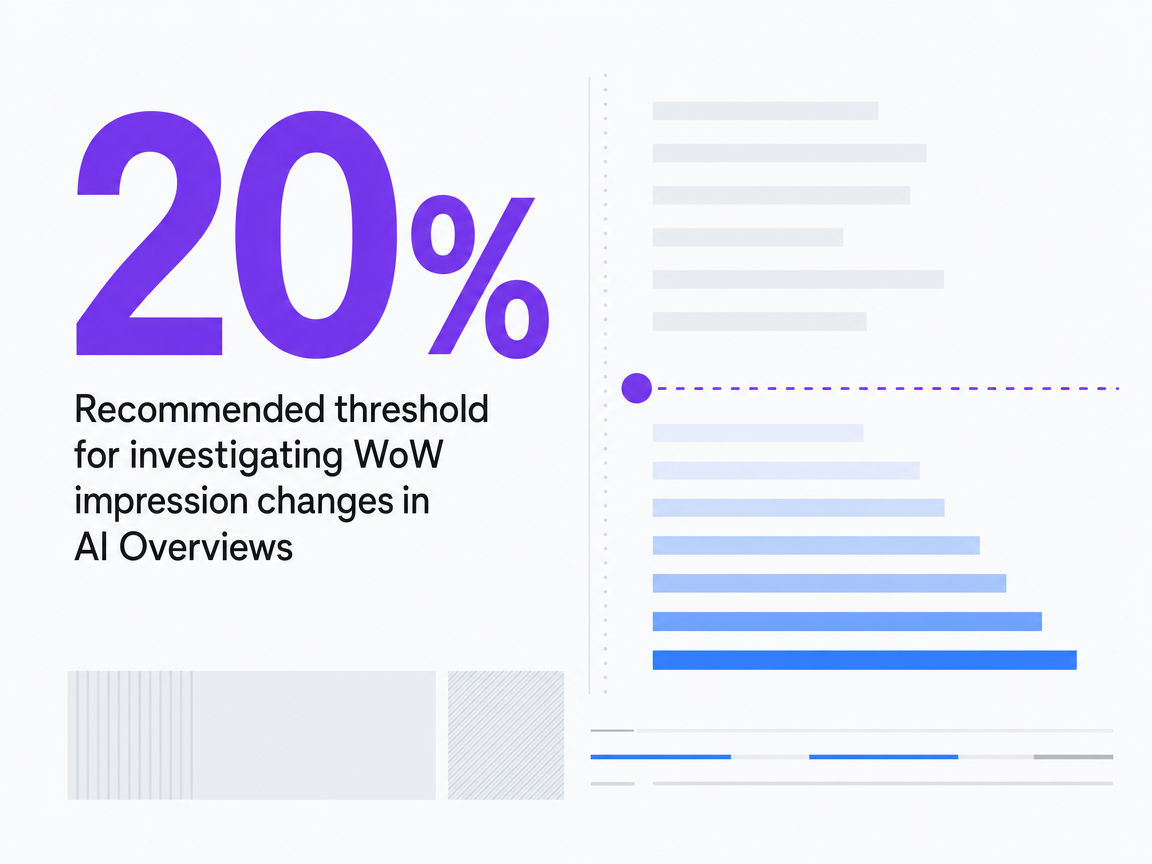 Recommended threshold for investigating WoW impression changes in AI Overviews
Recommended threshold for investigating WoW impression changes in AI Overviews
Build versus buy: when agencies outgrow commercial trackers
At a certain portfolio scale, the seat math on commercial trackers stops making sense and the build conversation starts. Herd's engagement with Motorpoint is the reference point: the team designed a custom ranking tool to deliver multiple levels of SEO rank tracking and organic landscape visibility as the foundation for strategic decisions across a large site 10. That decision is rarely about cost per keyword. It is about control over the schema — how position data joins to internal taxonomies, business units, and revenue attribution that no vendor will model correctly out of the box.
Three conditions push an agency across the line:
- Keyword capacity at the agency tier stops absorbing new client wins without a tier jump 14.
- Client reporting requires joins — to CRM, call tracking, or margin data — that the vendor API cannot serve at the cadence the analyst needs.
- The AI-surface layer demands a citation log the agency wants to own outright rather than rent.
Below that threshold, buying is the correct answer. Above it, the build cost is a fixed engineering line against a reporting layer that has become a competitive asset.
Frequently Asked Questions
References
- 1.Introducing Search Generative AI performance reports in Search Console.
- 2.Google AI Overviews: How To Measure Impressions & Visibility.
- 3.How To Track Your Presence & Visibility In Google AI Overviews.
- 4.Google AI Overviews: Track Your Brand's Visibility.
- 5.How to Track Rankings & Visibility in Google AI Overviews.
- 6.Google Search Console for AI Visibility: How to Track and Optimize AI Overviews.
- 7.Google AI Overviews citation tracking: How to measure your visibility.
- 8.Share of Voice - SEO Visibility & Competitor Benchmarking - SEOJuice.
- 9.Competitor Share of Voice Dashboard in Metabase.
- 10.Motorpoint x Herd partnership - Enterprise SEO case study | Herd.
- 11.How to Measure What Truly Matters in Google's AI Results | Onrec.
- 12.14 best rank tracker software I'm using for SEO in 2026.
- 13.15 Best Rank Tracking Software We're Using for 2026.
- 14.6 Best Rank Tracker Tools for Agencies in 2026 (Tested & Approved).
- 15.Best SEO Rank Tracking Software for Agencies and Teams ....
- 16.Best SEO Rank Tracking Tools for Agencies in 2026 Guide.
- 17.Chrome User Experience Report (CrUX).